All Releases
Learn more about the features in past Tableau releases. Many of the features below were inspired by our very own Tableau Community. If you have an idea for a new feature, we'd love to hear it! Please post your thoughts to the Tableau Ideas Forum.
Tableau July 2026
Tableau July 2026 makes data more trusted, insights more intelligent, and AI easier to adopt so every team can move faster with confidence. Highlights include Tableau Agent Conversational Analytics Enhancements, Tableau Next and Tableau MCPs in Slackbot, and more.
Tableau 2026.2
Tableau 2026.2 delivers capabilities that empower everyone to make decisions with their data. Highlights include Tableau Next Guided Setup, Tableau Agent in Dashboards, Composable Data Sources, and more.
Hosted Tableau MCP
Tableau MCP now runs as a fully cloud-hosted service on Tableau Cloud, removing the need for customers to self-host and maintain their own MCP server. This means you can connect any MCP-compatible AI agent to your trusted Tableau analytics faster and with significantly less overhead. With built-in OAuth 2.1 support, governance, and reliability, you get secure, enterprise-ready AI integration right out of the box.
Hosted Tableau MCP for Tableau Cloud is coming soon, across all editions.
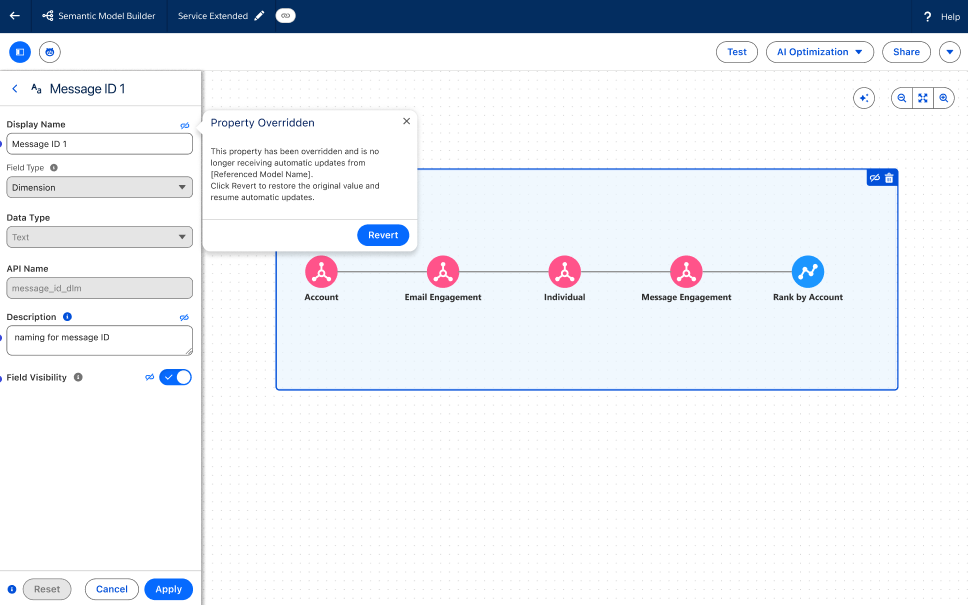
Tableau Semantics: Composability Overrides
Adapt inherited business logic to meet specific requirements by modifying properties like display names and visibility in extended semantic models. This ensures OOTB content reflects unique organizational needs while preserving a single source of truth.
Composability Overrides is generally available with Tableau Next.
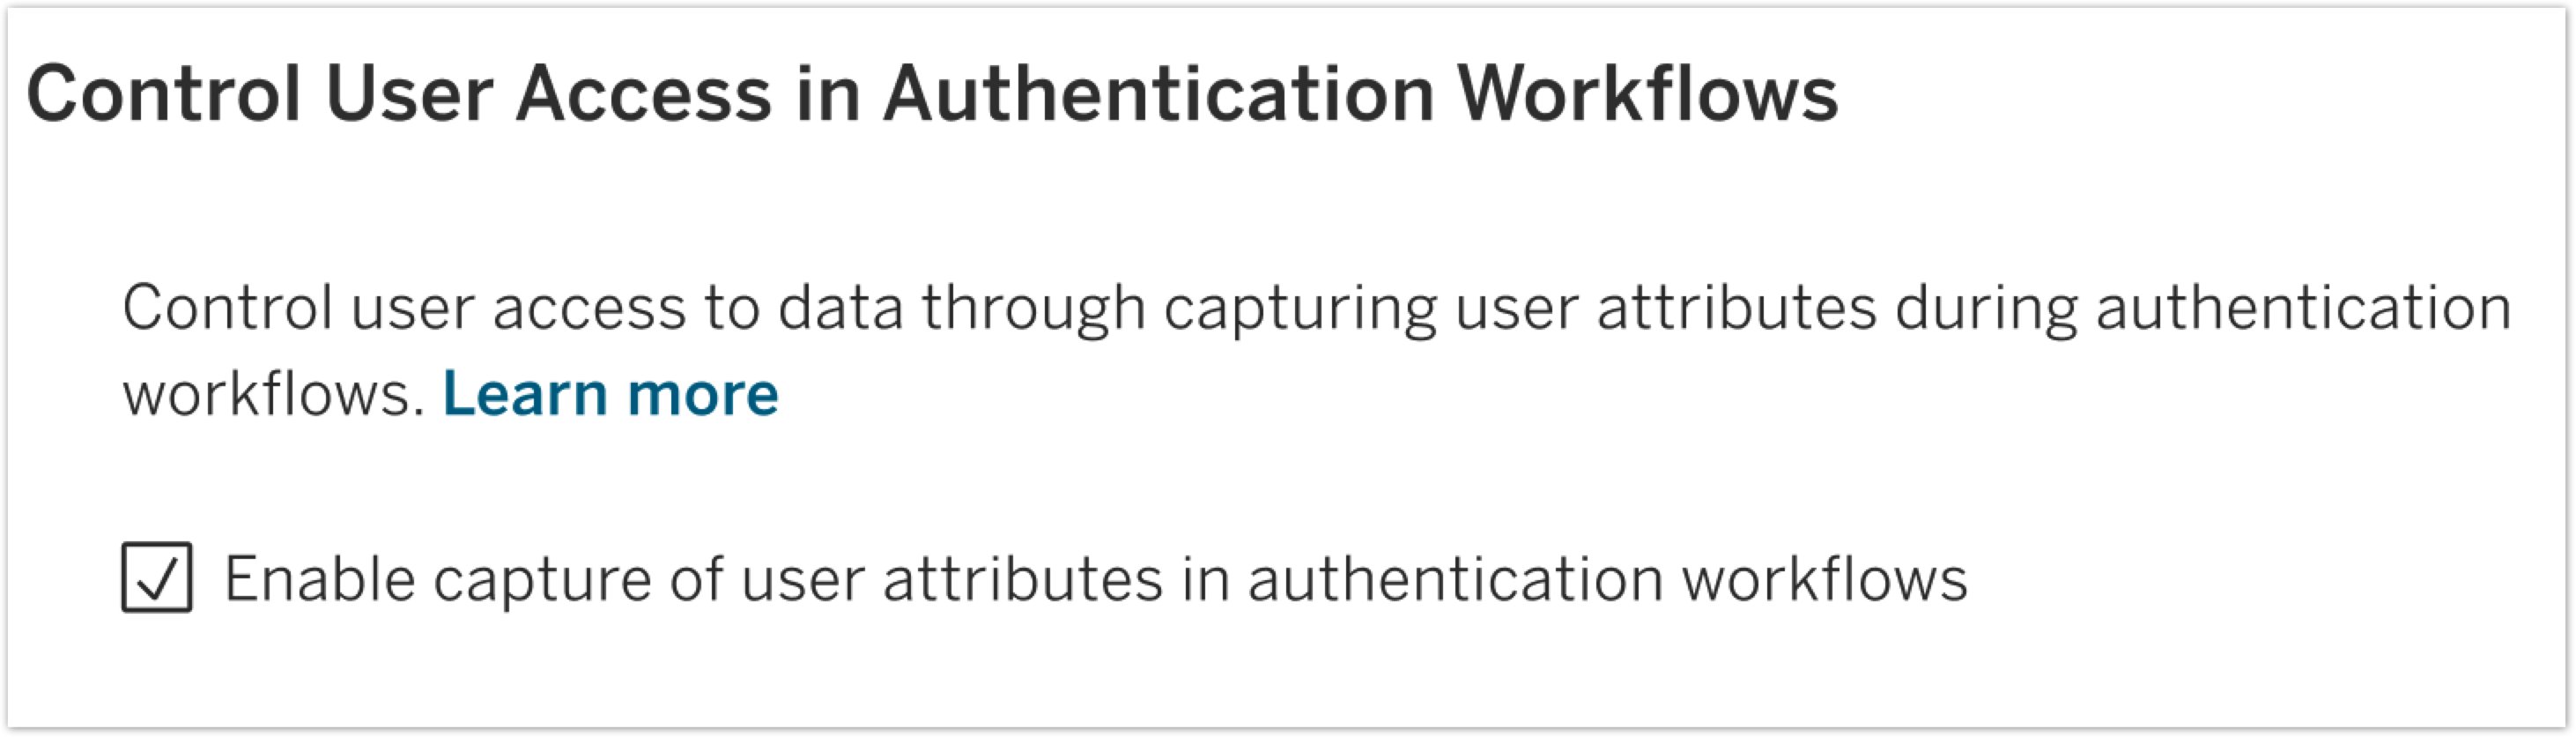
User Attribute Function for SAML and OIDC
Strengthen data security by using attributes passed directly from your Identity Provider for row-level security. This allows for dynamic, attribute-based access control that ensures users only see the data relevant to their role.
User Attribute Function for SAML and OIDC is generally available in Tableau Server.
Tableau Agent in Dashboards: Conversational Analytics (Beta and Pilot)
Business users no longer have to wait to get answers to their data questions. With Tableau Agent in Dashboards, anyone can ask their data questions in plain language and get actionable information immediately. This self-service capability enables every user to get deeper insights from their dashboards by intuitively querying the underlying data source.
Tableau Agent in Dashboards: Conversational Analytics will be available in July as a Beta in Tableau Cloud and a Pilot in Tableau Server.
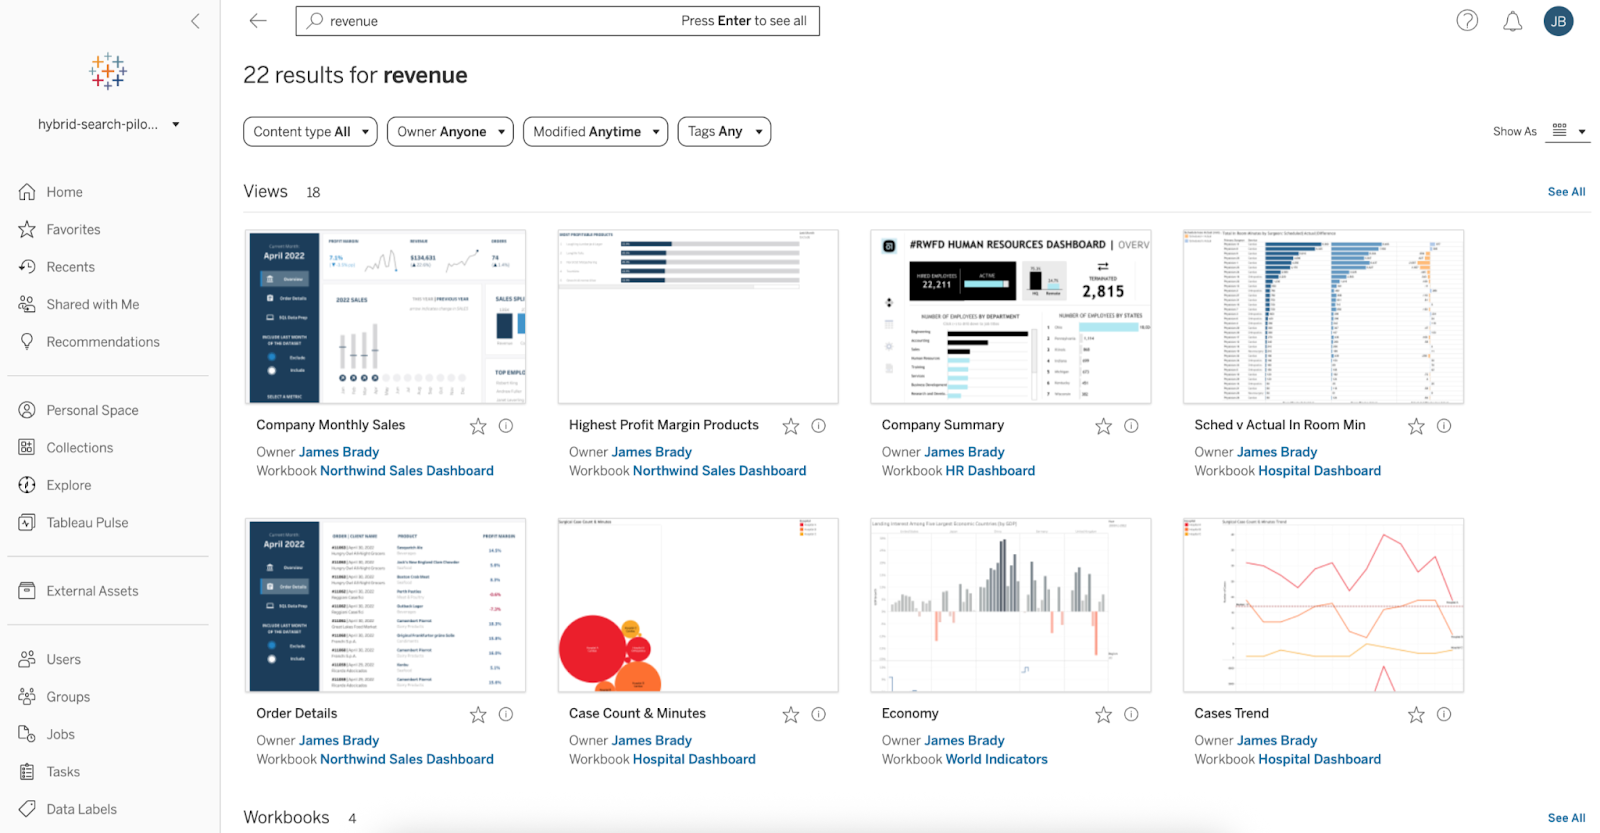
Semantic Search (Pilot)
Find the right Tableau content faster, using natural language. With Semantic Search, you can search for relevant dashboards, data sources, and workbooks using plain language and business concepts—exact keyword match not required. This intuitive search capability drives discovery of existing artifacts, eliminating duplication.
Semantic Search is available in Pilot in Tableau Cloud.
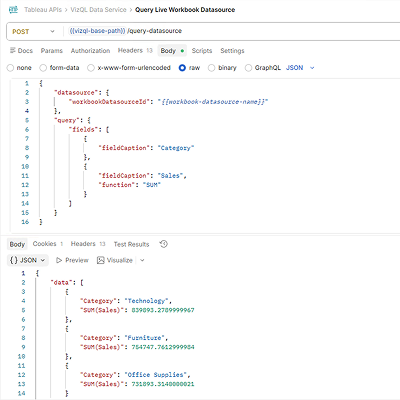
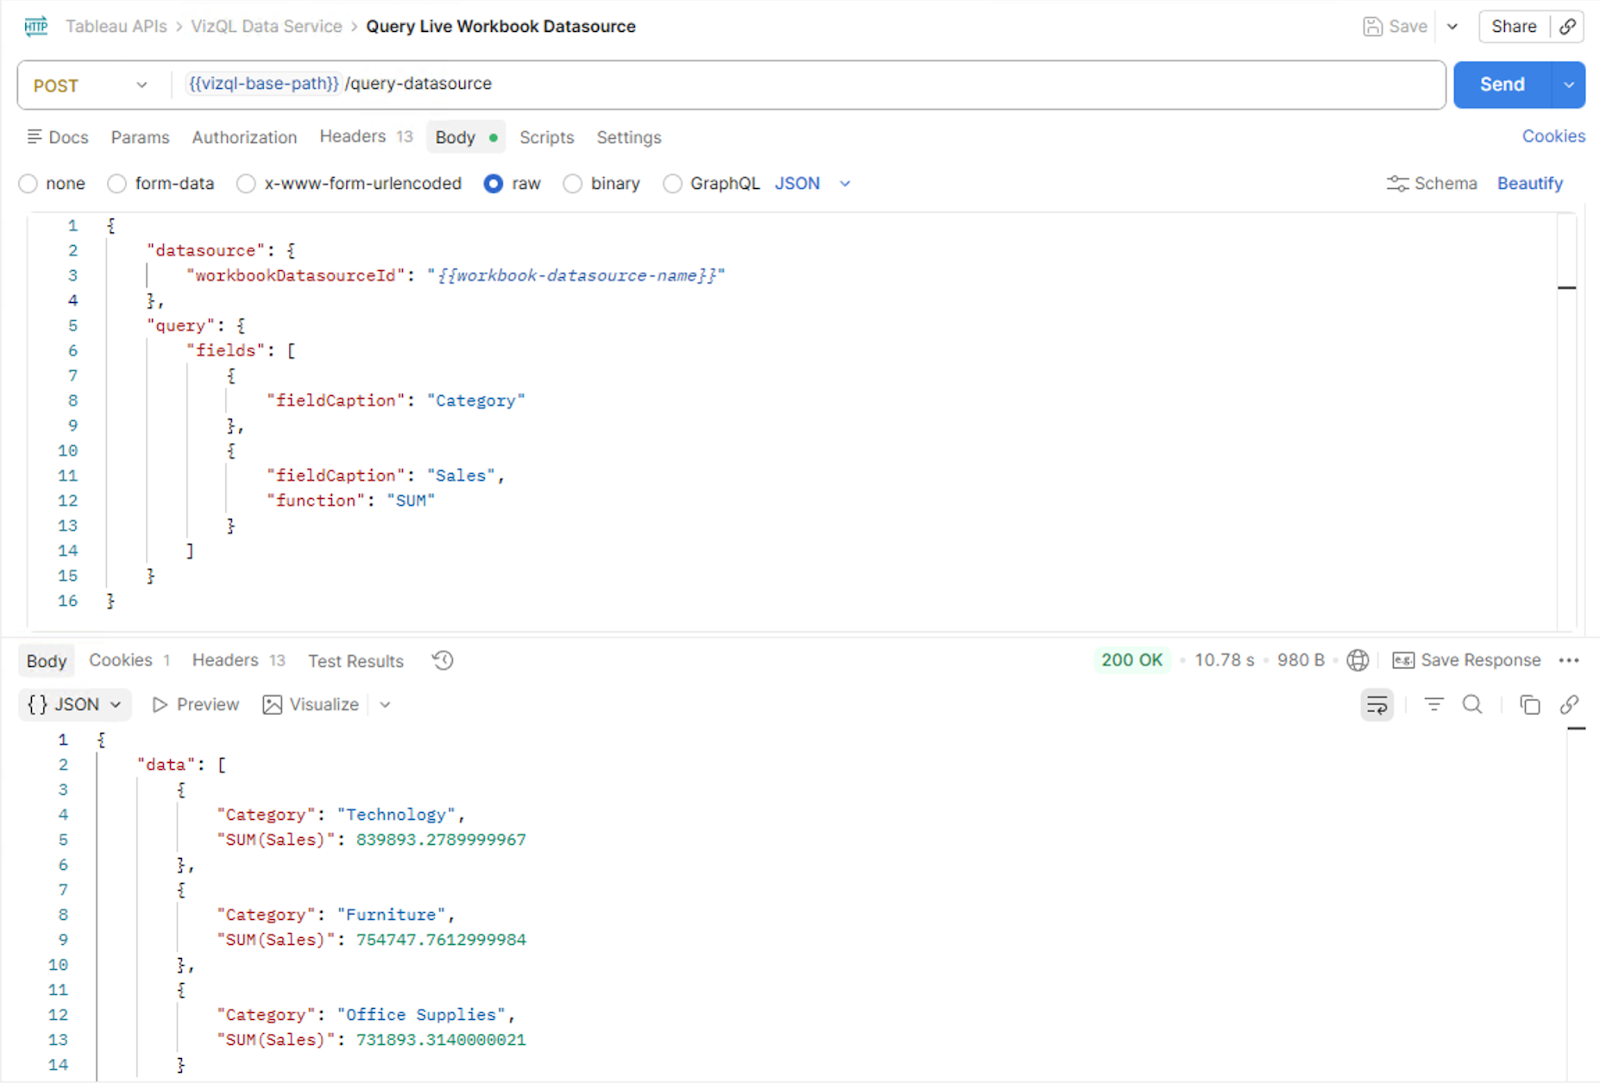
VizQL Data Service: Live Dashboard Query
Building powerful embedded analytics experiences just got easier. With the new VizQL Data Service live dashboard query capability, you can query the data sources behind a Tableau workbook, including embedded ones, directly from your embedding applications. A new Embedding API method provides an identifier for the user's active dashboard session, which is then passed to VizQL Data Service to return data that matches exactly what the viewer sees in their dashboard. This makes it possible to build custom agentic experiences, AI-powered Q&A interfaces, and other deeply integrated applications that tap into live, session-aware Tableau data.
VizQL Data Service Live Dashboard Query is generally available in Tableau Cloud and Tableau Server.
Tableau April 2026 Release
Tableau April 2026 delivers trusted, AI-powered insights wherever decisions are made. Highlights include Tableau Next MCP, Inspector in Slack, Tableau App for Microsoft 365, and more.
Tableau March 2026 Release
Tableau March 2026 offers new capabilities to access smarter insights. Highlights include Rule-Based Semantic Model Authoring, Viz Enhancements, Enhanced Q&A Improvements, and more.
Tableau 2026.1
Tableau 2026.1 has new end-to-end capabilities to build, test, and share your insights. Highlights include Auto-Generate Semantic Models from Workspaces, Q&A Calibration, Enhanced Q&A Updates, and more.
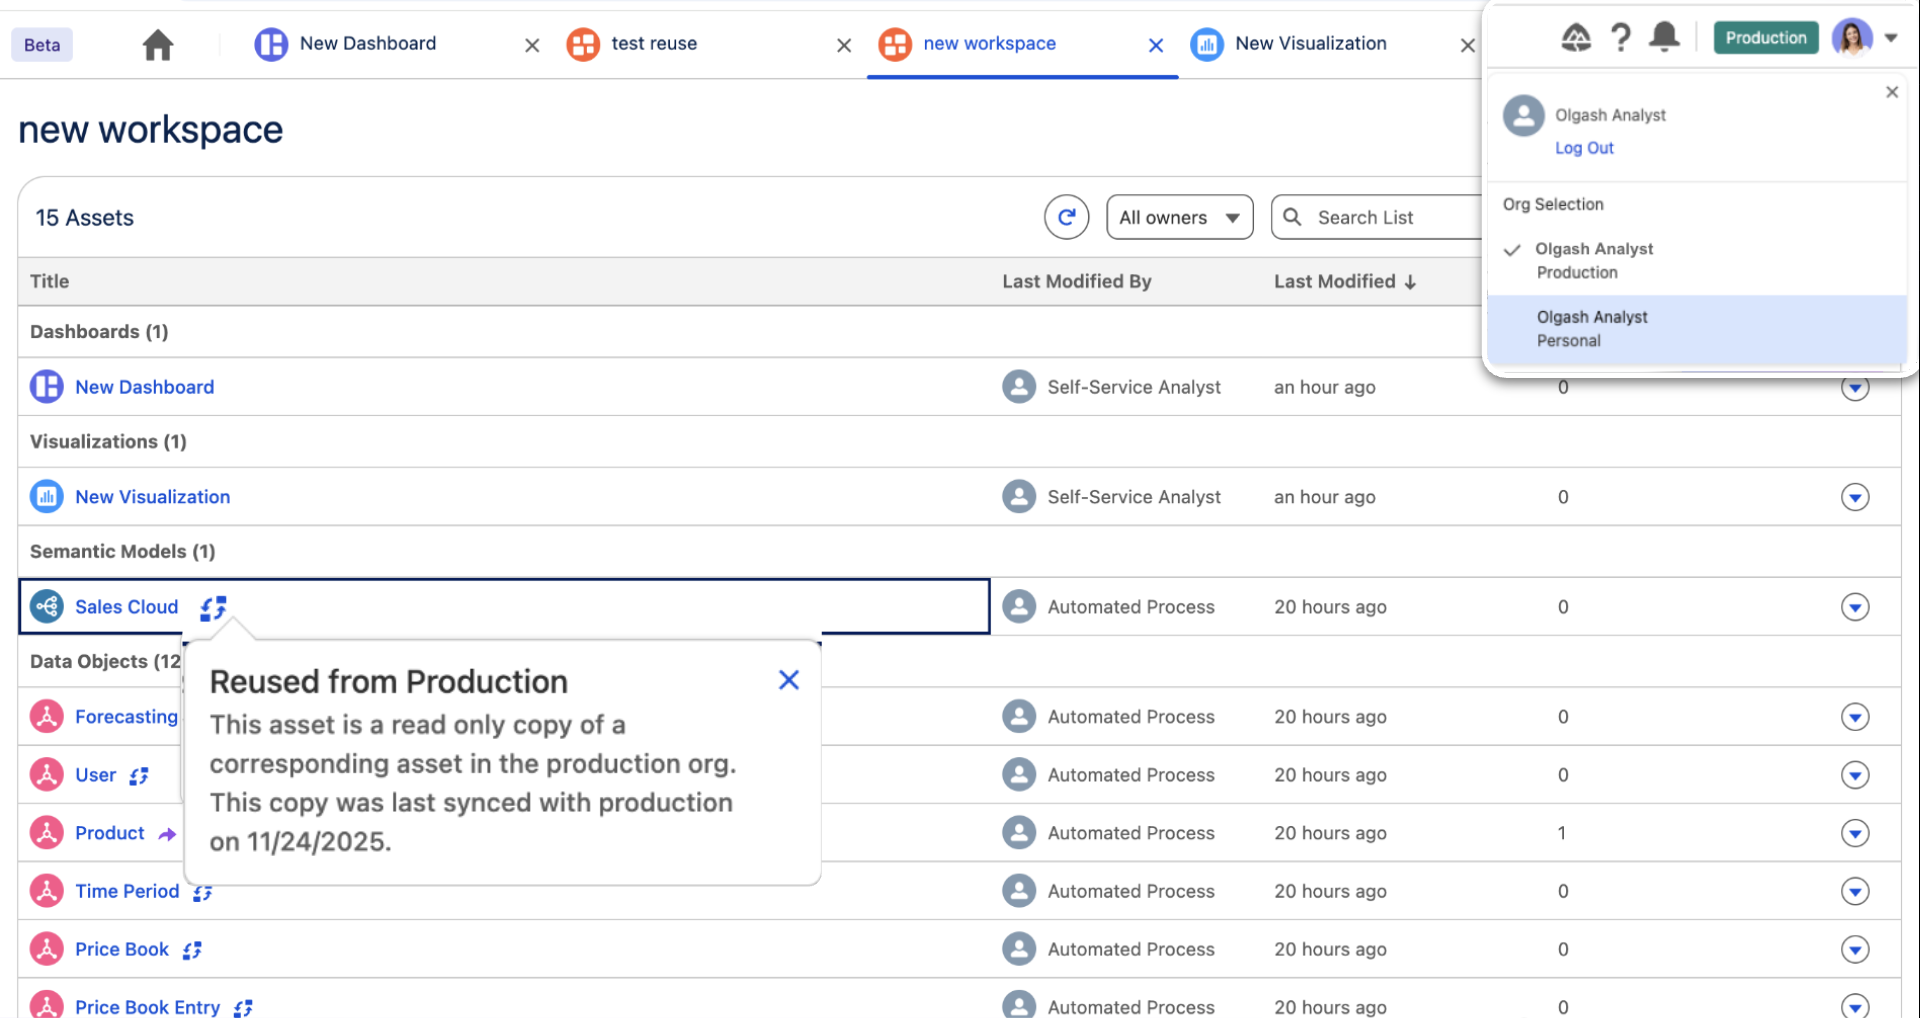
Tableau Next: Personal Orgs (Beta)
Scale innovation while maintaining governance by providing analysts with a secure and flexible environment to build new analytics. Empower teams to self-service by extending governed assets with new data, before approved assets move to production.
Personal Orgs is available in Beta
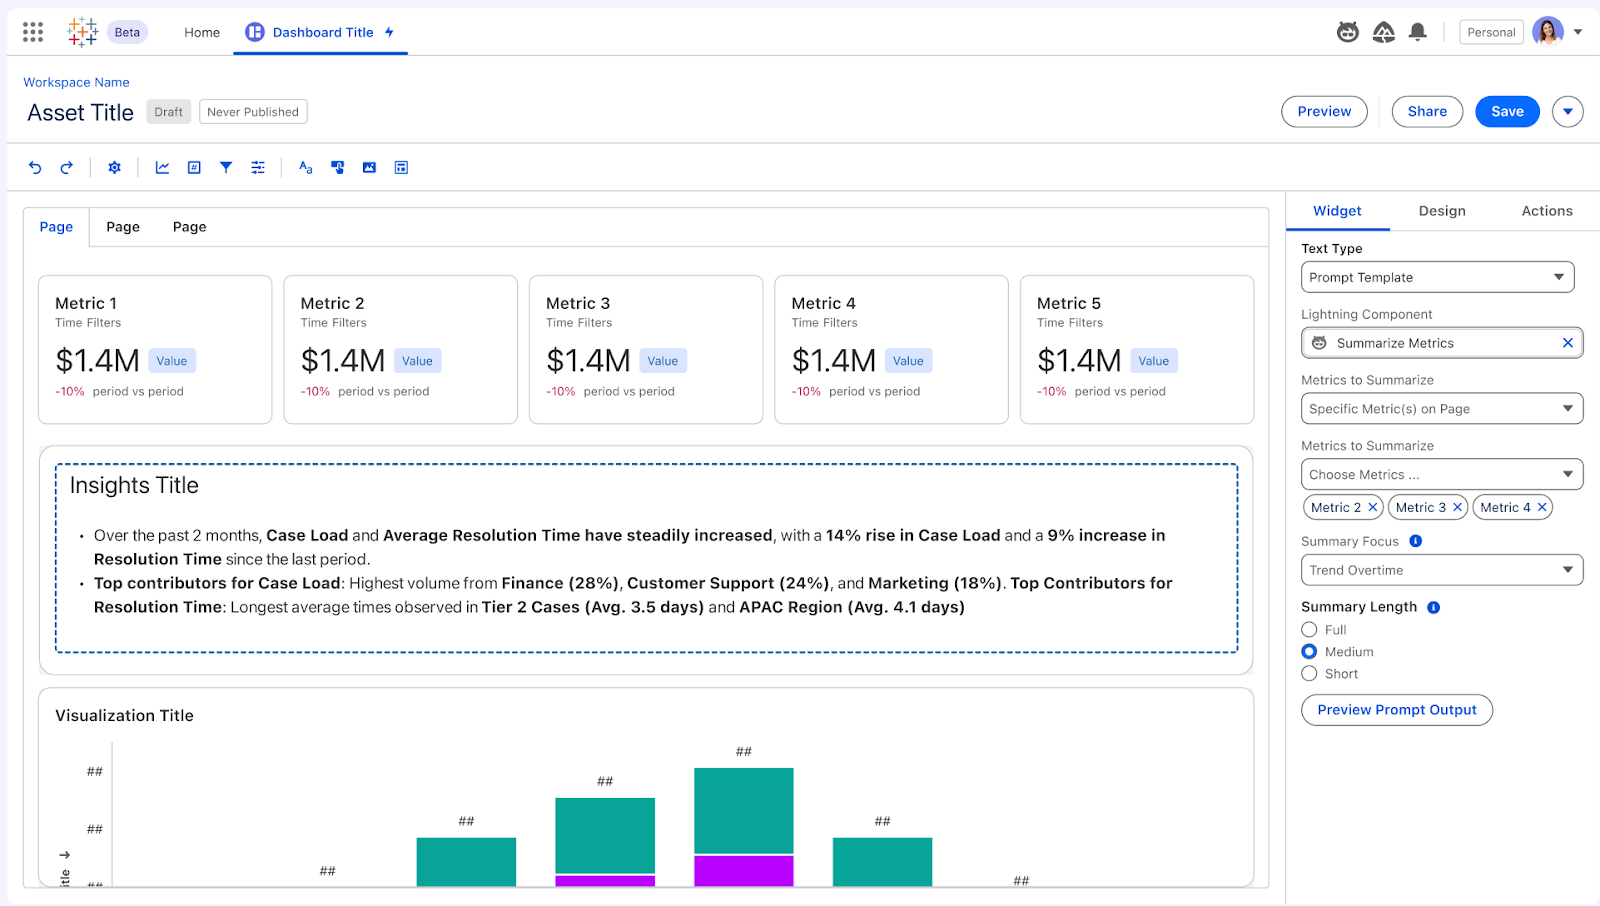
Tableau Next: Dashboard Summaries (Beta)
Quickly understand what is happening and why with dashboard summaries. By configuring a dynamic text component, you can show a text-based summary across metrics.
Dashboard Summaries is available in Beta.
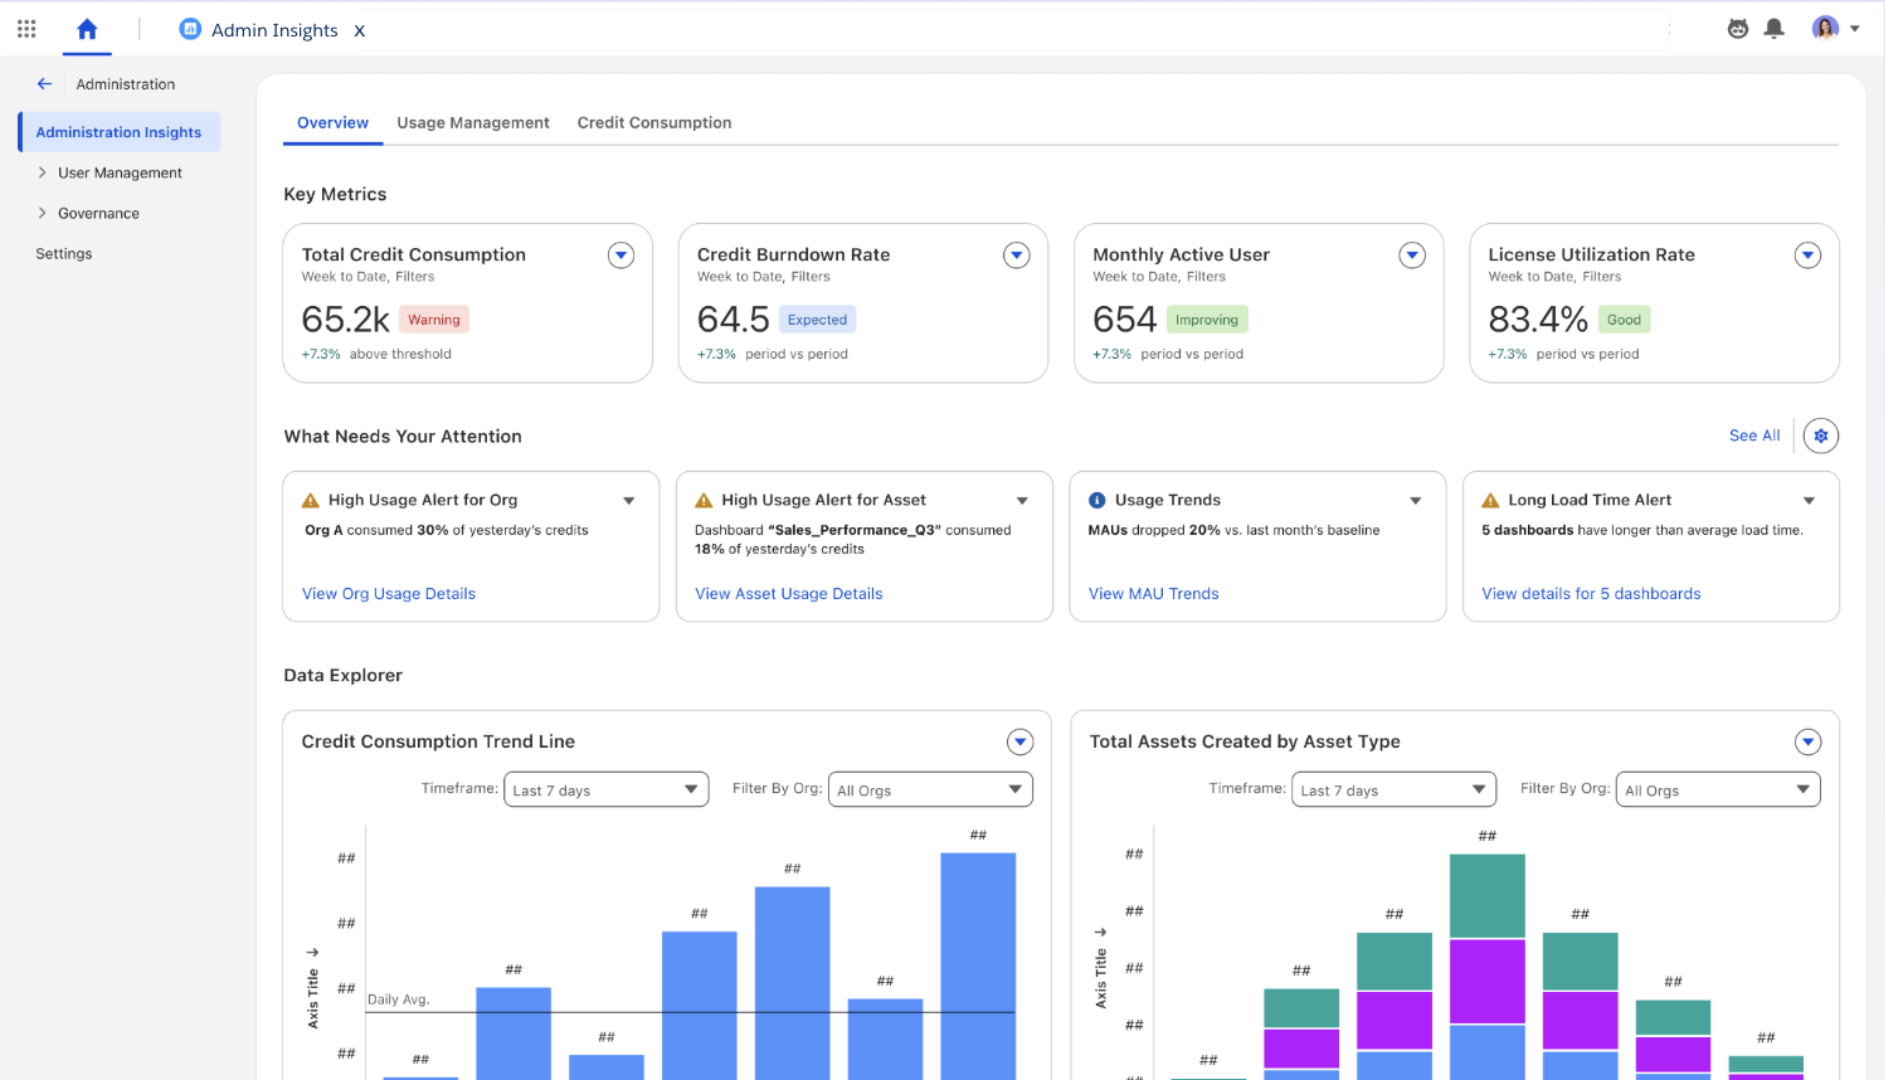
Tableau Next: Admin Insights (Beta)
Move from reactive to proactive analytics adoption with a unified dashboard that consolidates content usage, user engagement, and consumption insights. Quickly identify underutilized assets or inefficiencies to optimize performance with cost-saving recommendations for enhanced administration.
Admin Insights is available in Beta
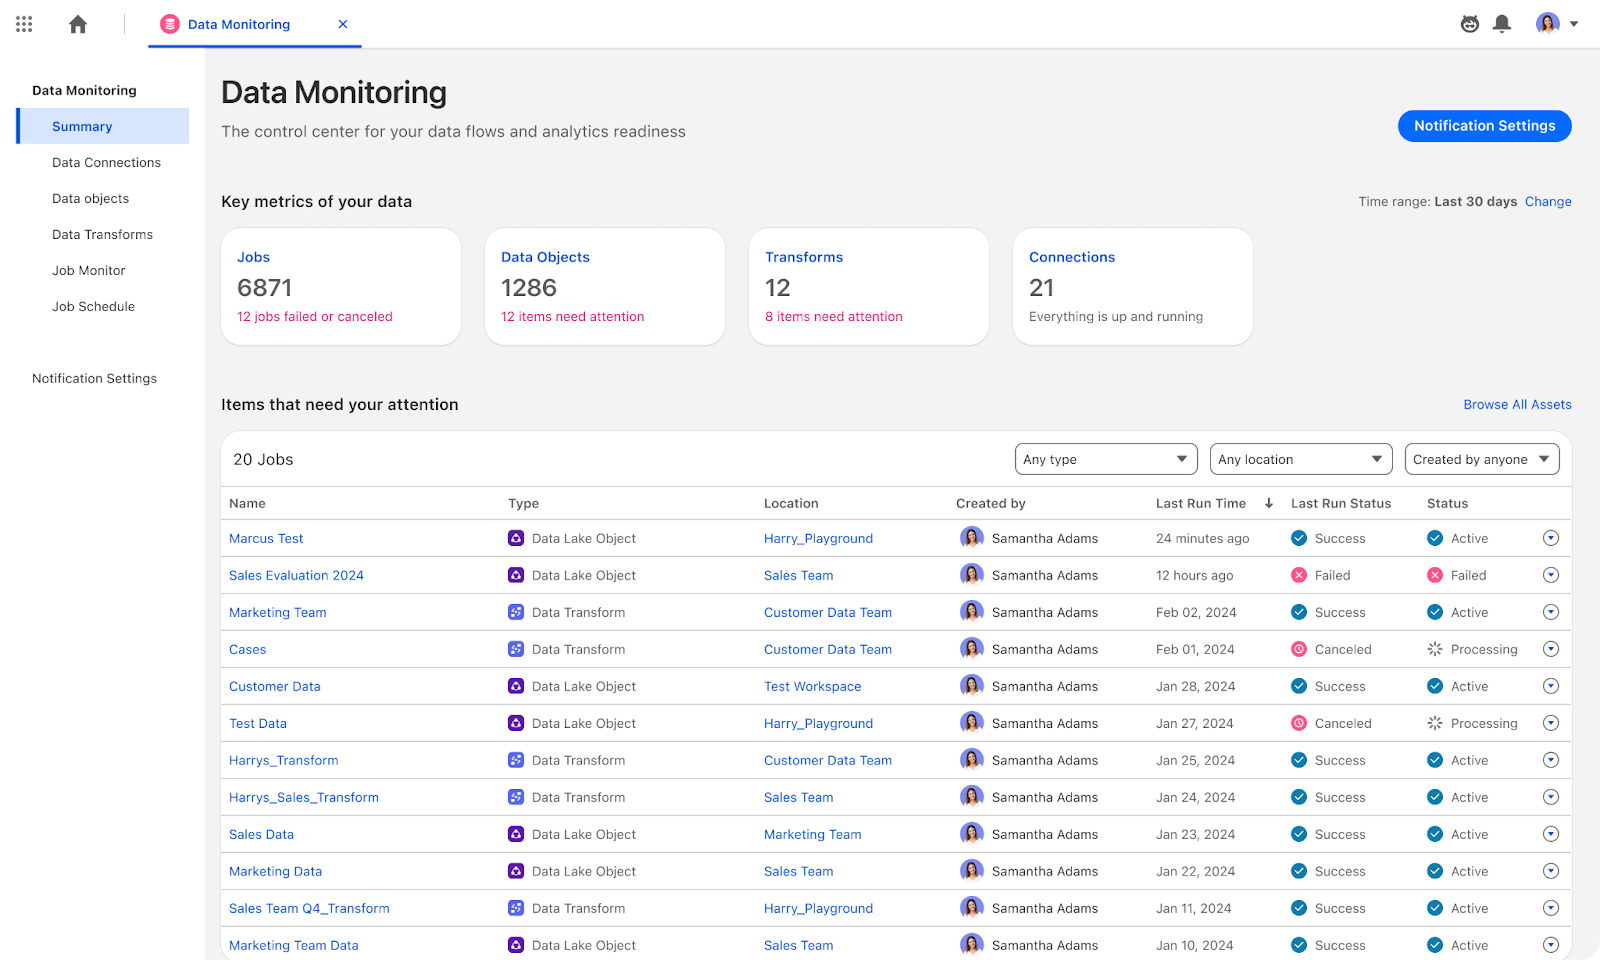
Tableau Next: Data Monitoring
Get a data command center with data orchestration all in one place. Use this centralized hub to seamlessly manage all data assets, centralizing oversight and strengthening data trust through streamlined data preparation.
Data Monitoring is generally available in Tableau Next
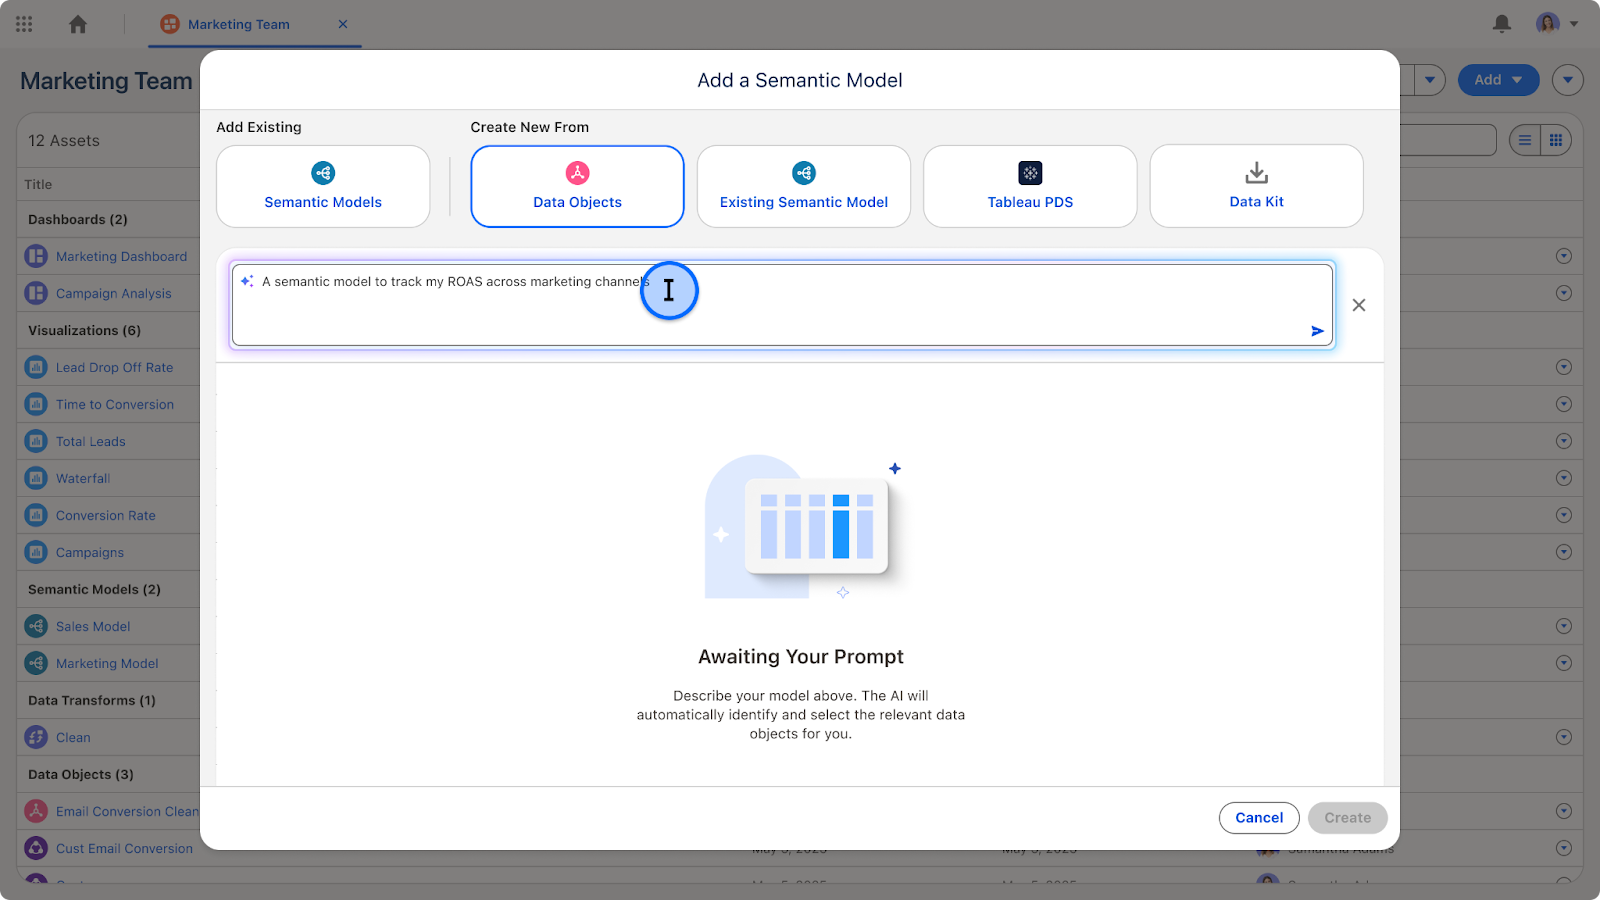
Tableau Next: Data Pro: Auto-Generate Semantic Models from Workspaces (Beta)
Create semantic models with natural language directly from Tableau Next Workspaces. Automatically map objects and relationships to go from raw data to a structured semantic layer in seconds.
Data Pro: Auto-Generate Semantic Models from Workspaces is available in Beta
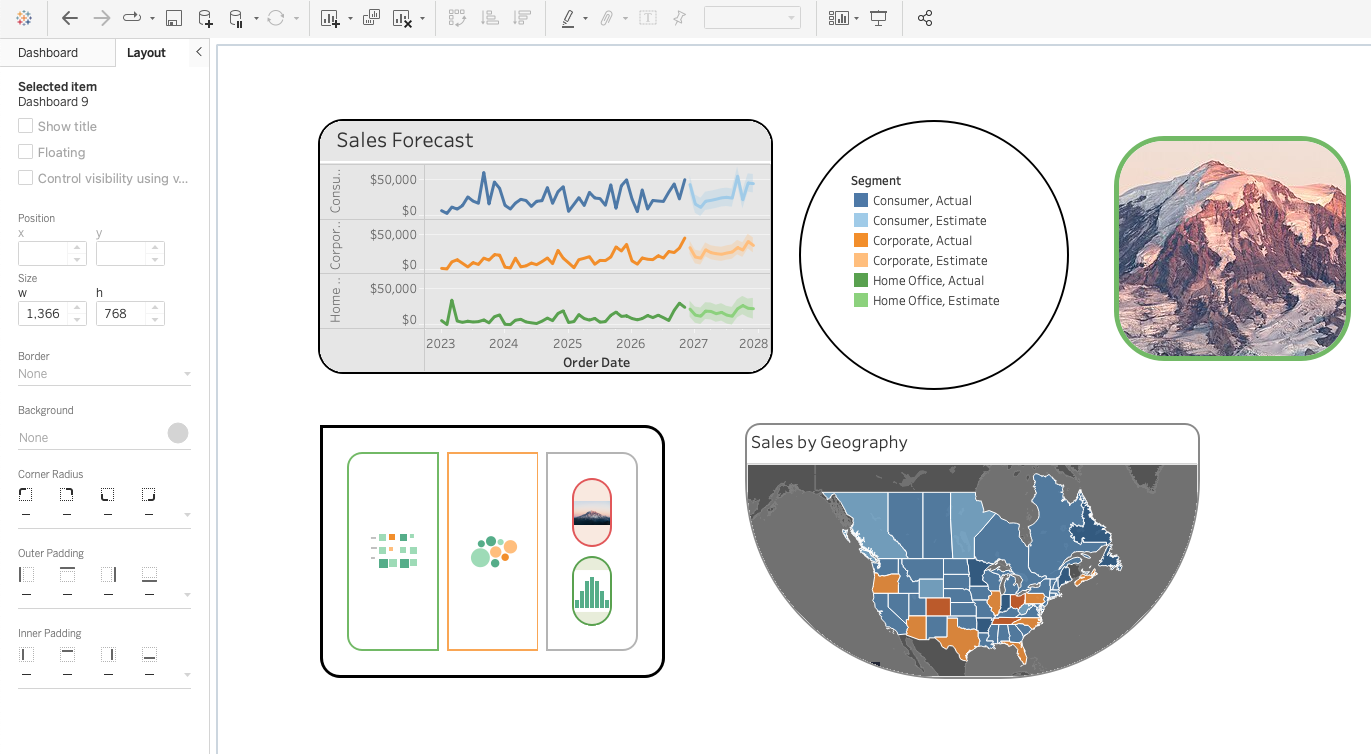
Rounded Corners
Set a corner radius for dashboard objects directly in Tableau Desktop and Web Authoring. Say goodbye to jumping through hoops with annotations or images. Just set the radius value to create a simple rounded corner or a more extreme corner radius to create different shapes.
Rounded Corners is generally available in Tableau Desktop, Tableau Cloud, and Tableau Public
Tableau January 2026 Release
Tableau January 2026 offers new capabilities to track and access your data. Highlights include Pace to Goal Insight, Mark Favorite Metrics, and more.
Tableau 2025.3
Tableau 2025.3 offers new capabilities to help you unlock AI-powered analytics where you work. Highlights include Q&A Calibration, Tableau Agent in Tableau Server, Dashboard Narratives and more.
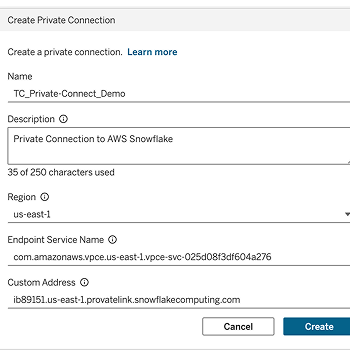
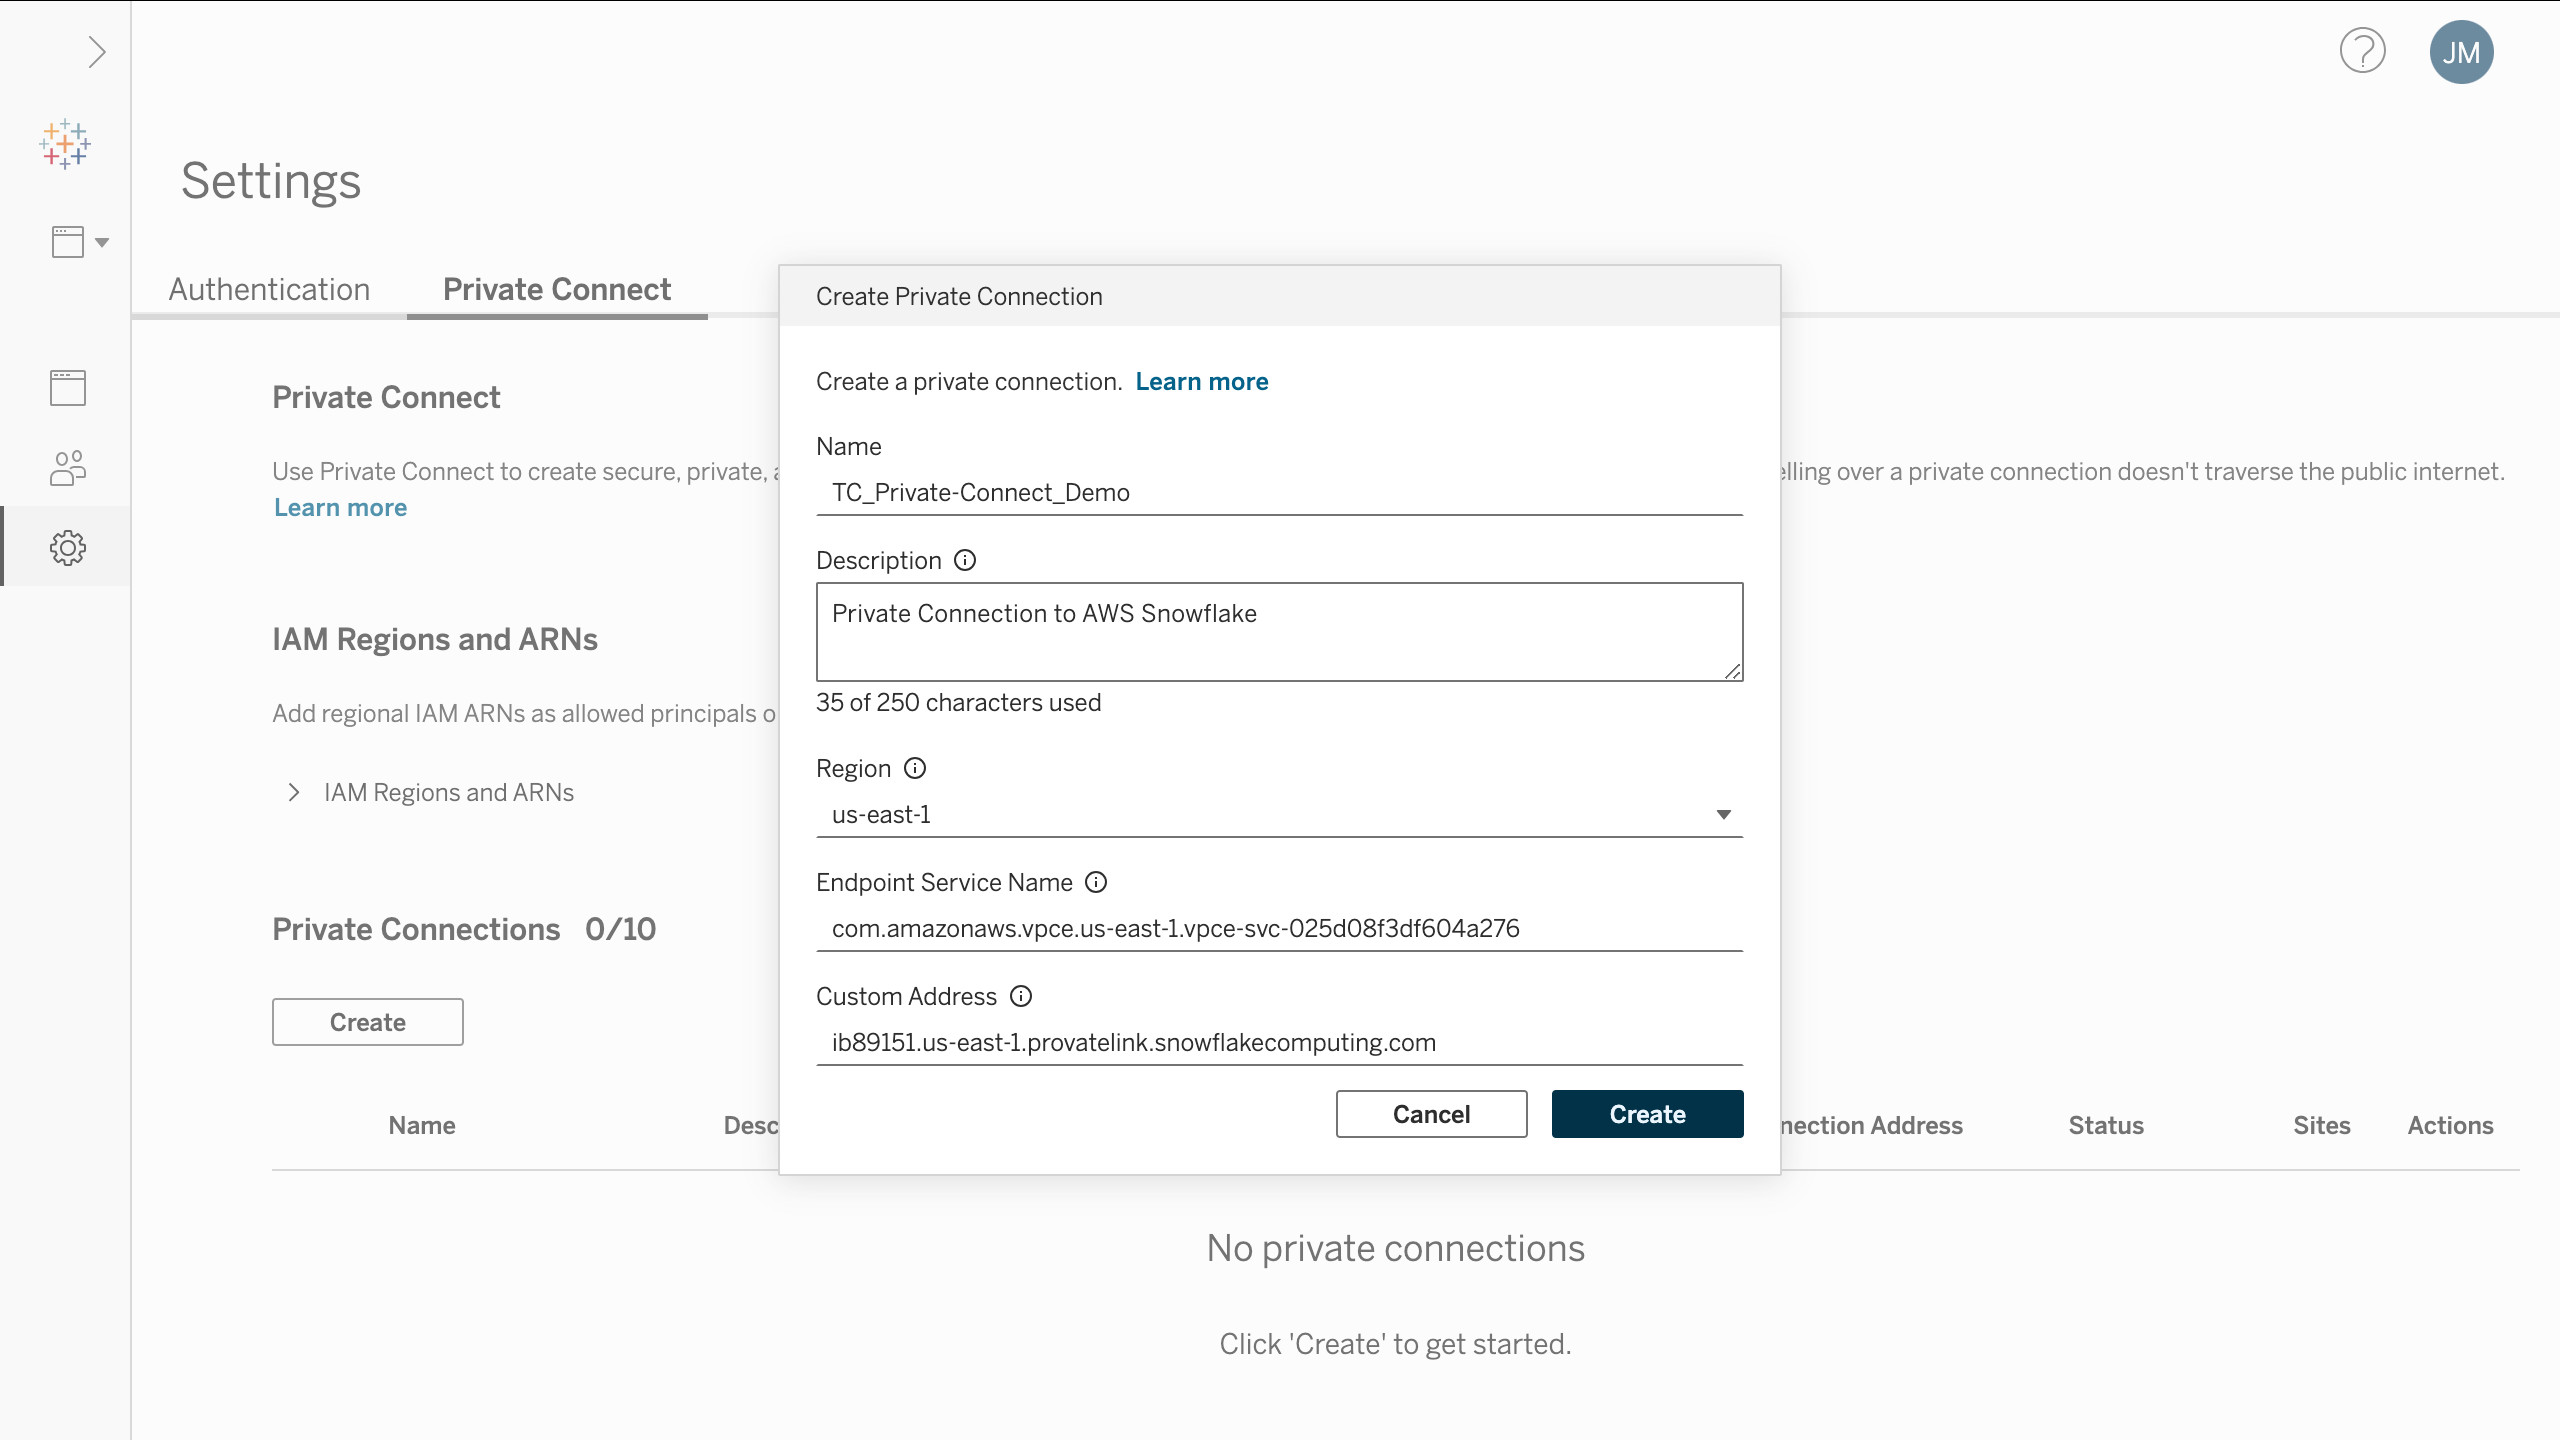
Private Connect: Additional Connectors
Enhance your security by keeping the connection to data private and off the public internet. Tableau Cloud customers can now connect their AWS-hosted databases, such as PGSQL, MySQL, MSSQL, OracleDB, and Aurora, to Tableau Cloud using the AWS Private Link, which provides a secure, dedicated, and private connection, avoiding exposure to the public internet.
Additionally, Private Connect can have cross-region connectivity for Redshift, PGSQL, MySQL, MSSQL, OracleDB, and Aurora. And offers Virtual Connection support.
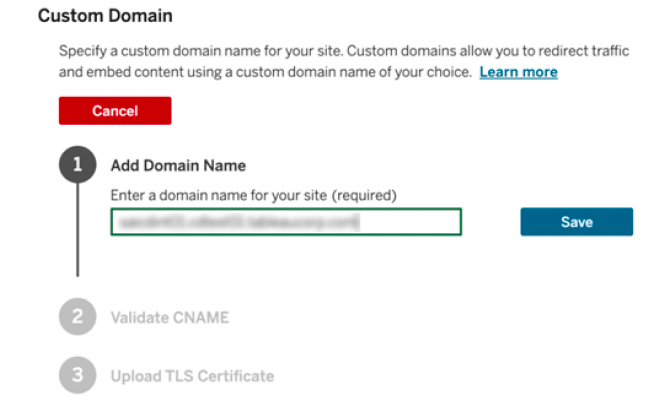
Custom Domains
Provide a branded and seamless experience for your users with custom domains for your Tableau Cloud site. Eliminate the need for third-party cookies in embedded scenarios and give users a simple, memorable URL for accessing their analytics.
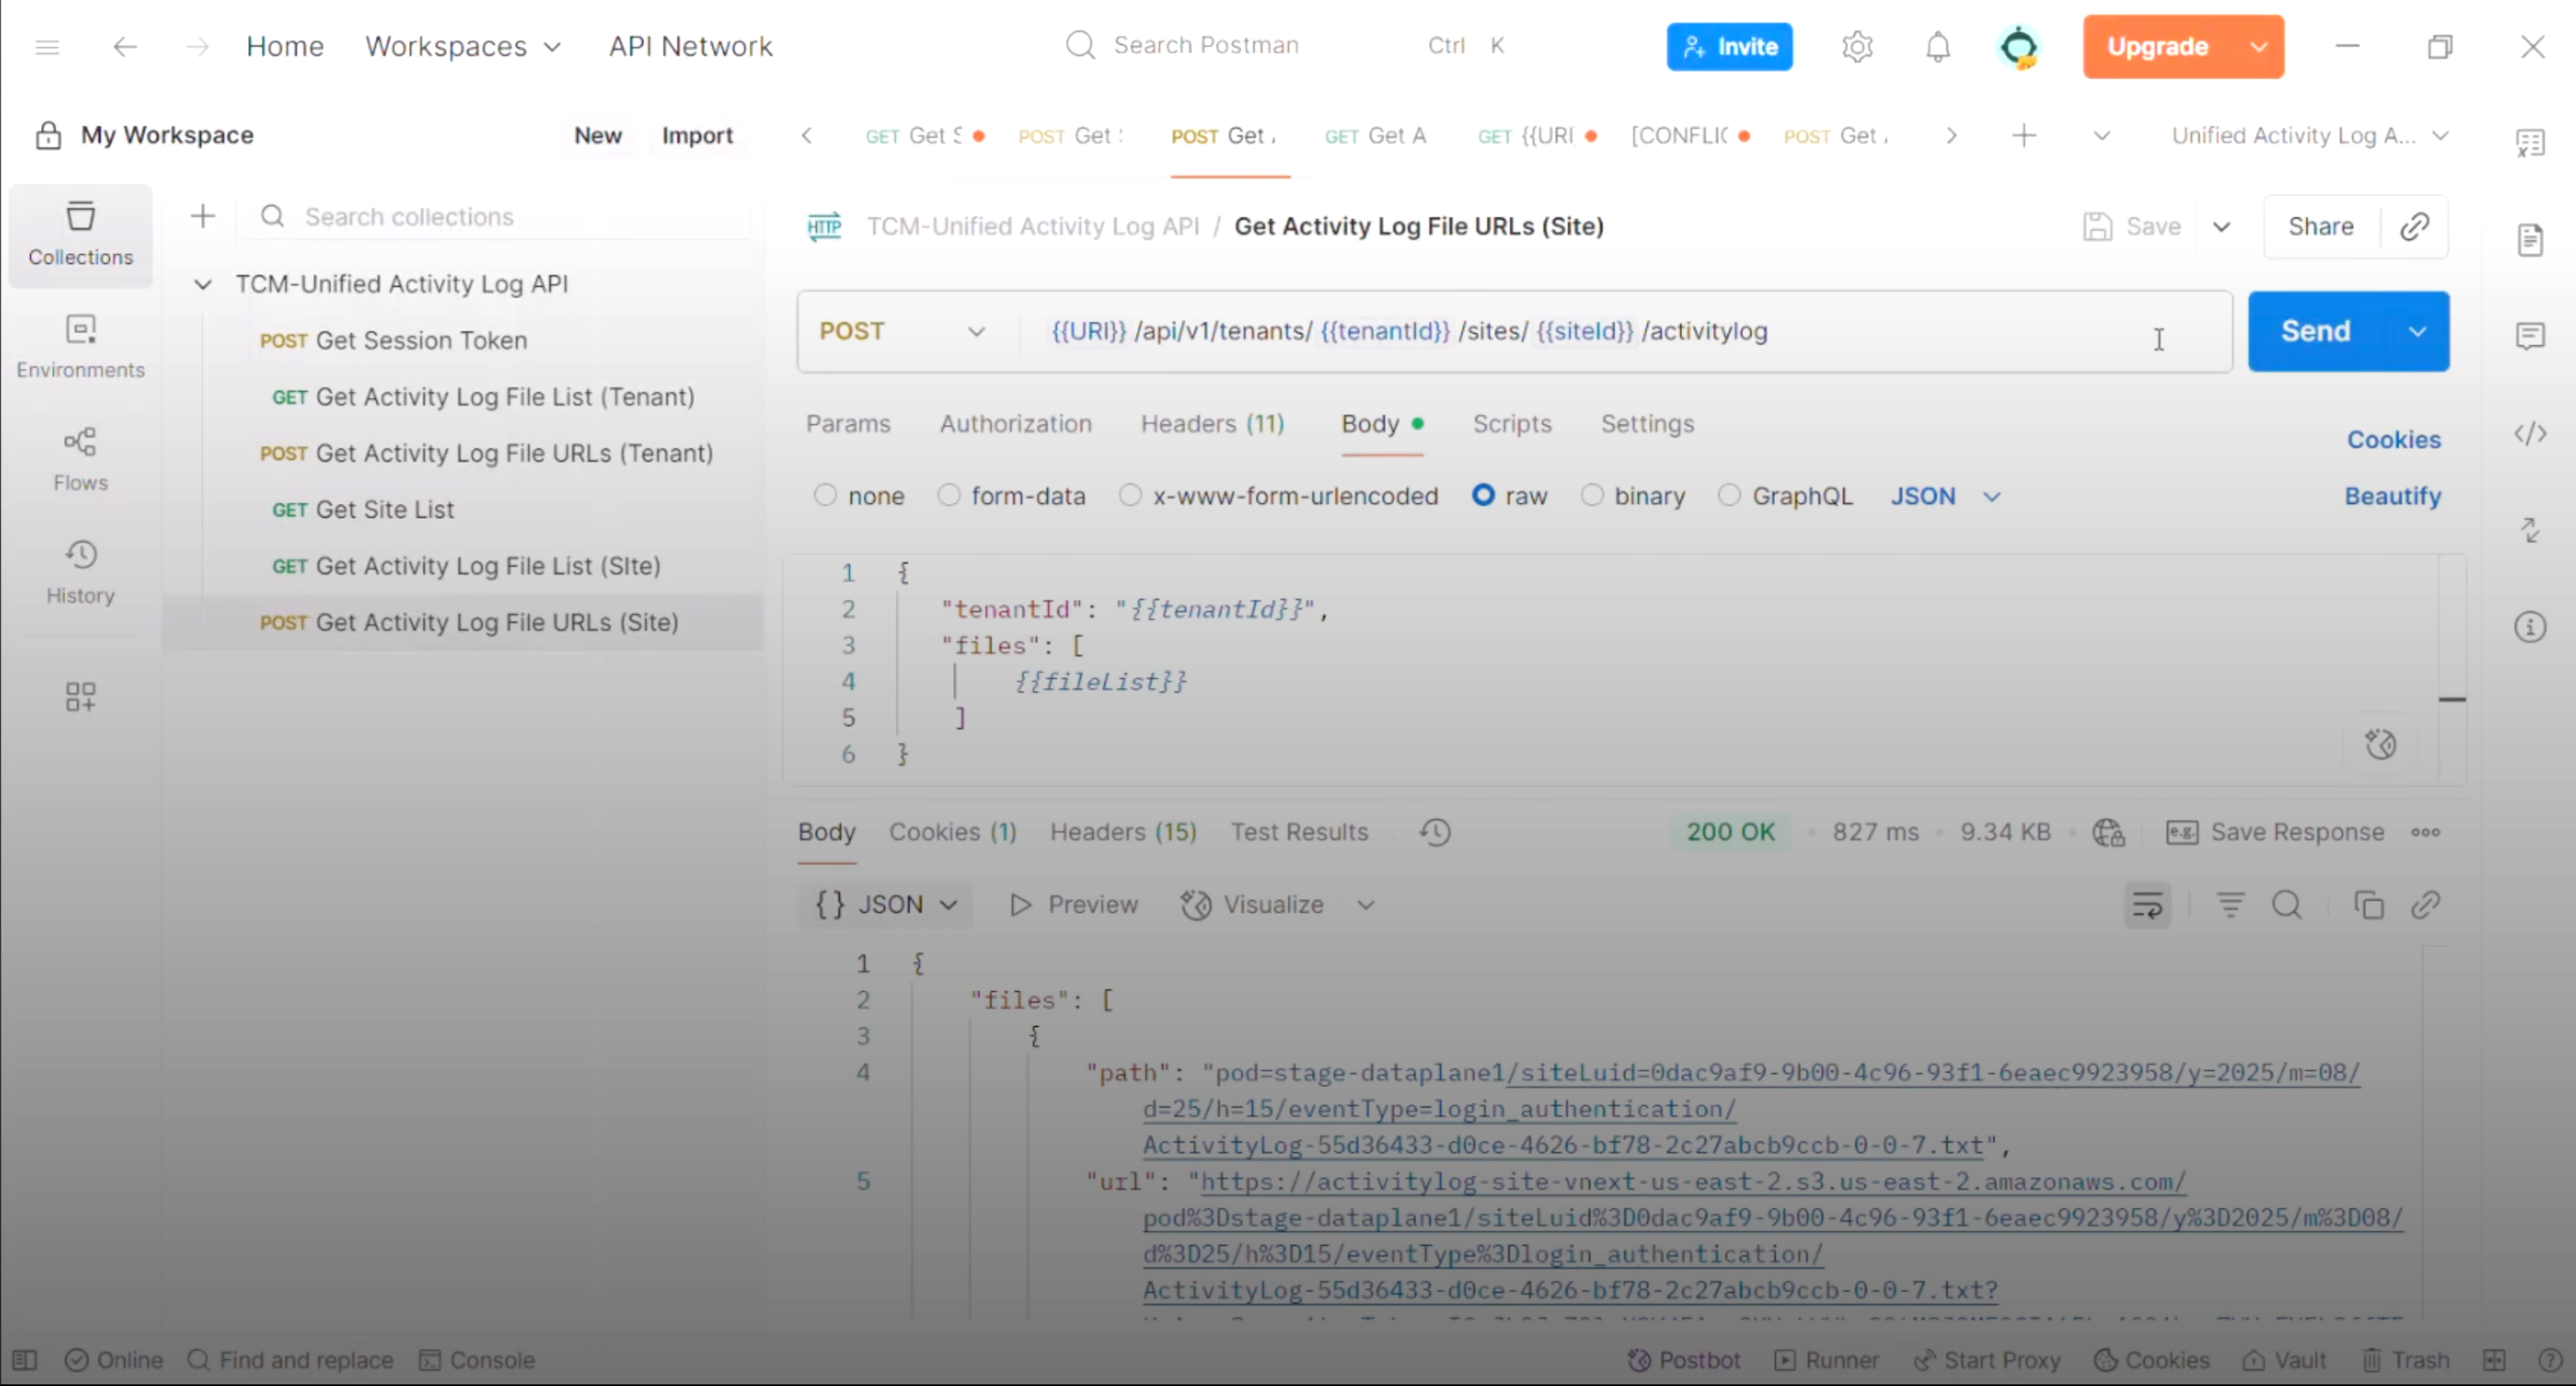
Platform Data API
Gain programmatic access to your Tableau Cloud activity and events data without requiring an AWS S3 integration. Use the new API to retrieve unified event logs for custom monitoring, SIEM ingestion, or analytics in your own data warehouse. Note: Near real-time logs and S3 integration only available with Tableau Enterprise or Tableau+ bundle.
This feature addresses or partially addresses the following request on the Salesforce IdeaExchange: Activity Log support for S3 in other AWS regions.
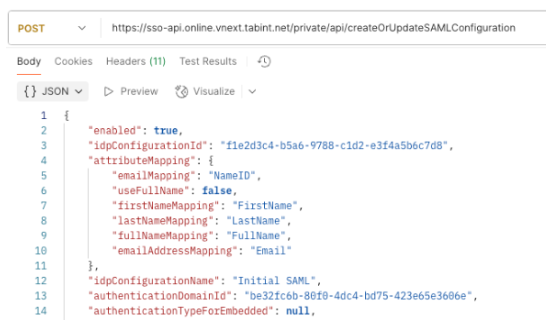
Configure SAML via REST API
Achieve greater efficiency and scale when managing security for multiple sites with the new SAML Configuration REST APIs. Programmatically configure SAML in both Tableau Cloud Manager or a Tableau Cloud site and create scripts to automatically rotate Identity Provider (IdP) certificates.
User Attribute Function for SAML and OIDC
Enhance row-level security with user attributes passed directly from your Identity Provider. Secure data with attribute-based access control (ABAC) through the User Attribute Function (UAF) by dynamically passing attributes from the IdP using SAML or OIDC authentication tokens. This ensures users only see the data they are authorized to see.
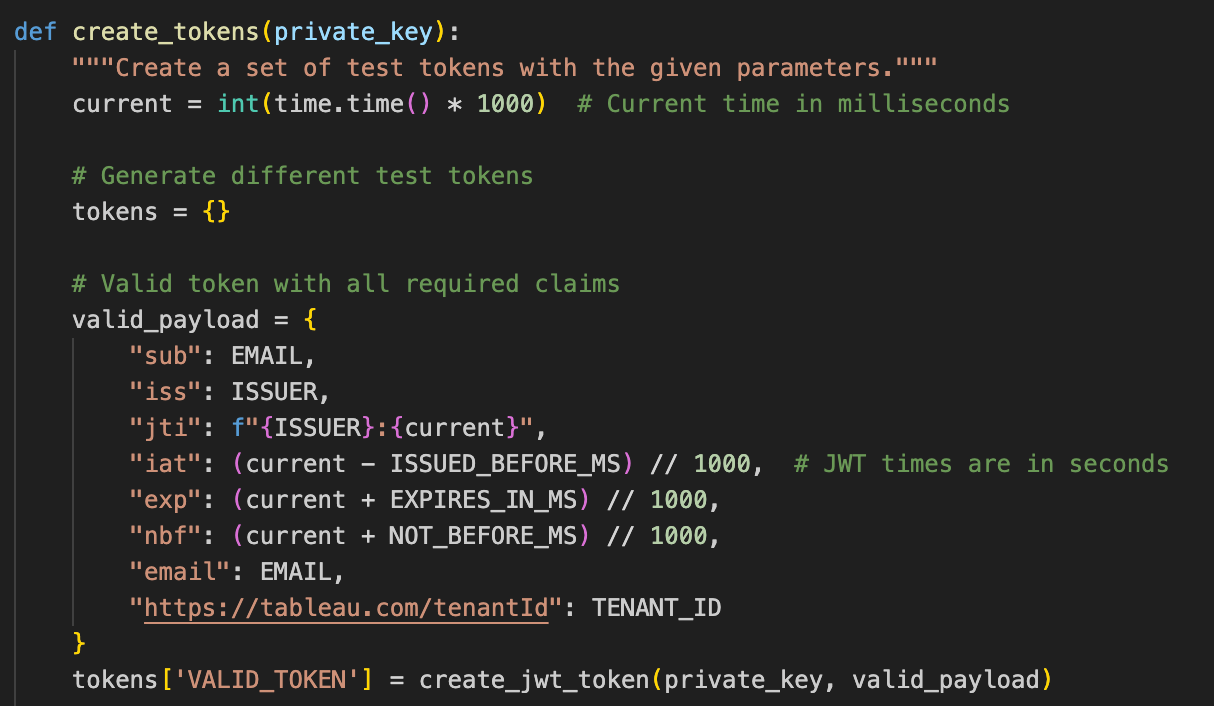
Tableau Cloud Unified Access Token
Simplify multi-site management and enable robust automation with a unified JWT authentication solution. This modern, secure method replaces difficult-to-manage Personal Access Tokens, allowing you to centralize API access across your entire Tableau Cloud environment.
Tableau November 2025 Release
Tableau November 2025 Release has new capabilities to help you uncover data-driven insights faster. Highlights include MCP Server, Published Data Sources, External Embedding, and more.
Tableau October 2025 Release
Tableau October 2025 Release has new capabilities to help you make smarter decisions. Highlights include Inspector, Tableau Next Slack Enhancements, Visualizations and more.
Tableau September 2025 Release
Tableau September 2025 Release has new capabilities to help you dig deeper into your metrics. Highlights include New Enhanced Q&A Updates, Correlated Metrics, and more.
Tableau August 2025 Release
Tableau August 2025 Release has new capabilities to help you get to insights faster. Highlights include Data Pro, Tableau Next and Slack, Viz Enhancements, Threshold Alerts, and more.
Tableau 2025.2
Tableau 2025.2 has new capabilities to help you deliver trusted insights with agentic analytics and embed vizzes and metrics where you need them. Highlights include Concierge, Semantic Learning, Tableau App for Google Workspace, and more.
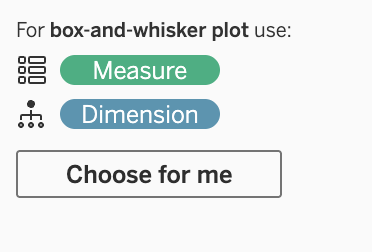
Show Me 2.0
Tableau's classic Show Me just got even better. With an improved experience designed to help users get started faster, all visualization types are now available upfront—no need to select fields first. This update lowers the barrier to entry for new users by making it easier to explore data or let Tableau suggest a starting point. It’s the same trusted feature, now even more intuitive and welcoming.
Dynamic Color Ranges
Dynamic Color Ranges help you highlight what matters, even with outliers in your data. Instead of filtering, use parameters to adjust your color scale and focus attention where it counts. It’s a fast, flexible way to keep your charts clear and insightful.
This feature addresses or partially addresses the following request on the Salesforce IdeaExchange: Dynamic Colors throughout Tableau.
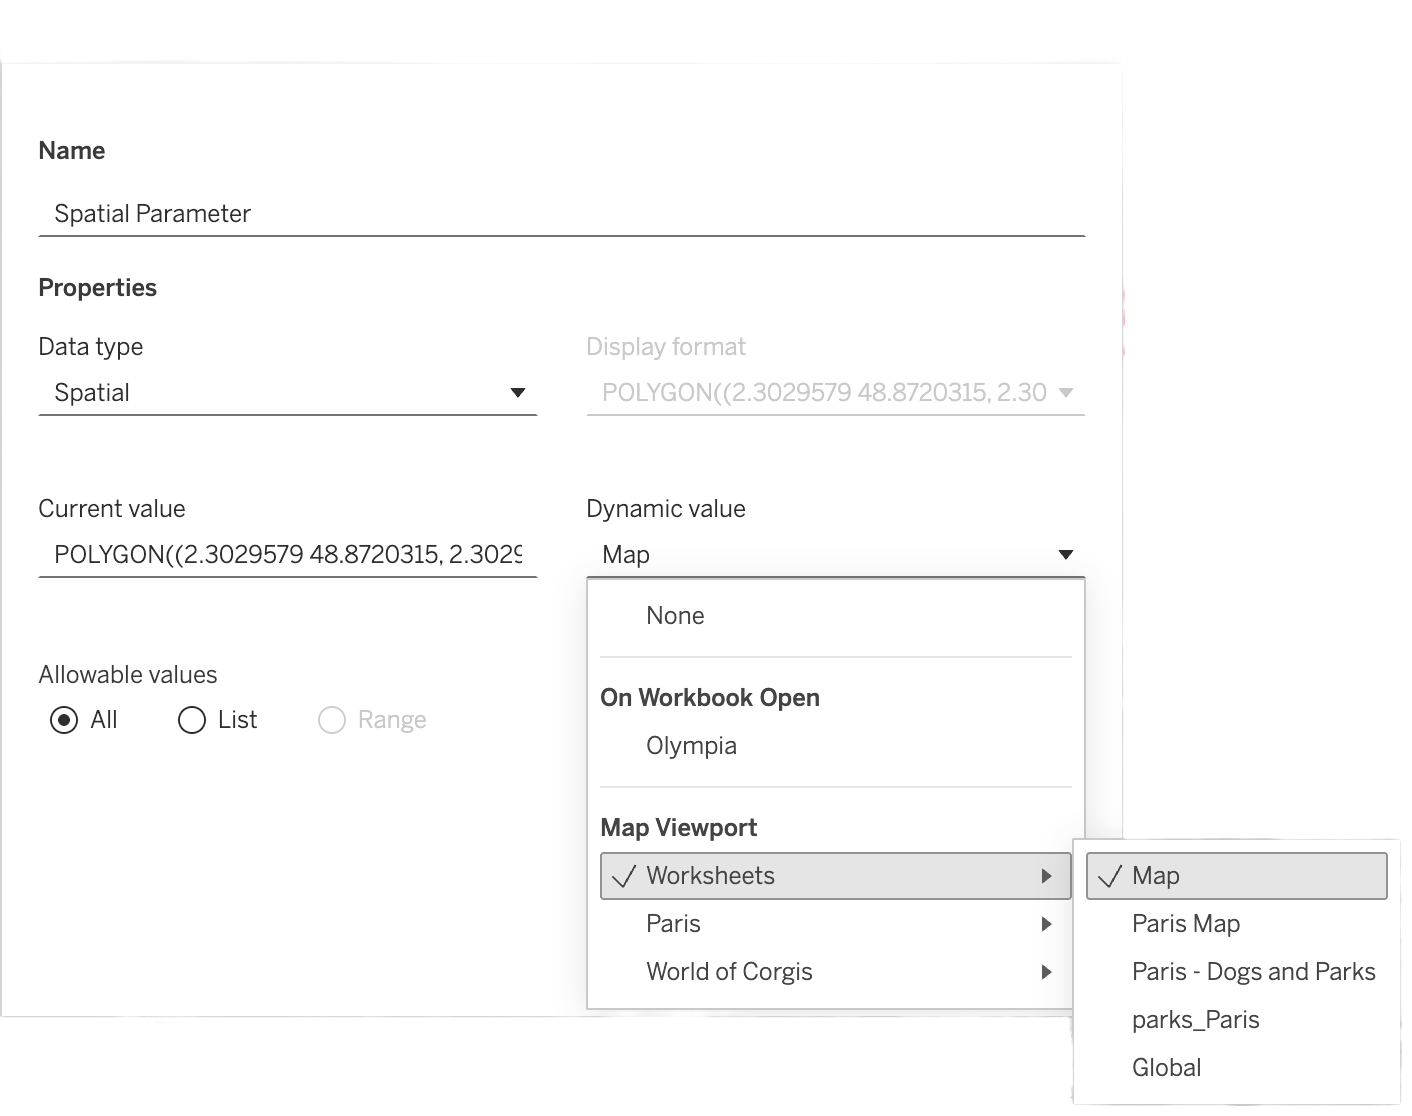
Dynamic Spatial Parameters
With dynamic spatial parameters, you can filter data by map viewport, use the zoom to scale marks, and keep multiple maps in sync—all without reloading.
This feature addresses or partially addresses the following request on the Salesforce IdeaExchange: Synchronizing multiple map views. It also addresses [1], [2], [3].
Tableau Pulse: Enhanced Q&A - Metric Filtering and Comparisons
Unlock what's driving your business performance through free form, conversational questions. Analyze and compare data through dimensions in a fully conversational experience.
This feature addresses or partially addresses the following request on the Salesforce IdeaExchange: Allow filtering on Pulse Metrics.
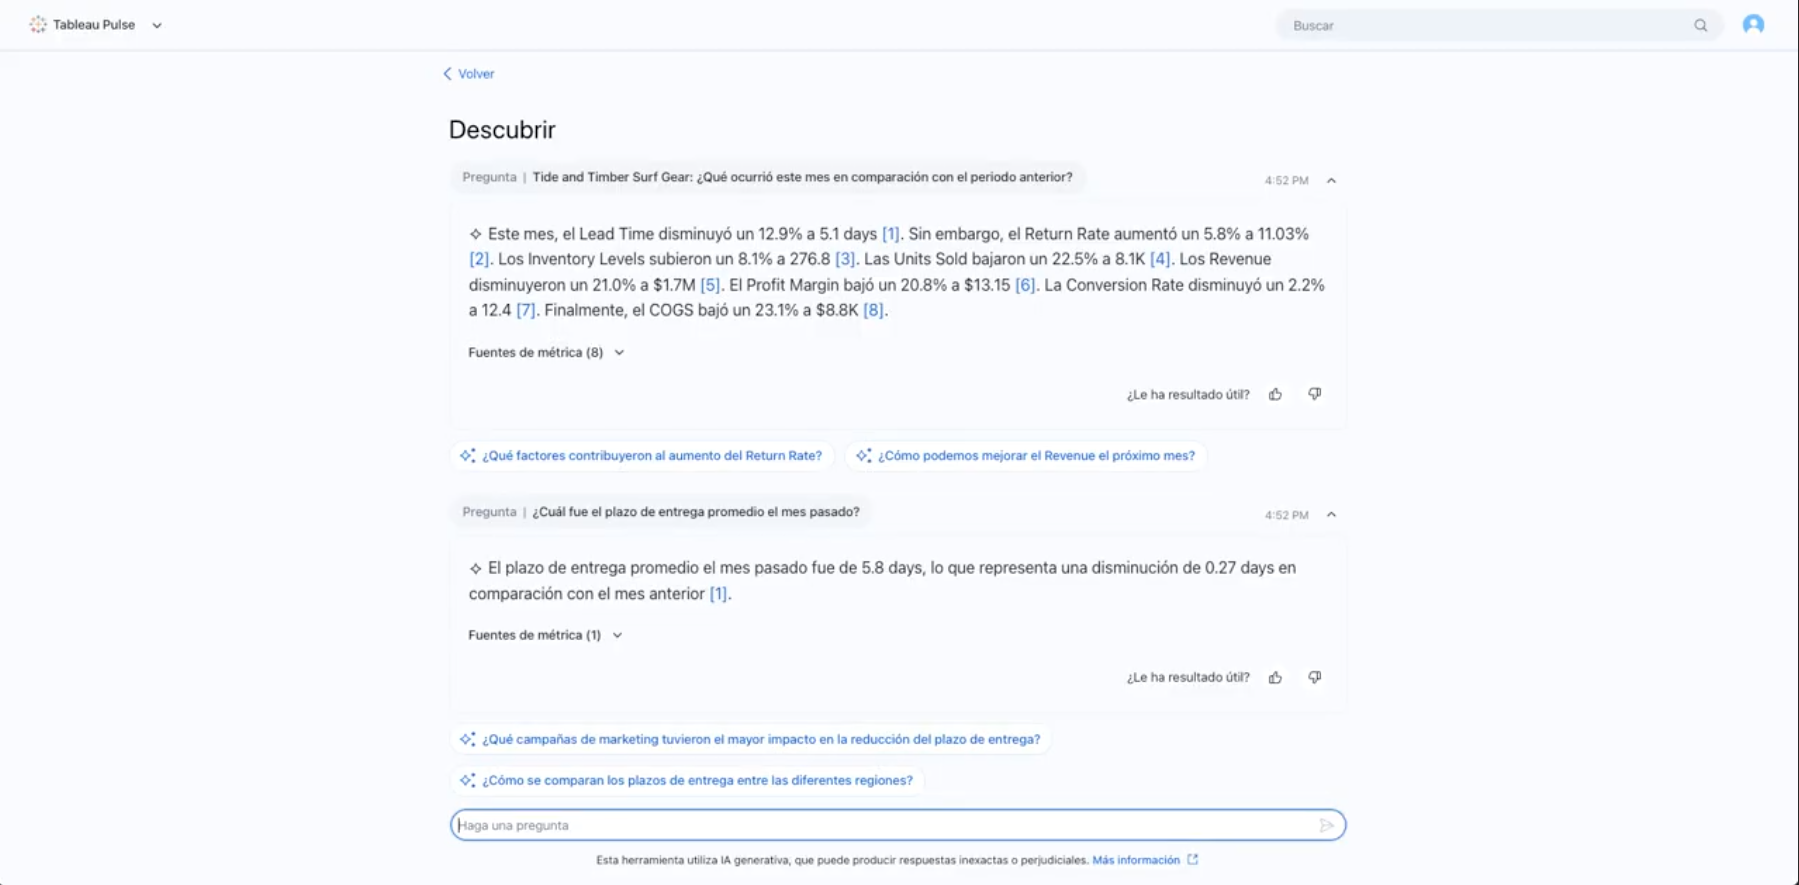
Tableau Pulse: Enhanced Q&A - Multilingual Support
Enhance scalability and reduce misinterpretation of your business by asking questions in your preferred language. Explore insights in your local language regardless of what is used in the company data or site settings.
This feature addresses or partially addresses the following request on the Salesforce IdeaExchange: Tableau Pulse support for other languages.

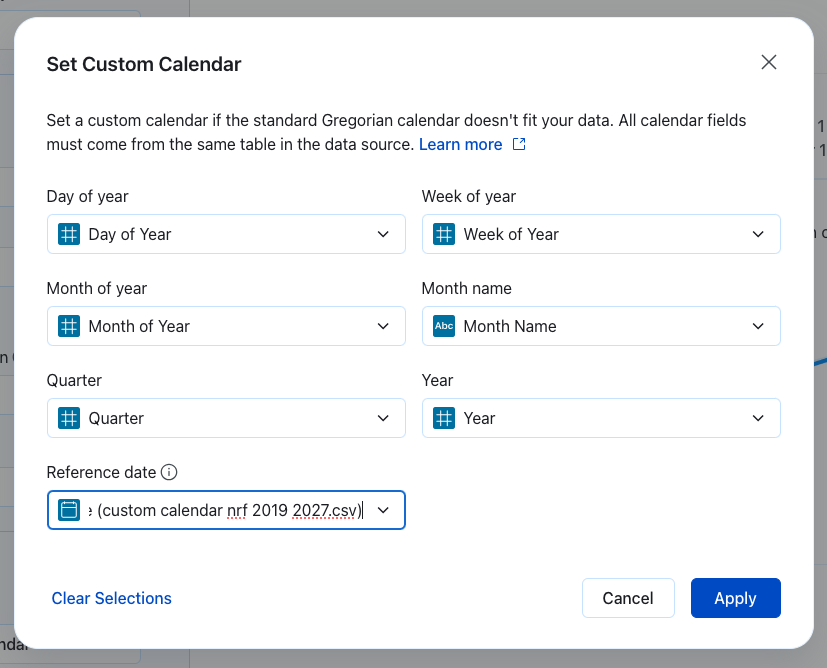
Tableau Pulse: Custom Calendar
Ensure analyzing relevant information by customizing calendar dates. Match specific business reporting needs with custom calendar definitions rather than the standard gregorian calendar.
Tableau 2025.1
Tableau 2025.1 offers new ways to enhance your analytics with AI-powered solutions and provides early access to experience future releases. Highlights include Tableau Agent Multilingual Support, Private Connect for Tableau Cloud, Tableau Cloud Release Preview Sites and more.
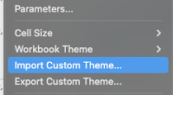
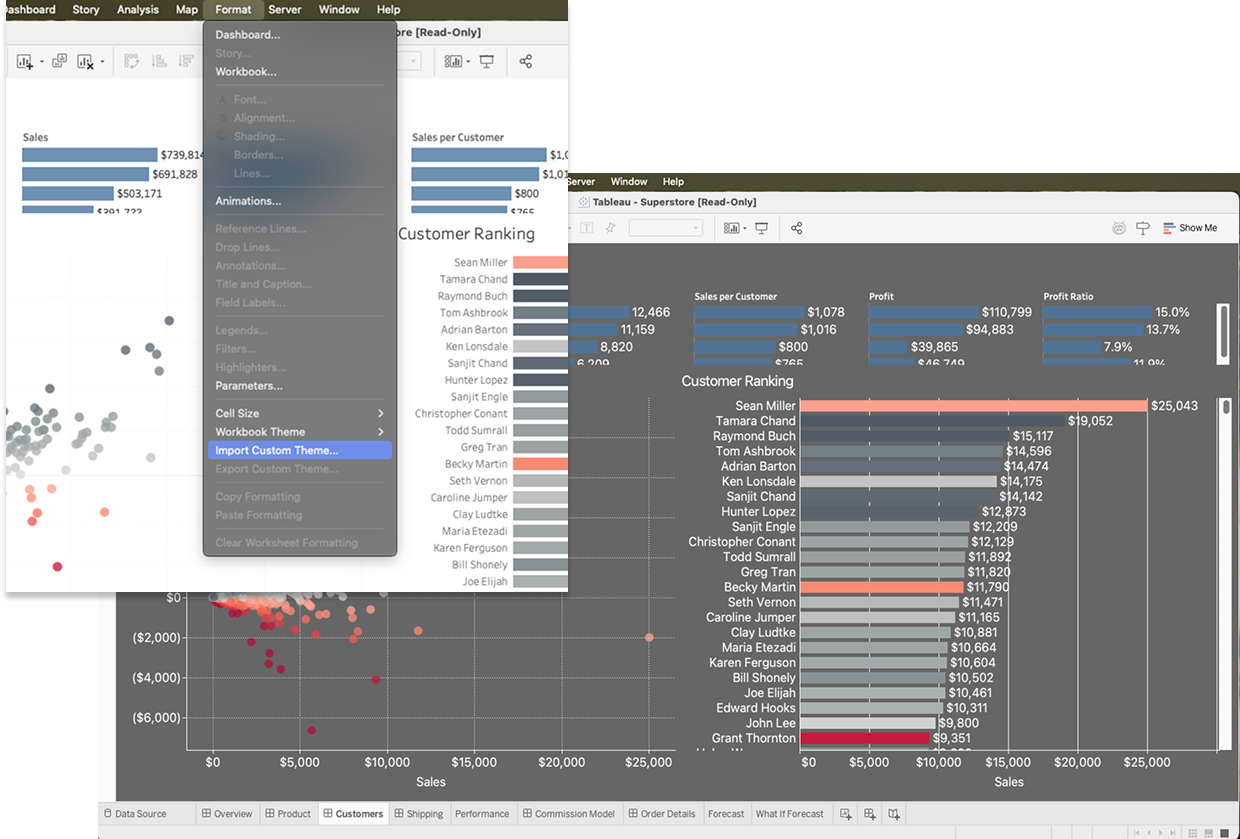
Custom Themes
Ensure consistent and repeatable formatting across all your workbooks. Create a theme once and reuse it when building new workbooks or apply it to existing workbooks to quickly update them; the newly created custom theme will carry over once published to Tableau Cloud and Tableau Server. You can use any existing workbook as the template and 'export' the styling as a theme. Then, apply that custom theme to any other workbook. This new functionality is available under the Format menu in Tableau Desktop.
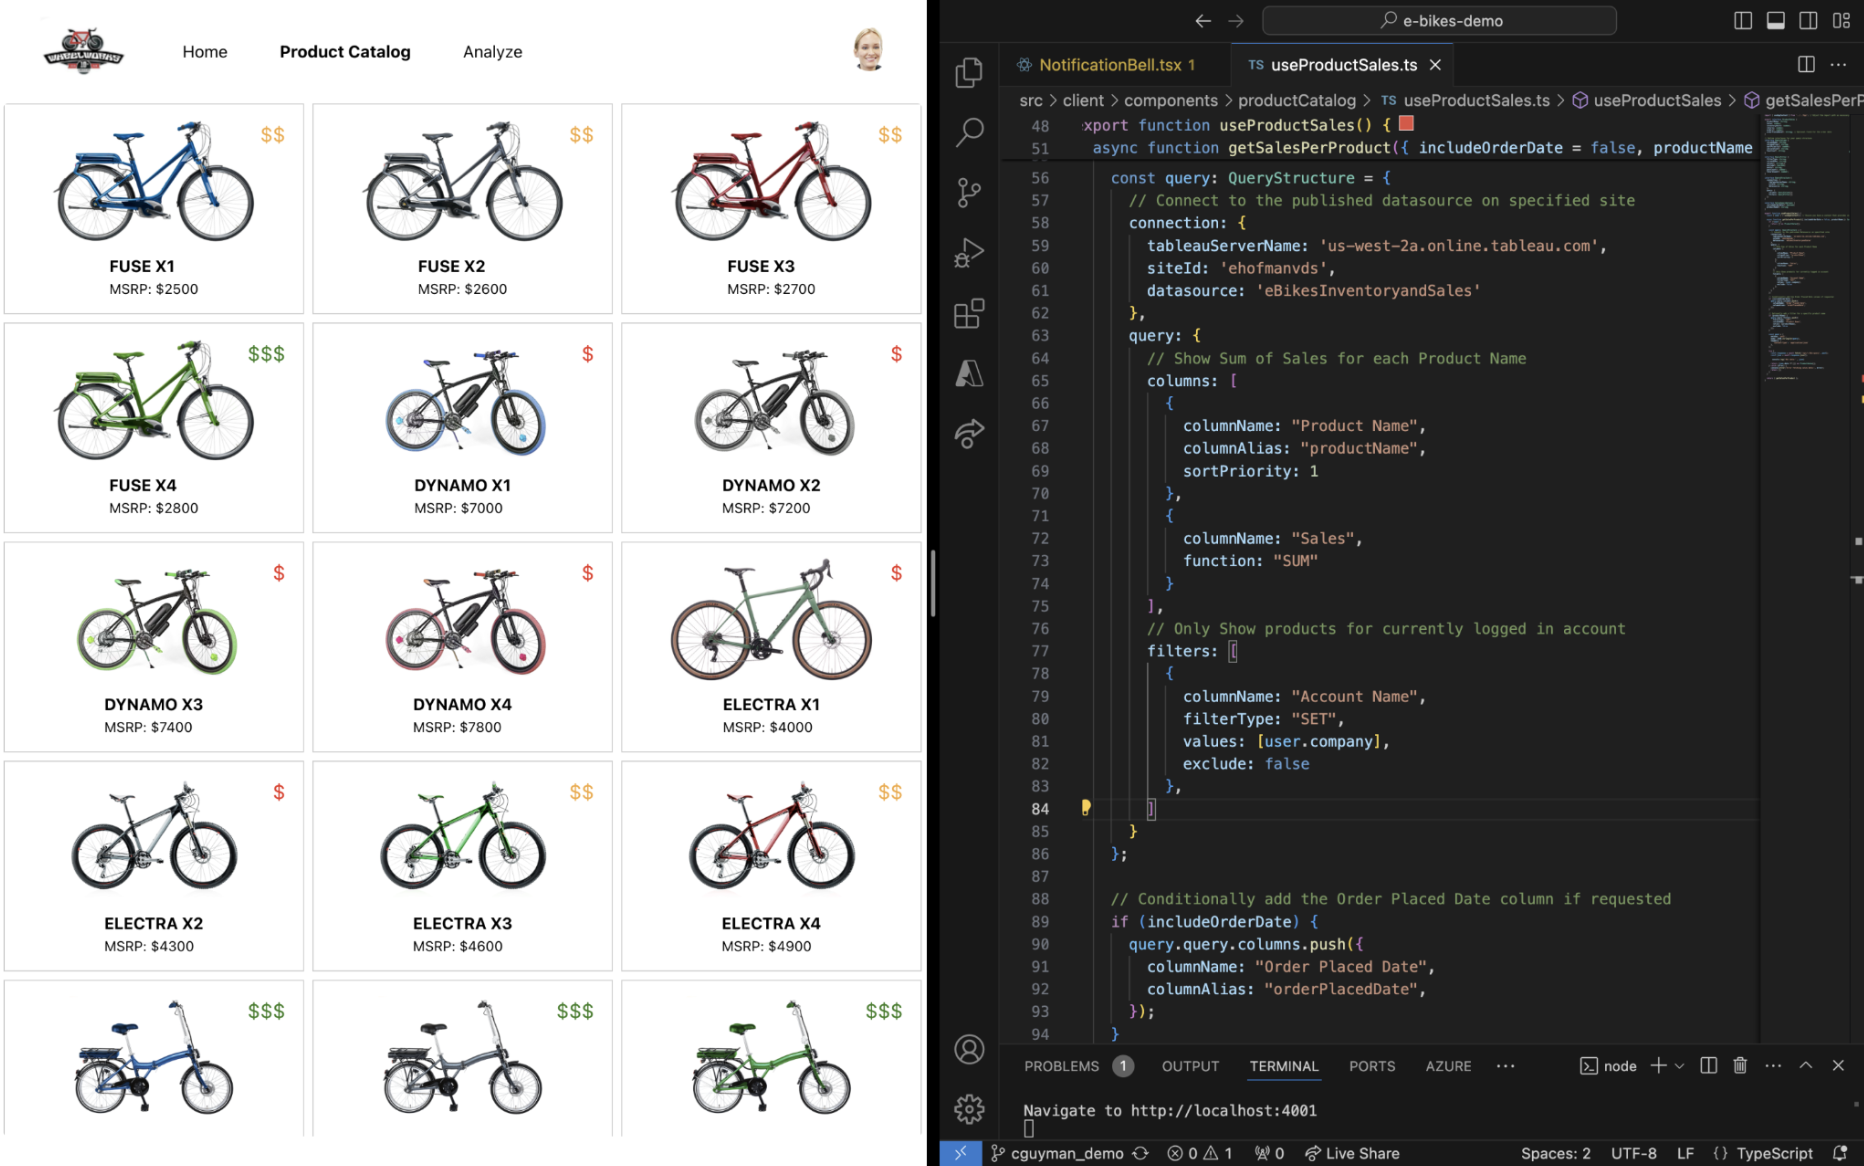
VizQL Data Service API
The VizQL Data Service API enables Tableau users to access their data without the need for visualizations. It empowers users to use Tableau's analytical engine as a service, unlocking new analytical possibilities and insights using the same data that powers Tableau visualizations.
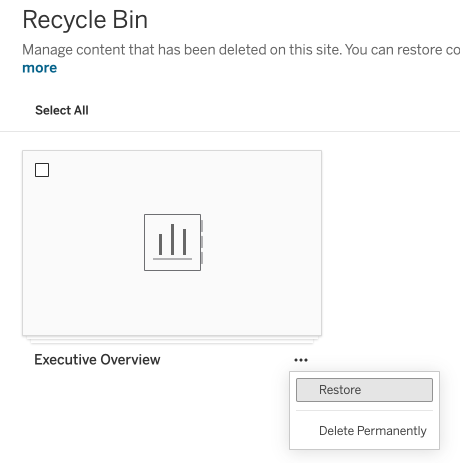
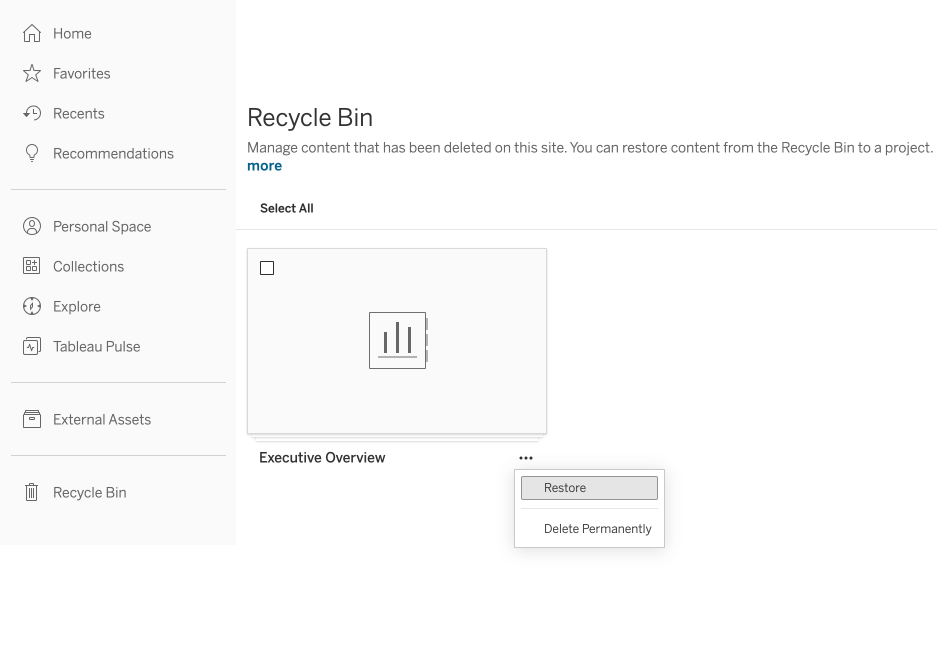
Recycle Bin
Have you ever accidentally deleted something and wanted to get it back? We all have. Tableau Server and Cloud customers can access deleted workbooks, data sources, or projects through the Recycle Bin area for 30 days - it is enabled by default. All users will see their deleted content, and site admins can see all deleted content from all users on the site. You can restore the content in the bin to a specified location in Tableau Cloud and Server.
Feature from Community Ideas
Note: This feature will be deployed to Tableau Cloud in a weekly release update soon after the initial 2025.1 rollout.
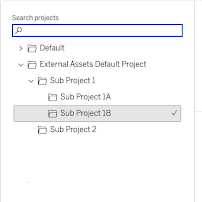
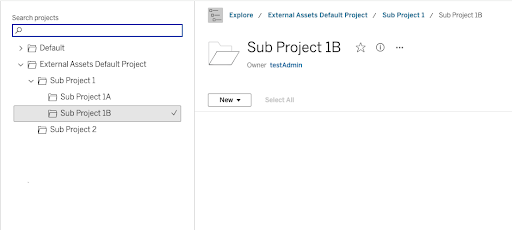
Project Tree in VizPortal
Get a better and faster experience navigating to your Tableau projects. Project Tree view is an optional navigation style that has been added to the Vizportal interface. This view is enabled by default, so users who have many projects nested several levels deep can easily browse through their projects in Tableau Cloud, Server, Desktop, and Public.
Feature from Community Ideas
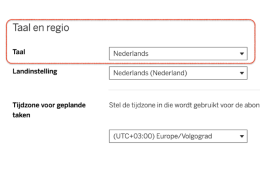
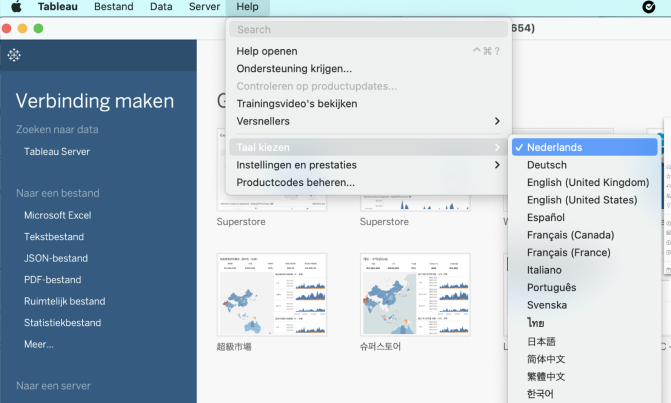
Dutch Language Support
Users in Dutch-speaking regions can navigate Tableau in their native language. Simply go to the Help menu and choose Language setting for Desktop - My Account Settings, Language and Region setting for Tableau Cloud and Server- to navigate Tableau products and Help pages in Dutch!
Data Model Accessibility
Data Model Accessibility makes it easy for all users to navigate Tableau’s relationship data model using keyboard controls and screen readers. Analysts can move between tables and relationships to better understand how data is connected, ensuring everyone can explore and analyze data effectively.
Tableau 2024.3
Tableau 2024.3 offers new ways to visualize your data and makes it easier for organizations to administer analytics at scale. Highlights include Tableau Cloud Manager, Table Viz Extension, Spatial Parameters, Tableau Cloud App for Microsoft Teams, and more.
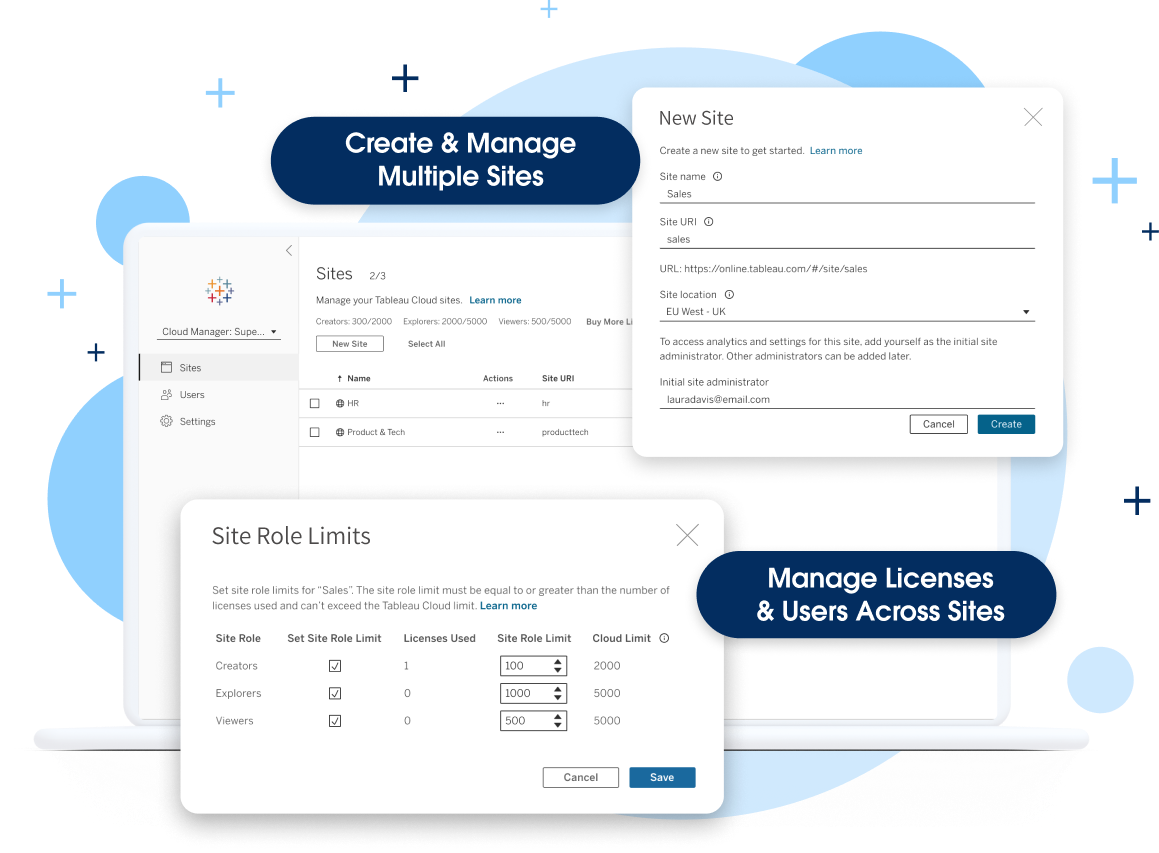
Tableau Cloud Manager
Tableau Cloud Manager allows admins to create and manage multiple Tableau sites in the regions of their choice. Admins can manage licenses and users across sites without having to license a single user multiple times. This simplifies the expansion and management of their cloud analytics environment while helping ensure they meet data residency requirements and maintain governance.
Note: This feature will be deployed in waves. Admins will receive an email two weeks before this feature is deployed to their site.
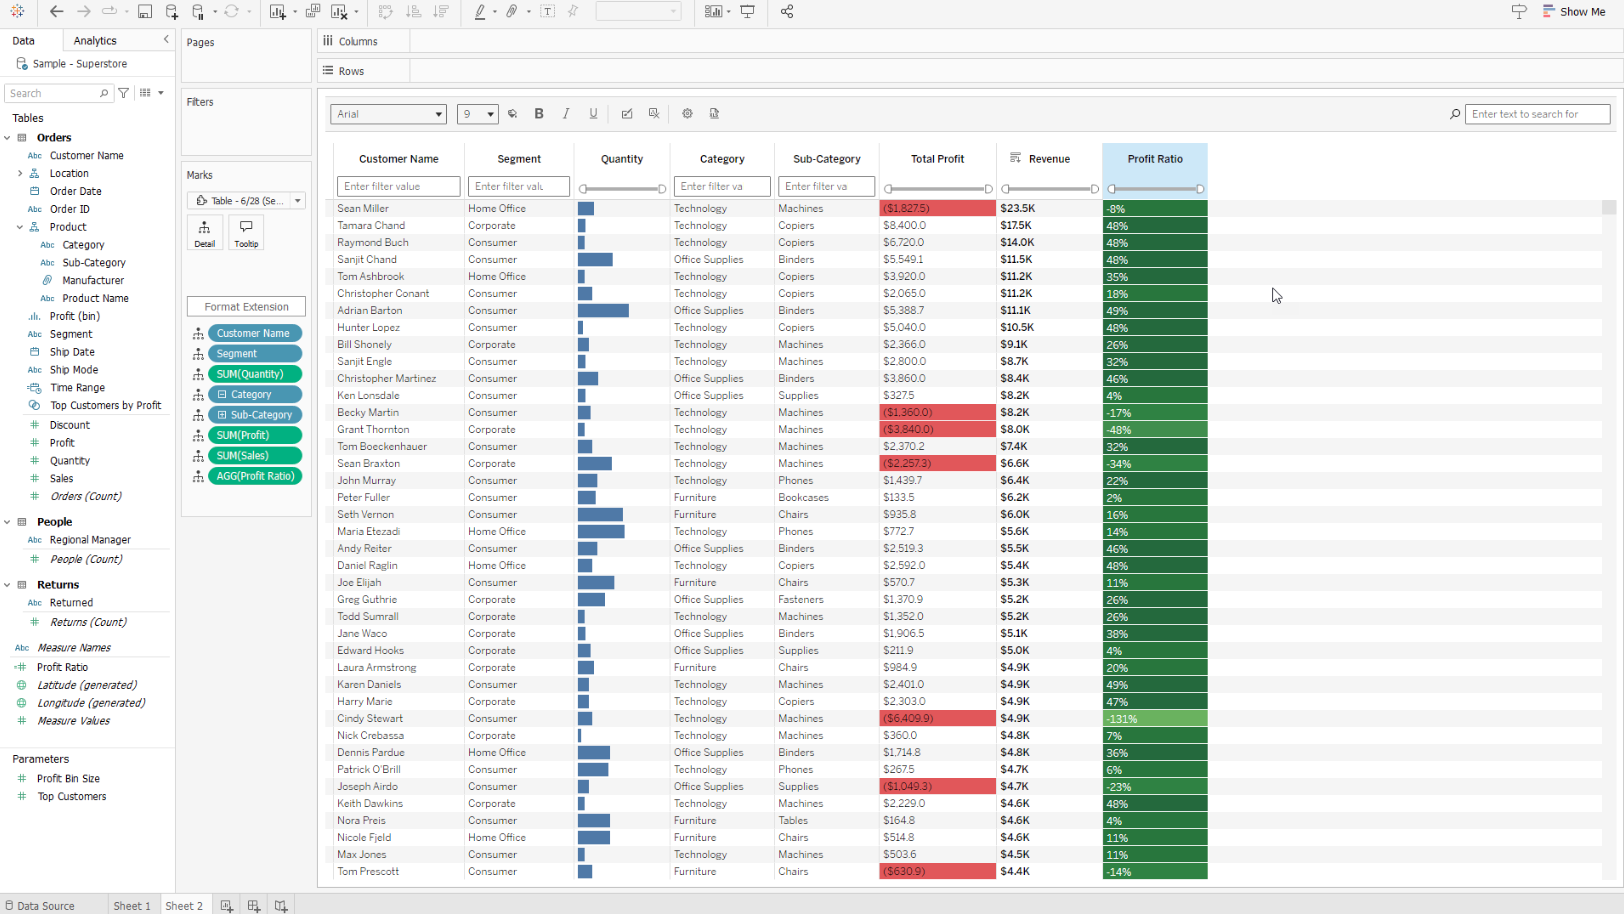
Table Viz Extension
Evolve from legacy reporting to visual analytics while meeting your users' current needs. Now, you can add detail tables and grid views to dashboards for users who prefer traditional reporting views.
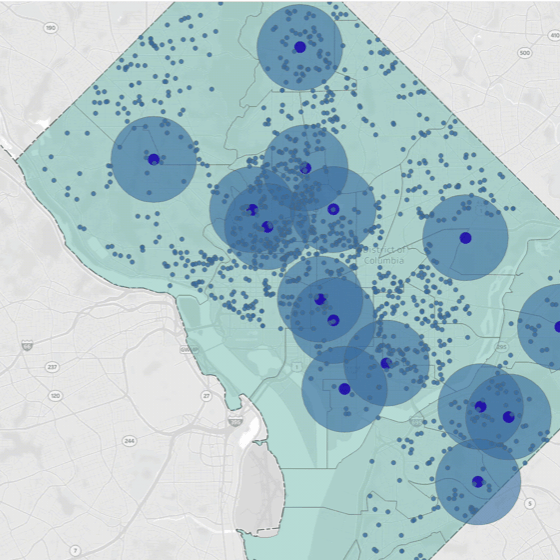
Spatial Parameters
Bring the full Tableau experience to geospatial data with geospatial support for Parameters. Spatial Parameters create rich, interactive dashboards so users can ask and answer questions about geospatial data.
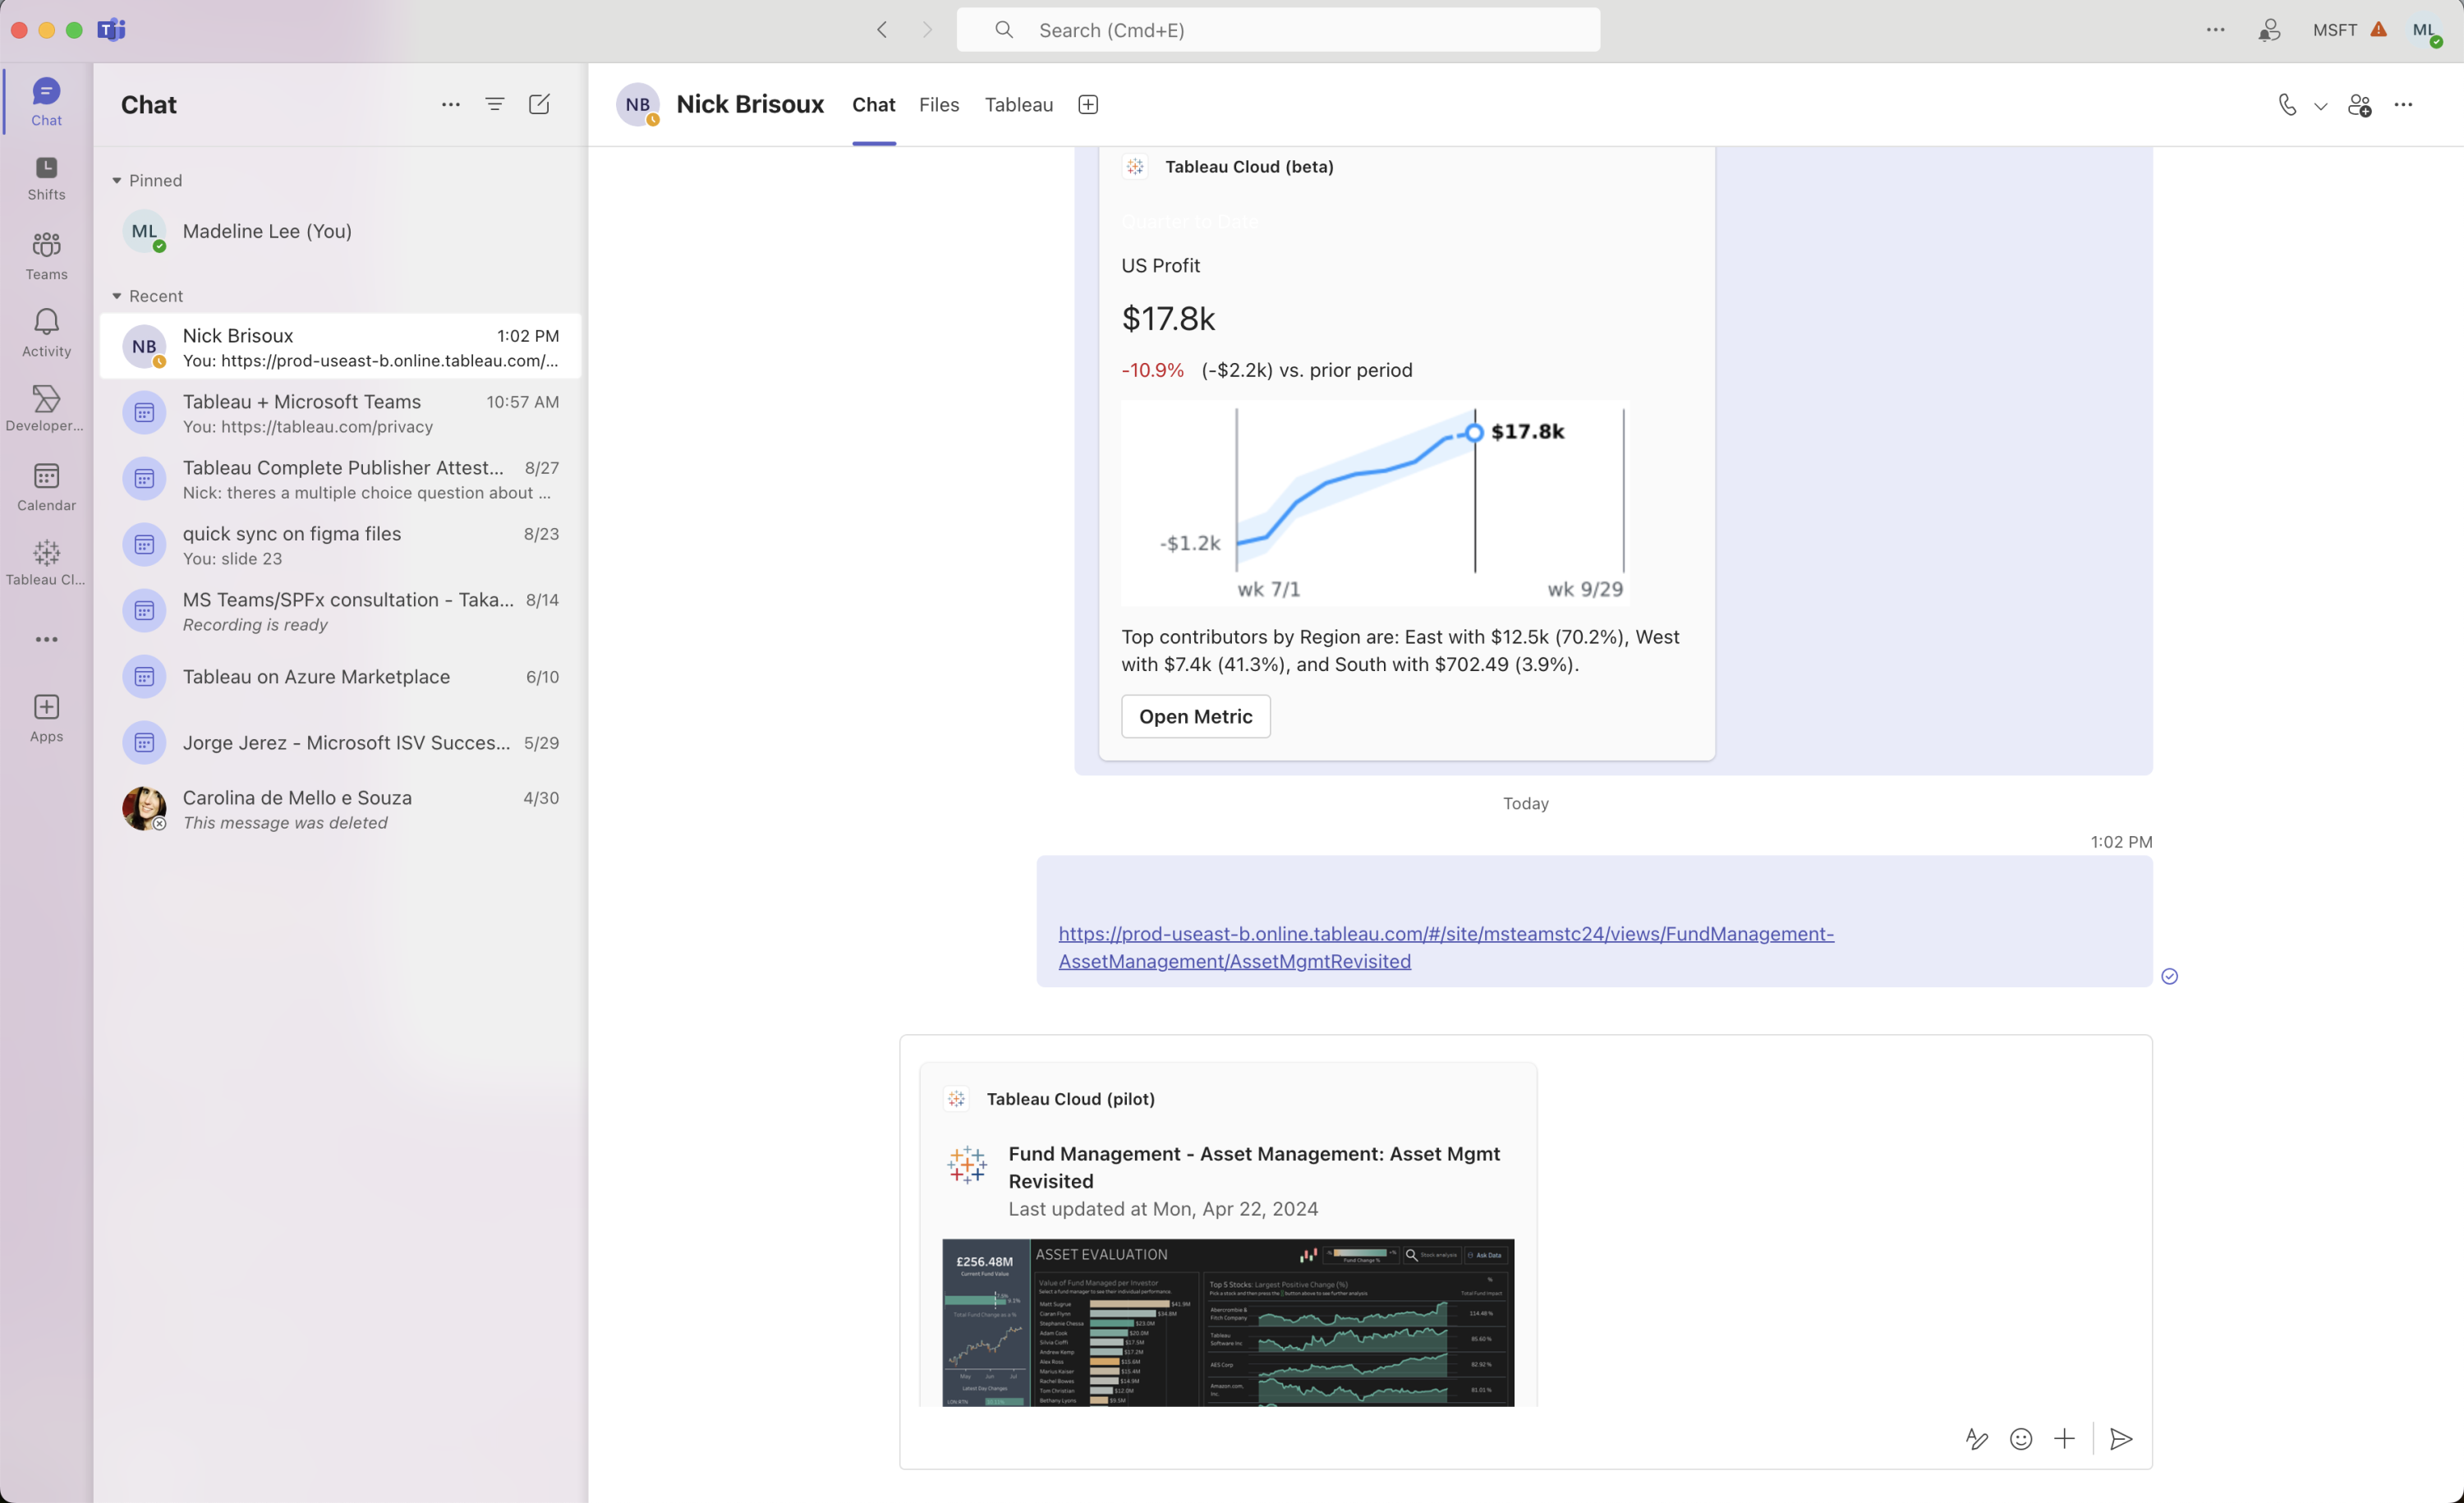
Tableau Cloud App for Microsoft Teams
With the new Tableau Cloud App for Microsoft Teams, users can effortlessly incorporate data-driven insights into their daily work flows, leading to faster, more efficient decision-making. The integration enables real-time data sharing, allowing users to easily share Tableau visualizations, dashboards, and insights directly within Teams chats and meetings.
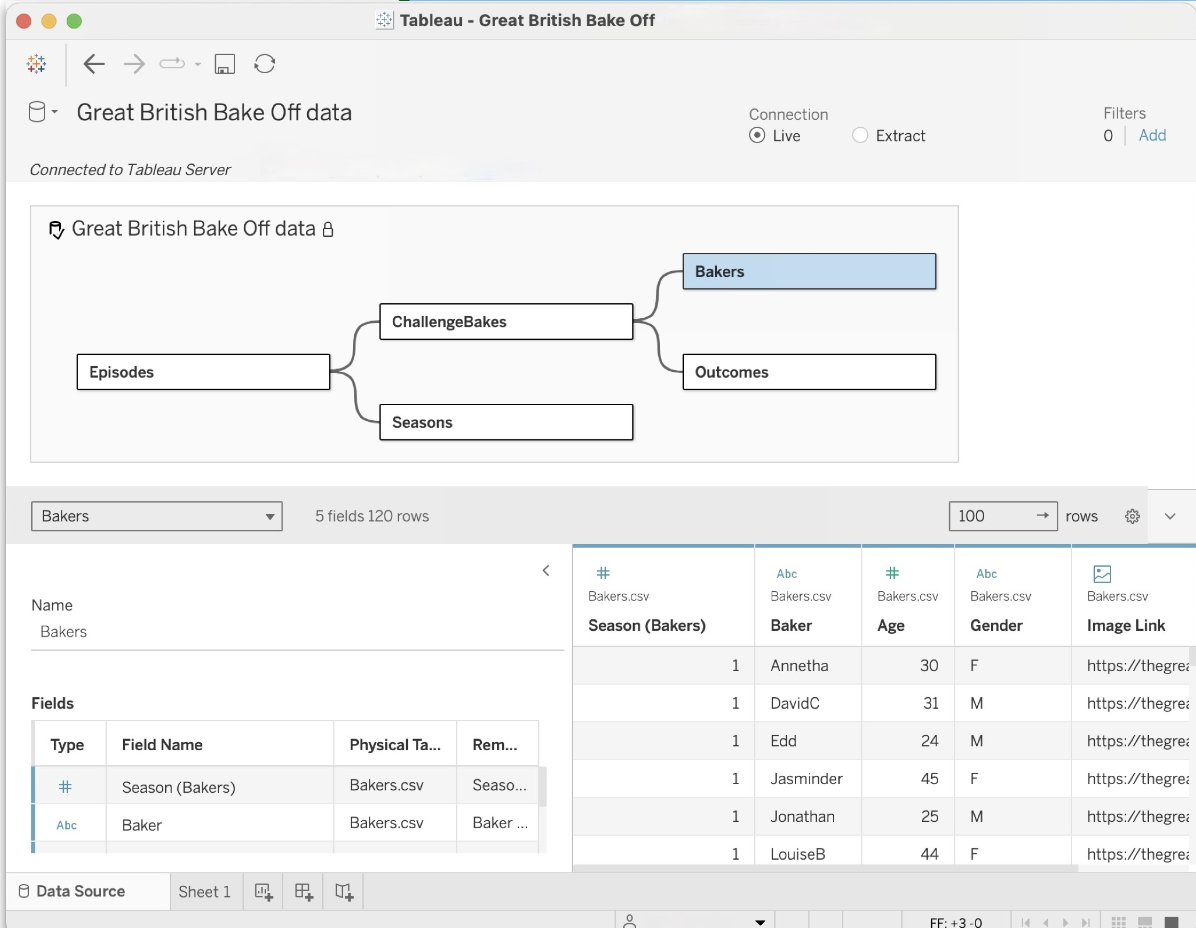
Display Data Model for Published Data Sources
View and understand how tables in your data model are related in Published Data Sources. Create accurate visualizations and understand the relationships between different tables and fields in Tableau by simply clicking the Data Source pane in a Tableau workbook.
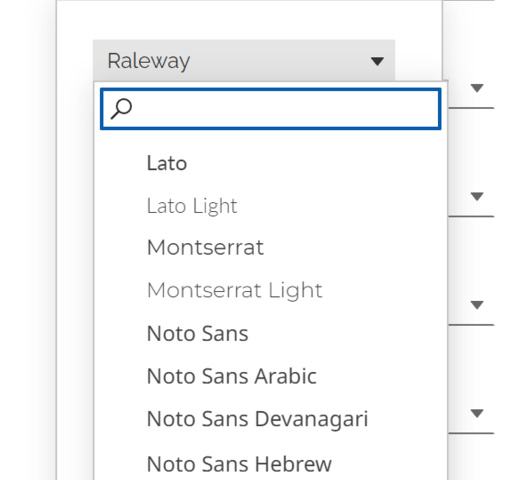
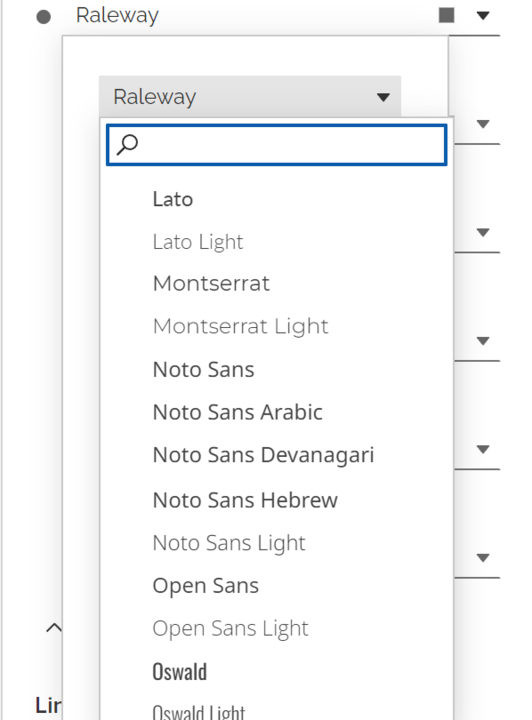
Google Font Support
Get more font options in Tableau Cloud with support for a set of Google Fonts. Tableau Cloud now supports Lato, Montserrat, Noto Sans, Noto Sans Hebrew, Noto Sans Arabic, Noto Sans Devanagari, Open Sans, Oswald, Poppins, and Raleway.
Tableau 2024.2
Tableau 2024.2 has new capabilities that help you create with data in new ways and explore data with an AI assistant in Tableau. Highlights include Tableau Agent, Tableau Pulse enhancements, Multi-Fact Relationships, Viz Extensions, and more.
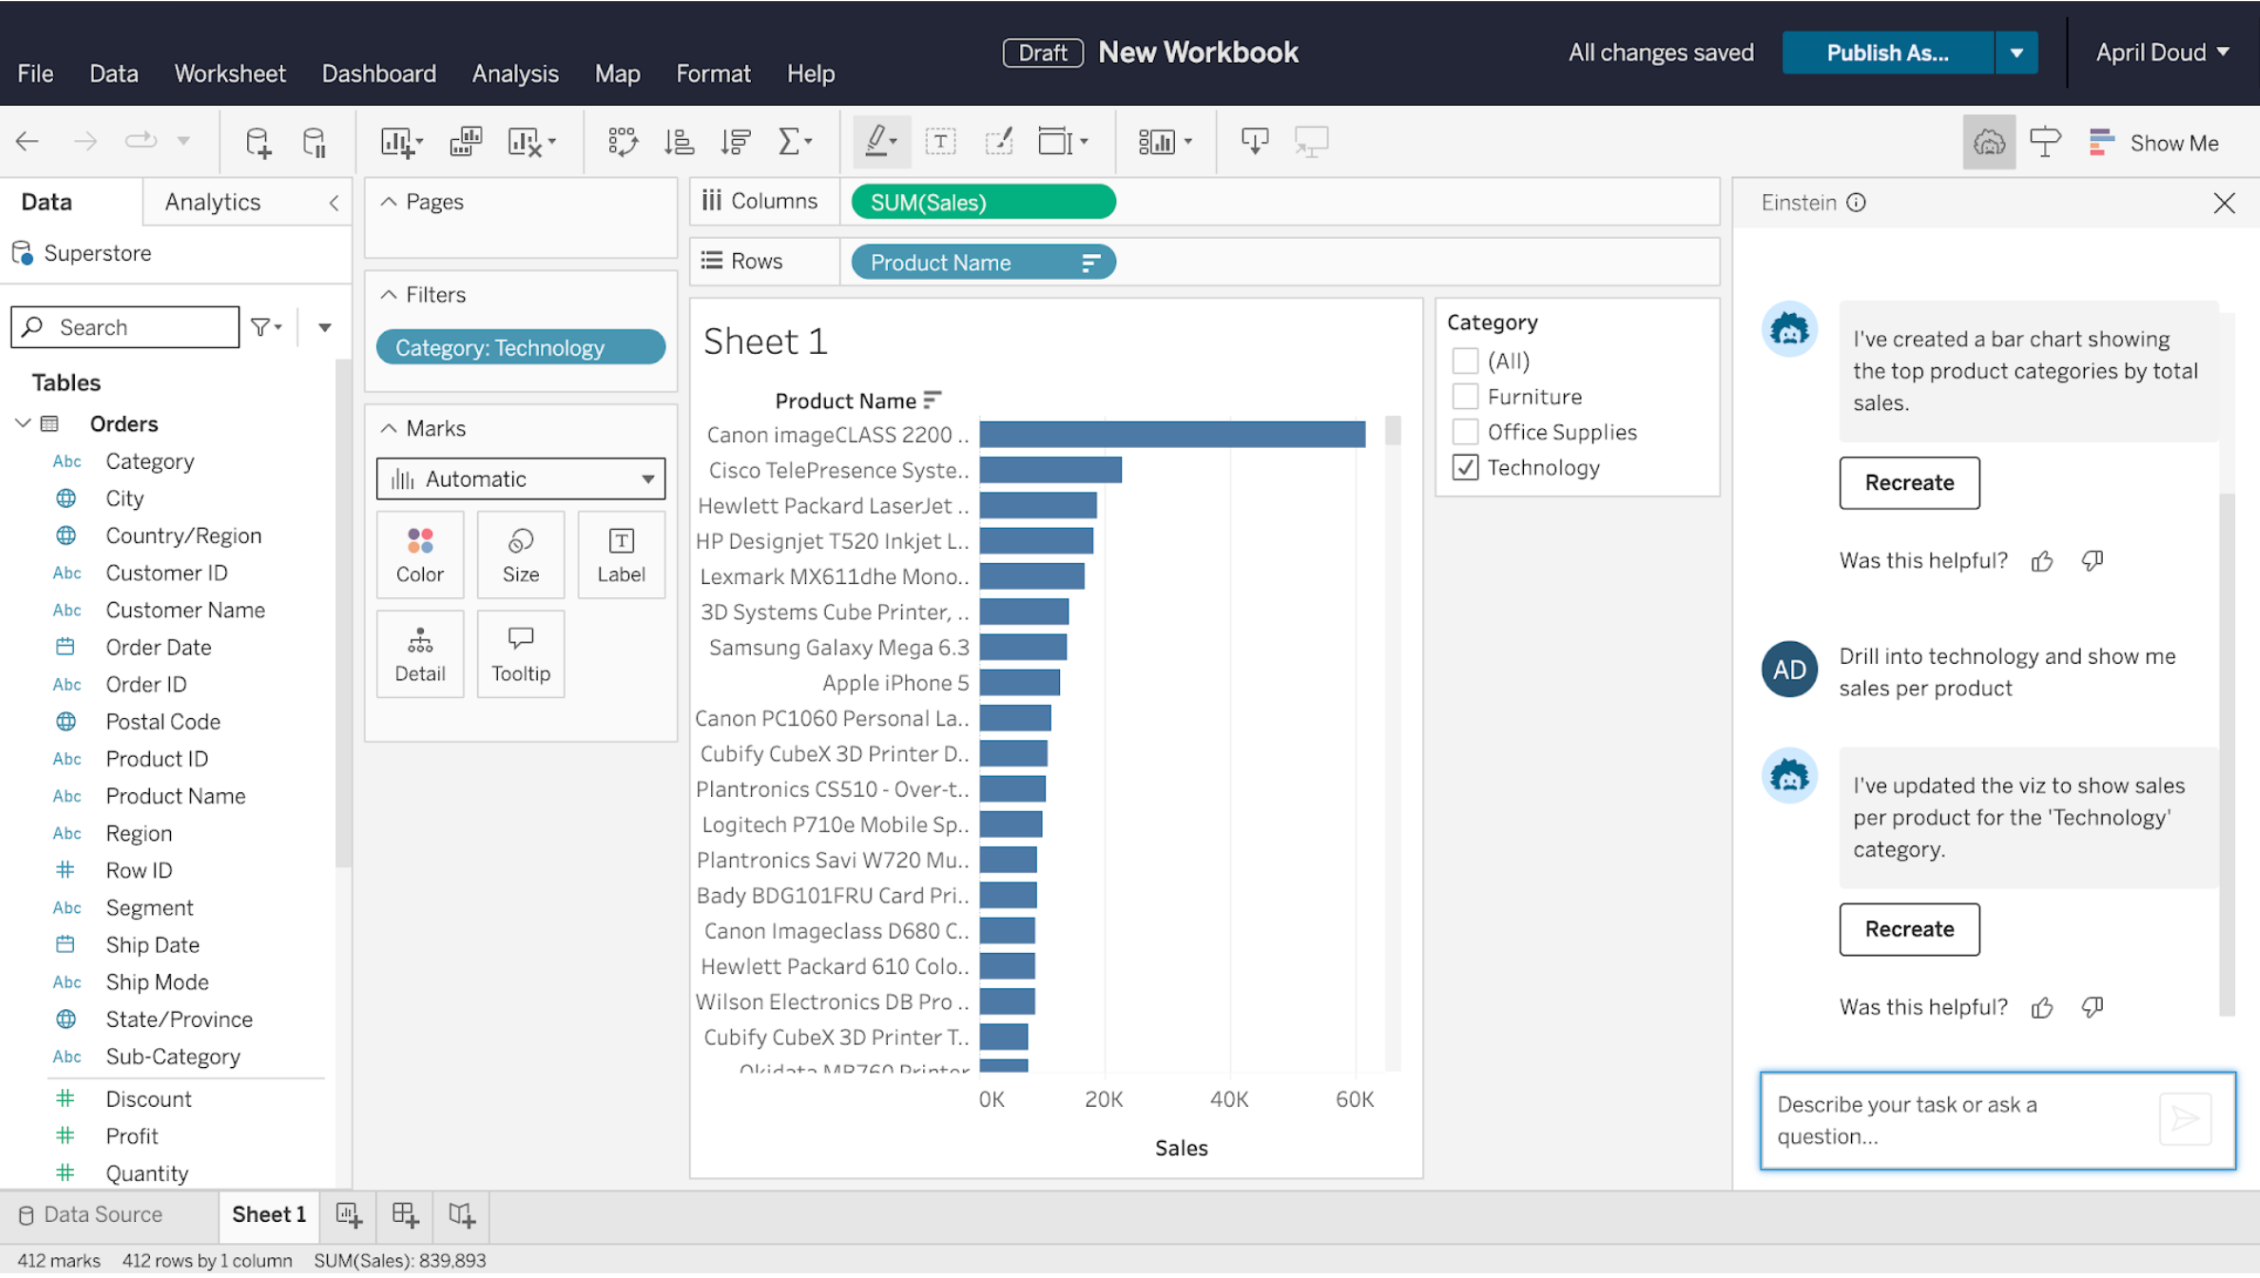
Tableau Agent: Web Authoring
Tableau Agent helps everyone, from novice analysts to seasoned data pros, explore their data faster and more seamlessly than ever before. It's an AI assistant that augments your Tableau experience by allowing you to use natural language prompts to create and edit visualizations and formulate calculations. It even suggests questions to help you get started quickly. Arriving in August 2024.
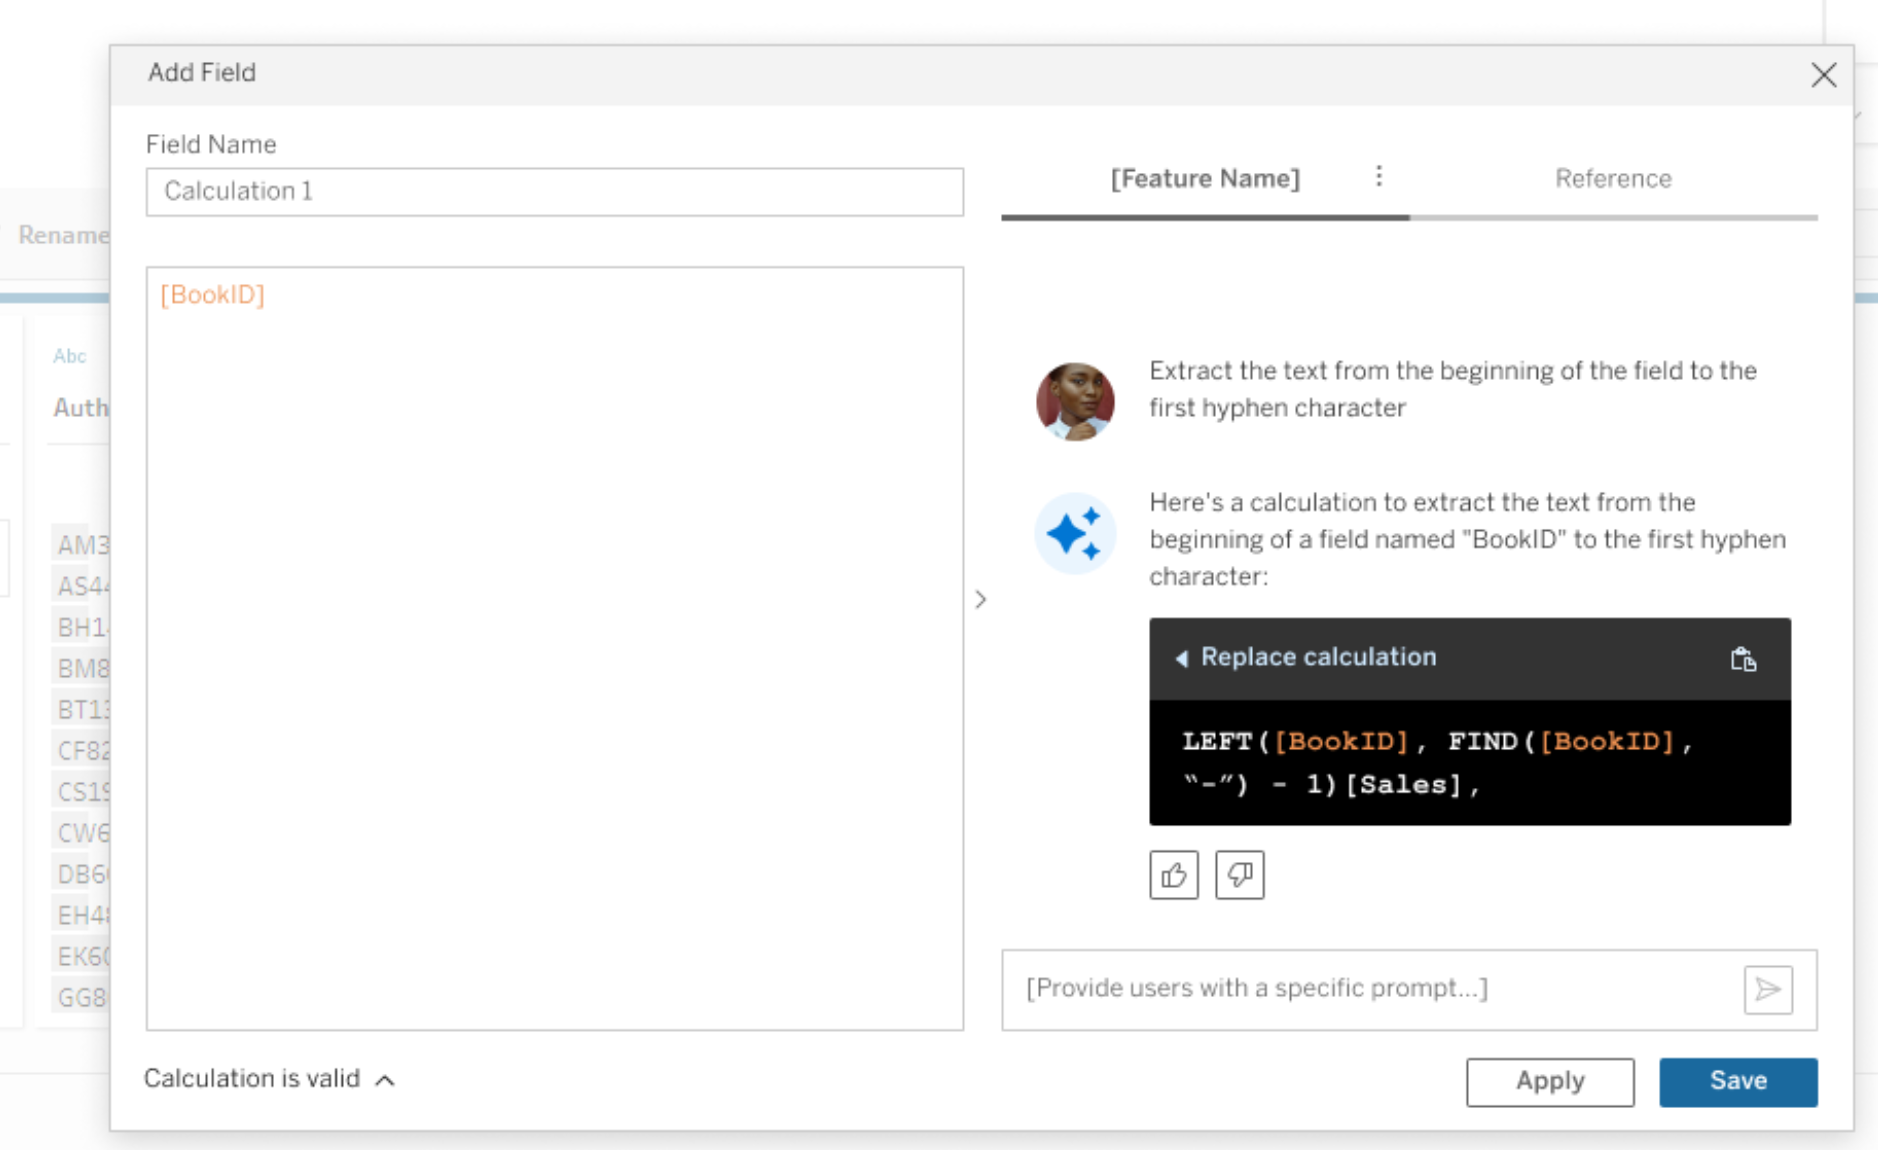
Tableau Agent: Prep
With Tableau Agent for Prep, data preparation is faster and easier for analysis. Tableau Agent simplifies the task by enabling both technical and non-technical users to create calculations easily using plain language. Users can simply describe a calculation, and Tableau Agent will assess the formula for them. This lets you add powerful calculated fields to your Prep flows with just one click.
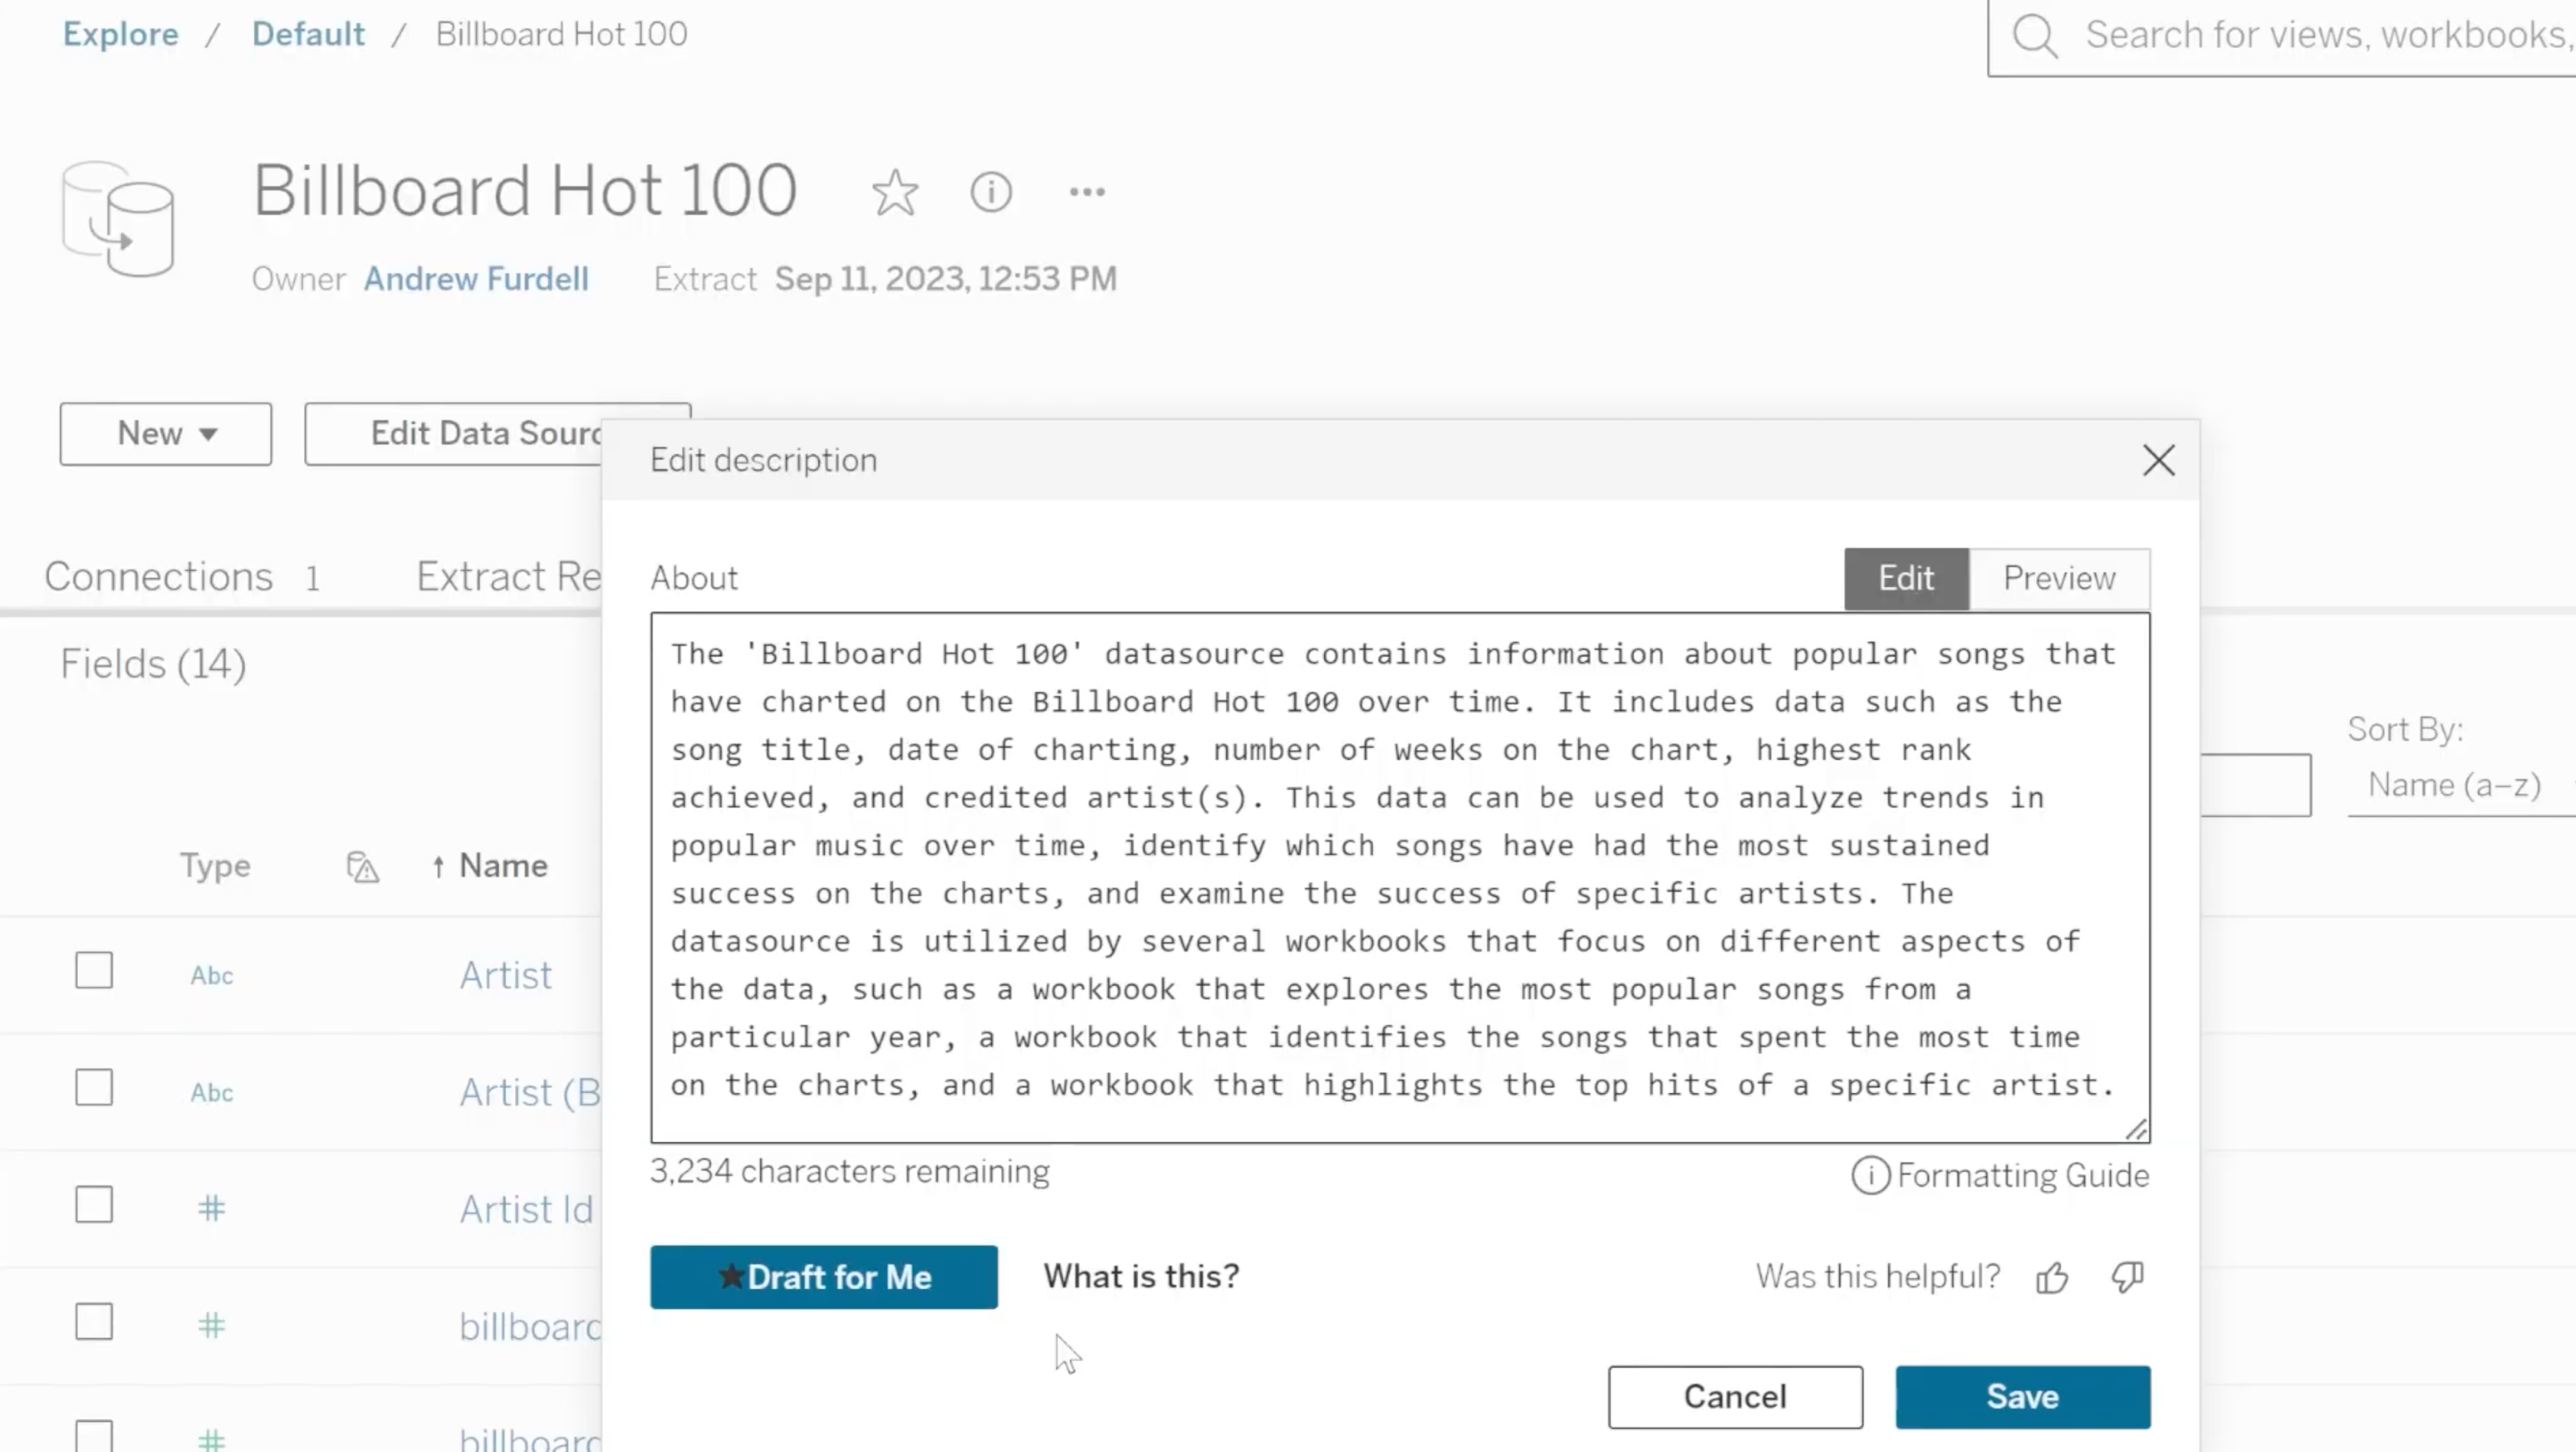
Tableau Agent: Catalog
Enhance data discovery and trust with Tableau Agent: Catalog. Users can automatically generate descriptions for data sources, workbooks, and tables - reducing the need for manual documentation.
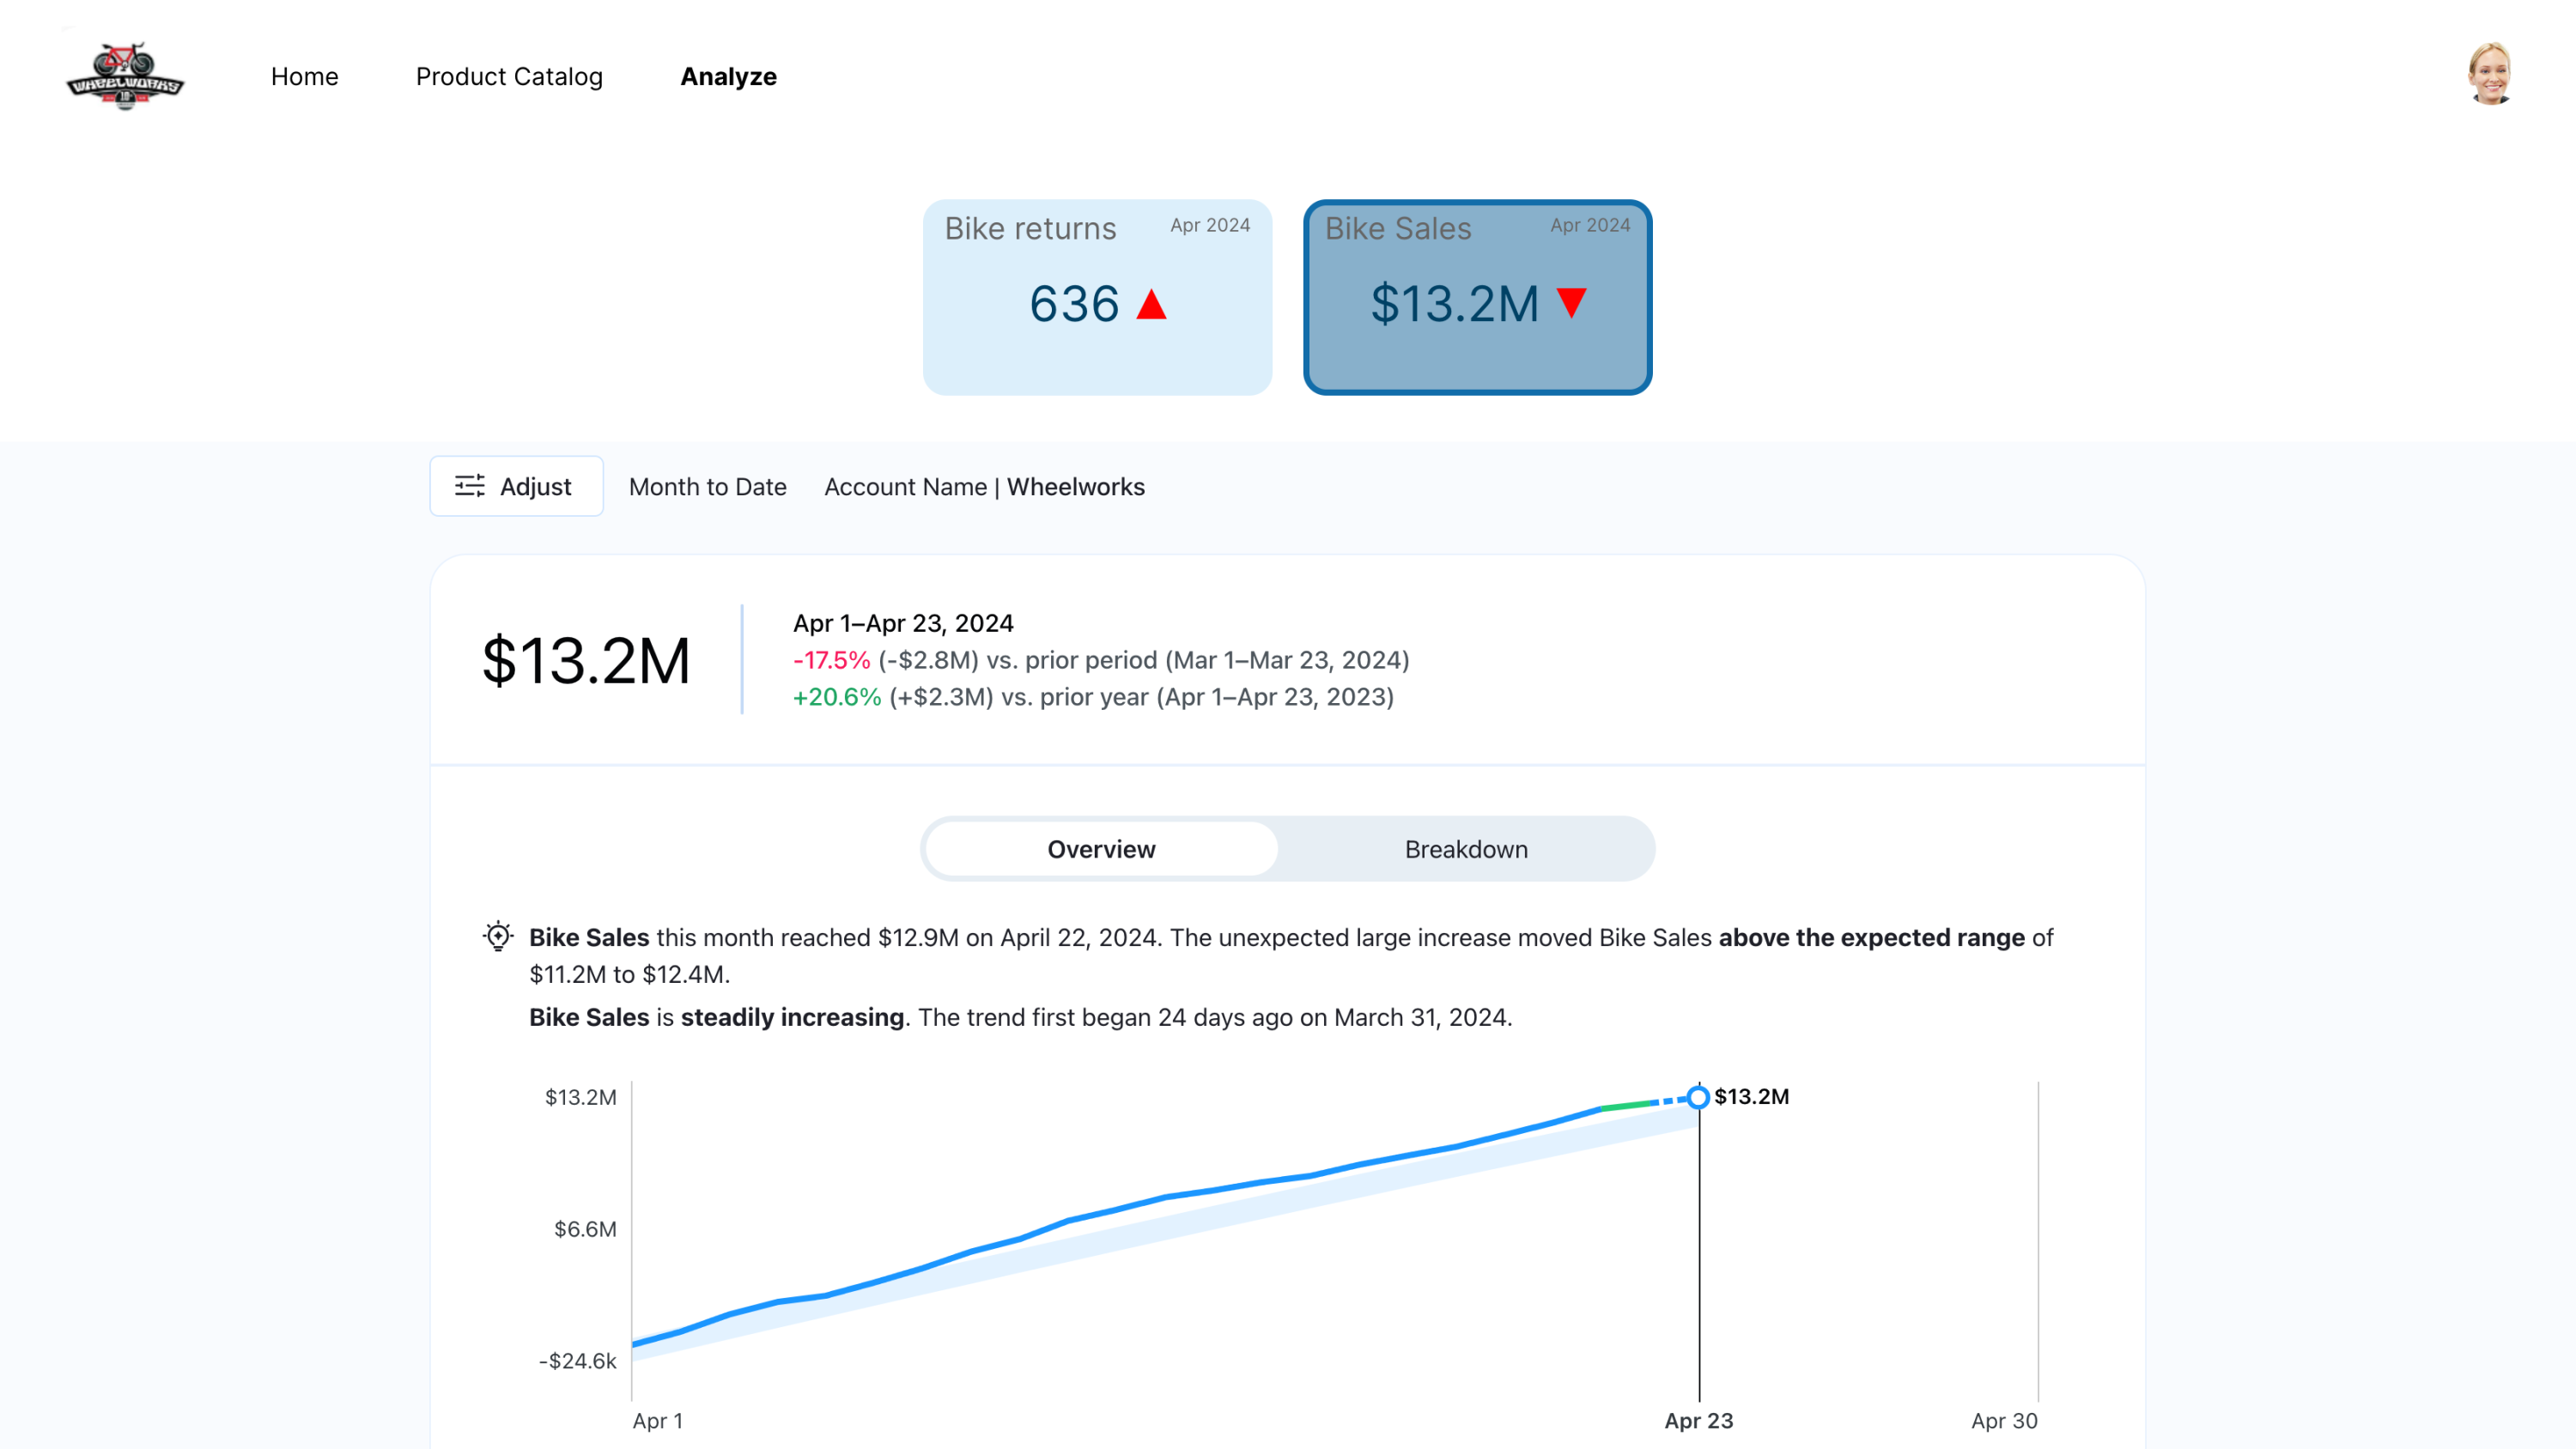
Tableau Pulse: Embedded Component
The Tableau Pulse web component offers you the ability to integrate the Insights Exploration page into your app. Users will have the option to enable a "presentation mode" to display a single metric on a full page or multiple metrics as grouped cards.
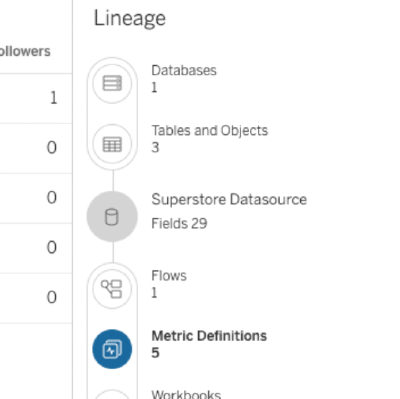
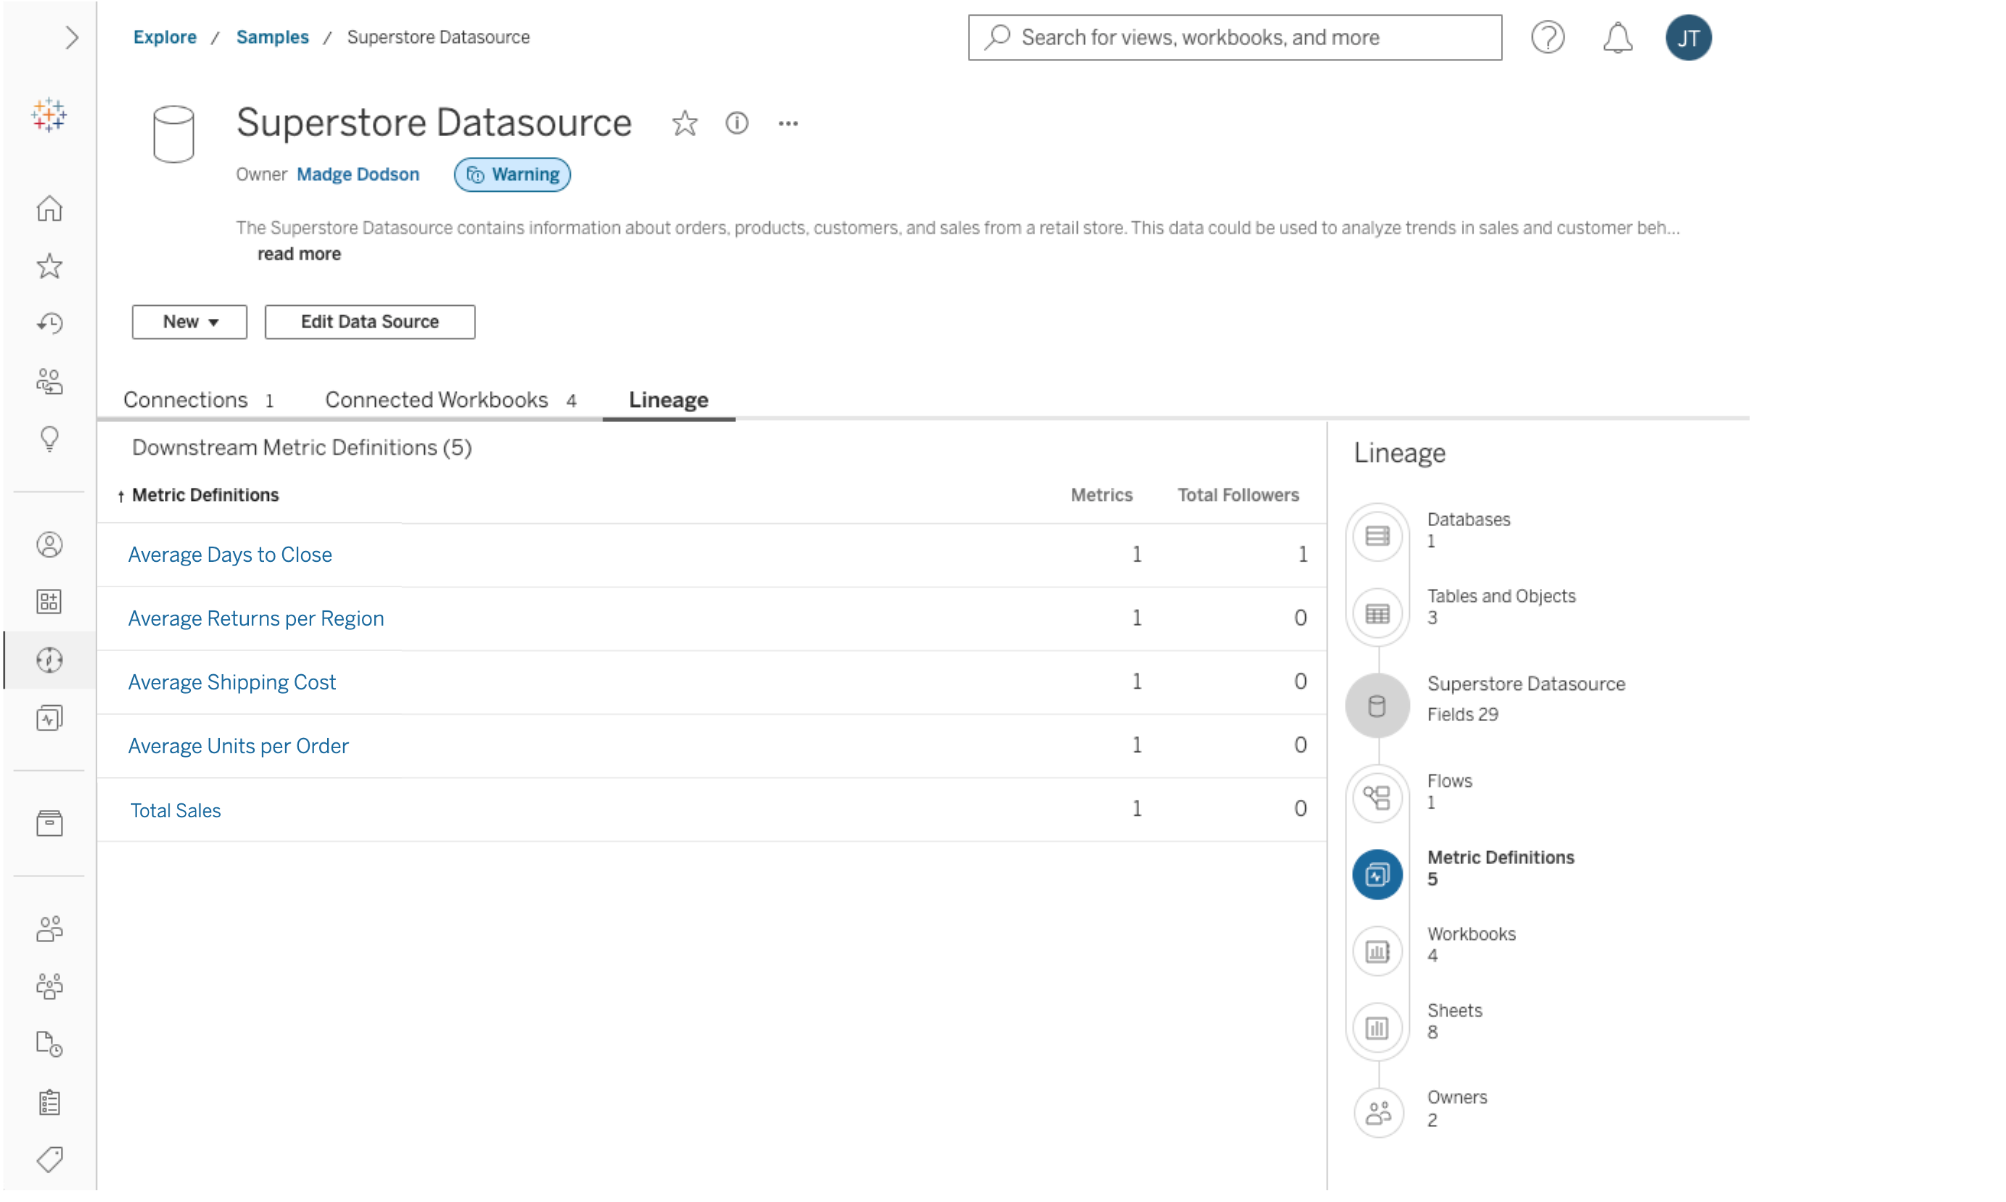
Tableau Pulse: Metrics in Catalog
Gain a visual understanding of the connection between upstream databases and metric definitions. Recognize the pulse metrics that will be influenced by modifications to published data sources, as well as upstream files, tables, and columns. Administrators and stewards will have a comprehensive view of the effects on underlying databases when changes occur.
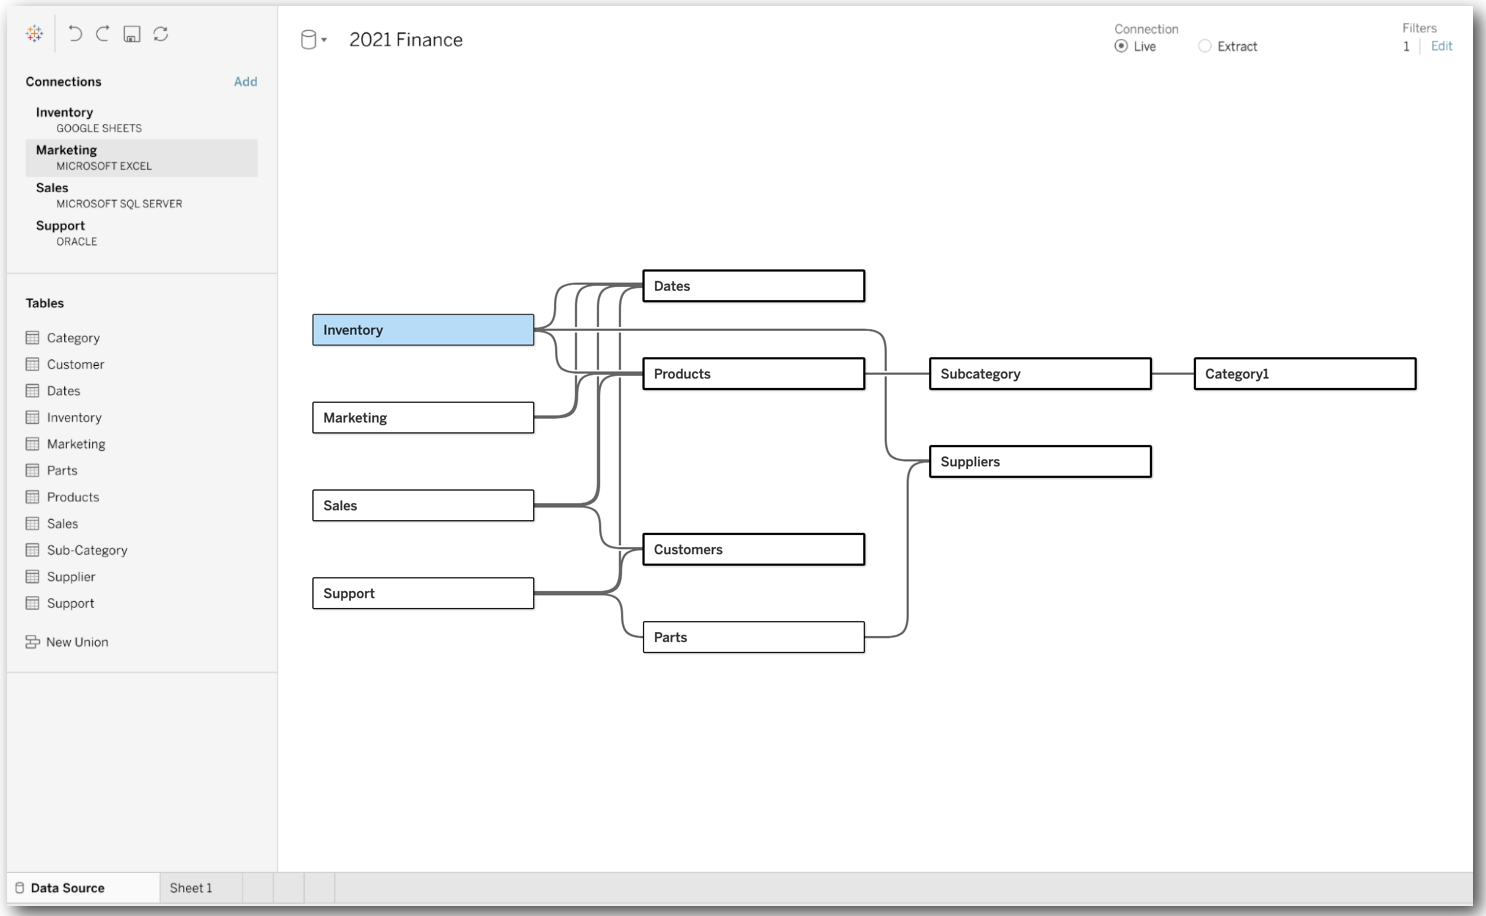
Multi-Fact Relationships
Analysts can bring in disparate datasets and relate them with common tables that have shared dimensions, such as geography and time, so they can perform multi-fact analysis. Tableau provides analytic guidance on how to leverage the underlying data model.
Tableau 2024.1
Tableau 2024.1 has new capabilities that help you drive better and faster decision-making with trusted generative AI. Highlights include Tableau Pulse, Amazon Marketplace availability, Viz Navigation for Text Table, and more.
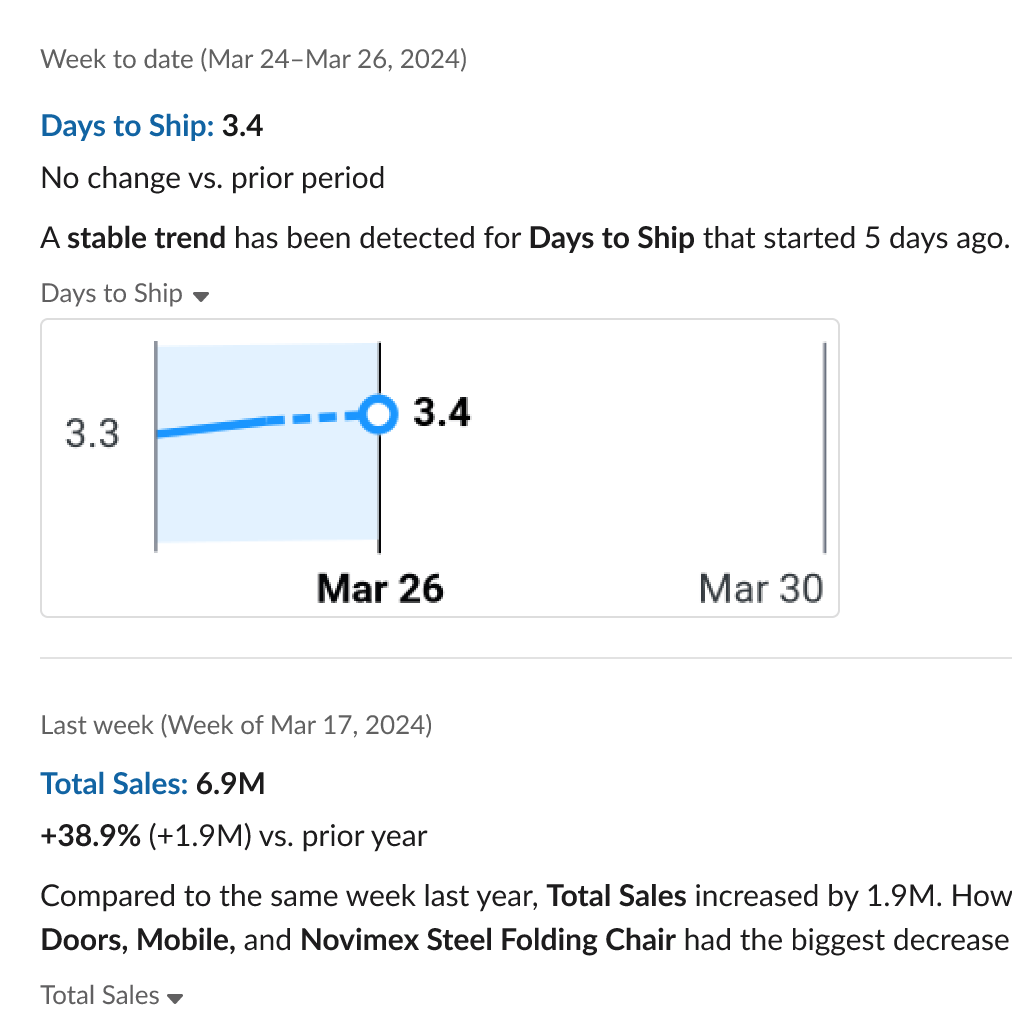
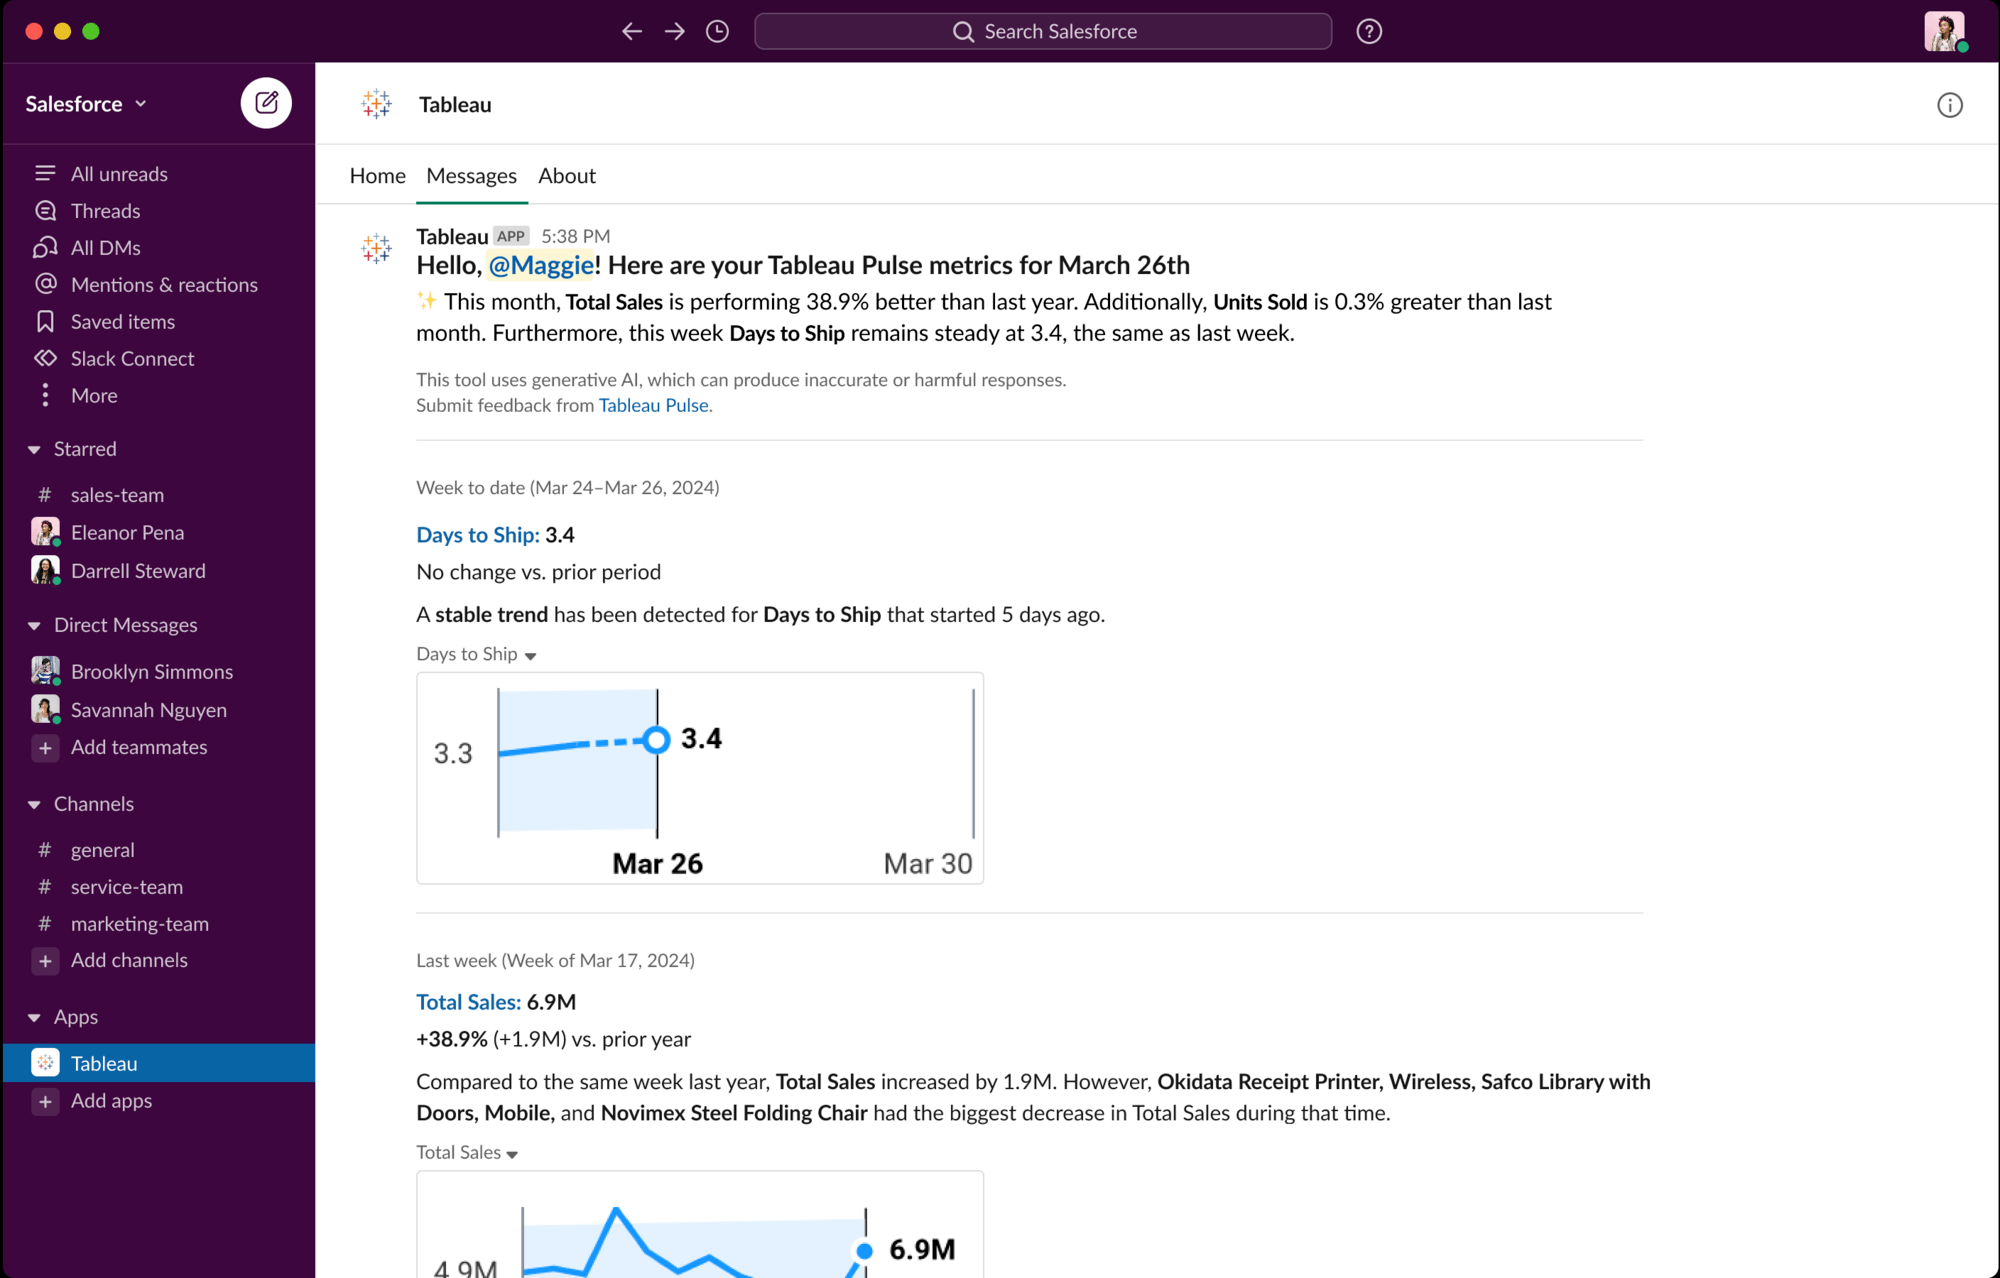
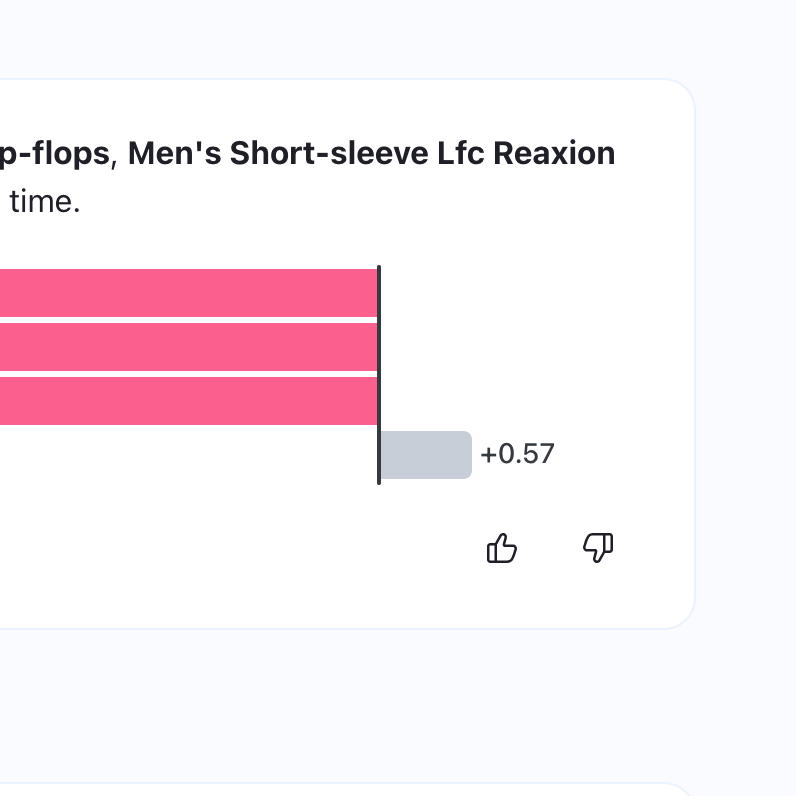
Pulse - Sparklines in Slack
Your Pulse Digest in Slack is more powerful than ever. You now receive natural language insights accompanied by a visual explanation, making it easier to assess the changes in your metrics in the flow of work. Quickly identify the trend in your metrics and if it’s within the expected range so you can make appropriate and timely decisions.
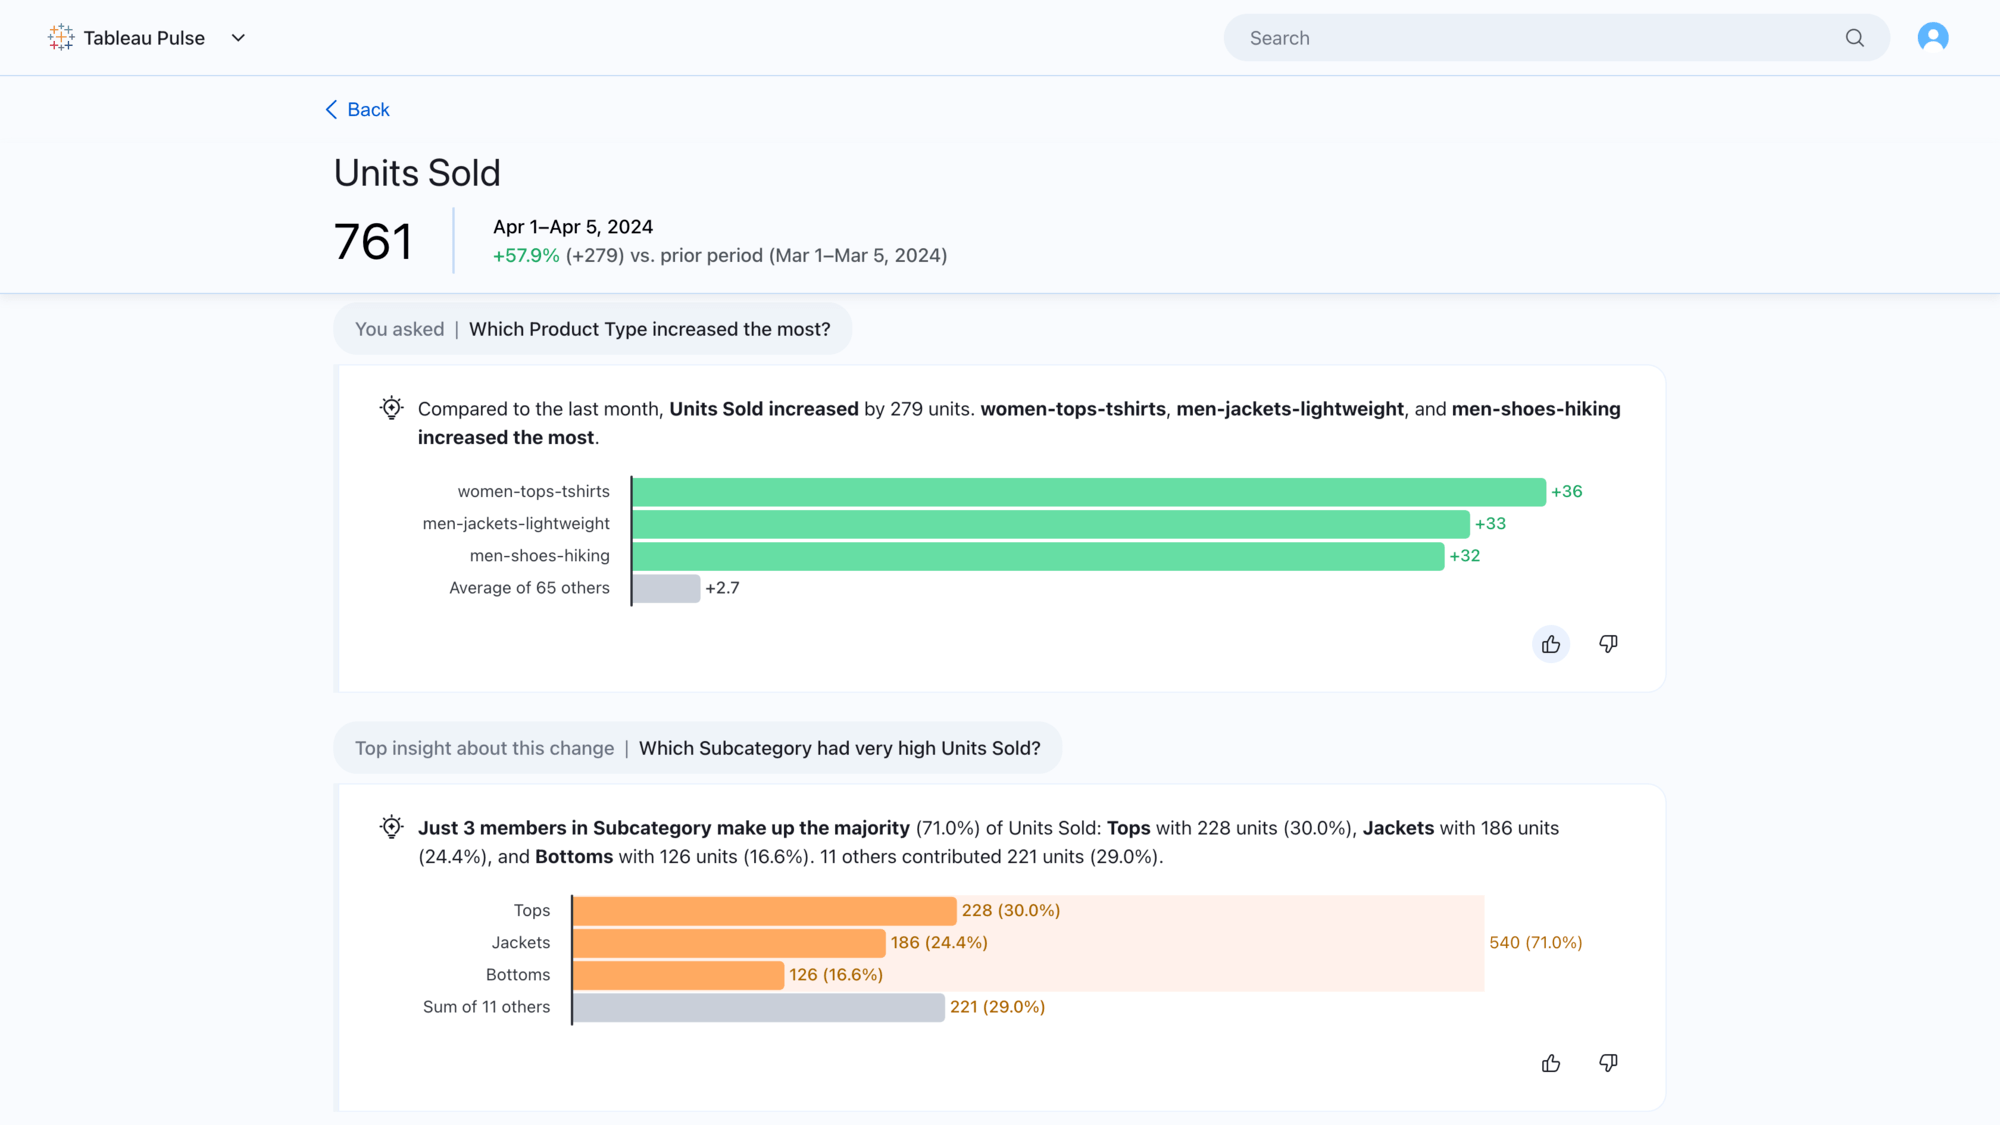
Pulse - Personalized Insights Ranking
Enhance your experience by letting Pulse know which insights you find most valuable. With personalized insight ranking, your feedback on thumbs-up and thumbs-down will shape the insights you see first. Receive insights tailored to your interests and preferences, improving your overall user experience across different workflows, including Digests, Home page, and Metric details page.
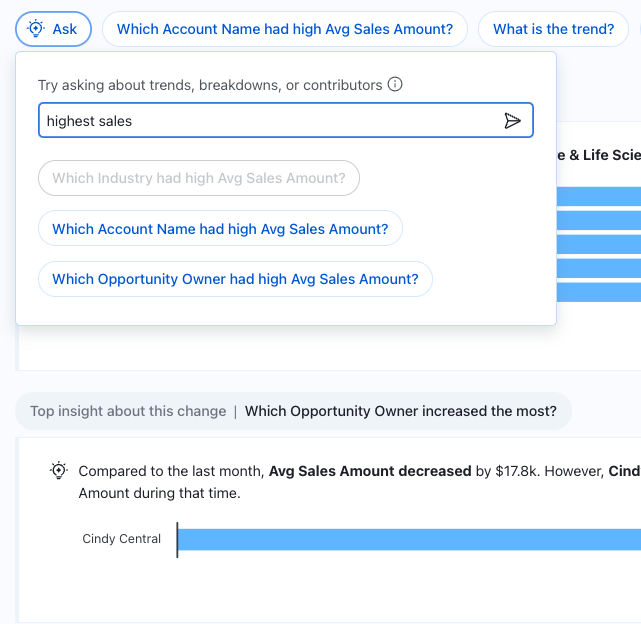
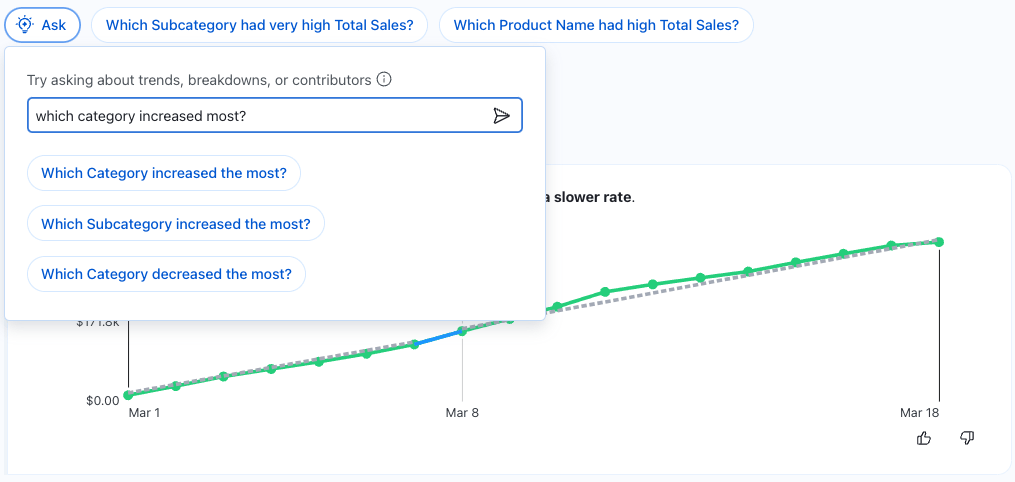
Pulse Q&A Enhancements
Pulse Q&A unlocks more ways to explore your insights through guided questions and through the ability to ask questions. You will now see an additional "Ask" button next to the existing guided questions which enables you to ask questions related to metrics you are investigating. Using the "Ask" feature will prompt suggested questions that match the insights you are investigating.
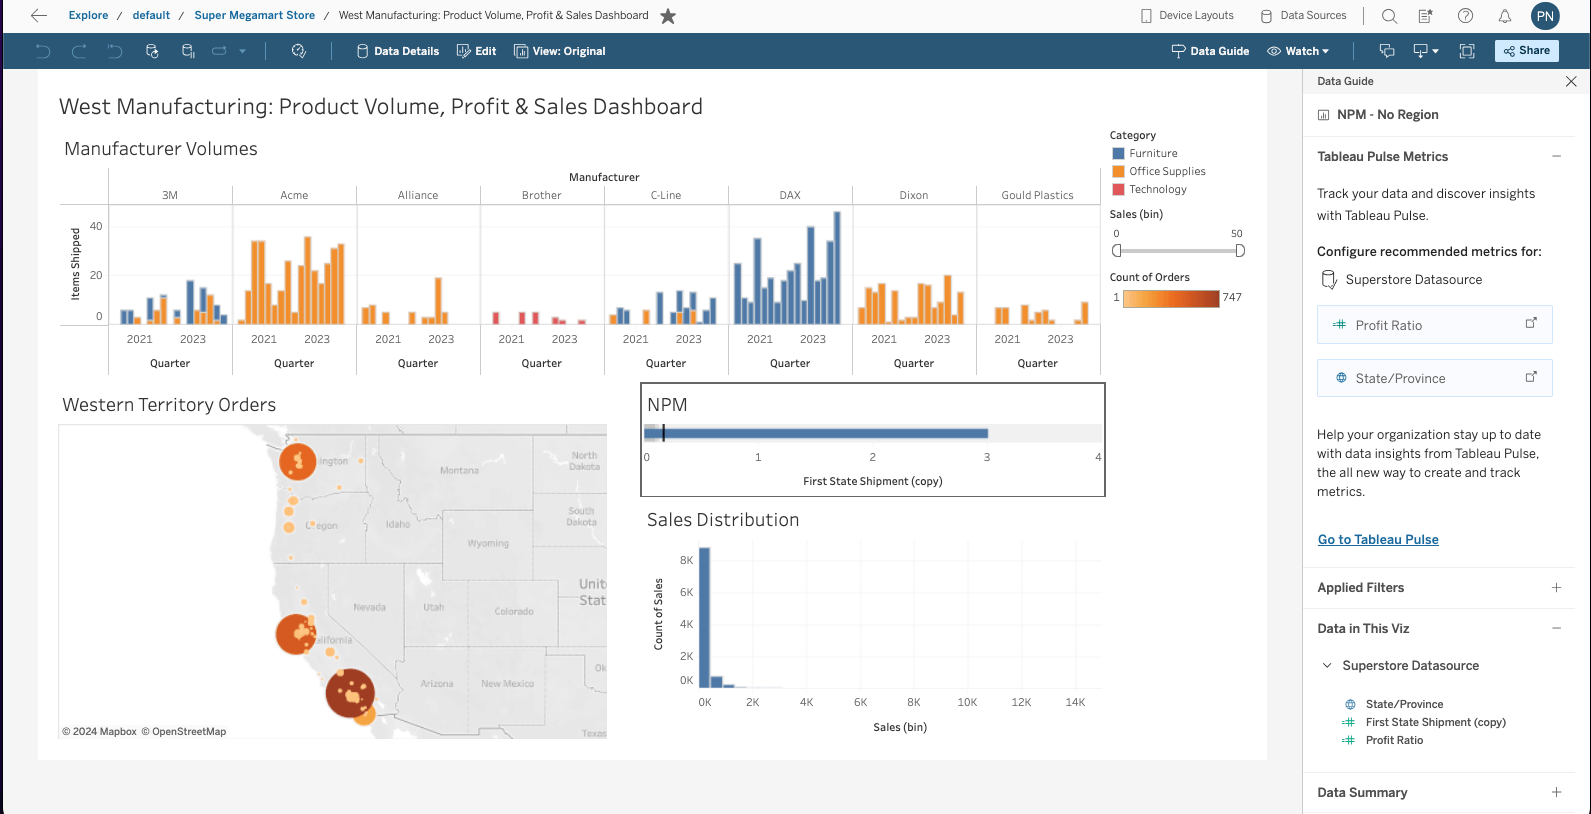
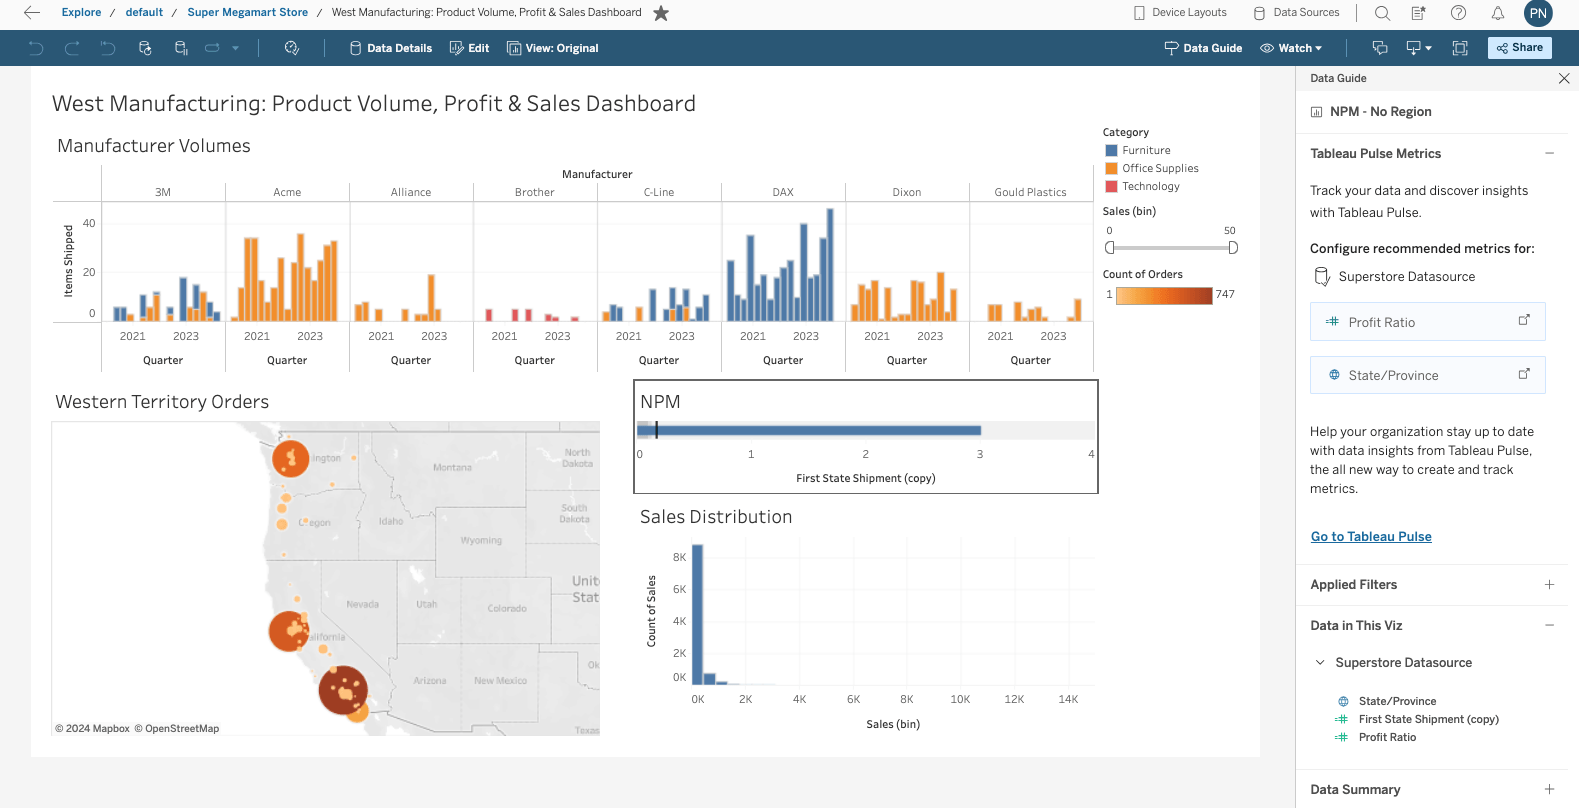
Metric Bootstrapping Enhancements
Discover Tableau Pulse metrics hidden in dashboard vizzes with smarter heuristics and more context using Tableau Data Guide. Enhancements include improved heuristics to identify primary measures and dimensions in key Tableau viz types (bar, area, and line charts), recognition and inclusion of calculated fields within Published Data Source (PDS), and improved visualization of icons for measures and dimensions.
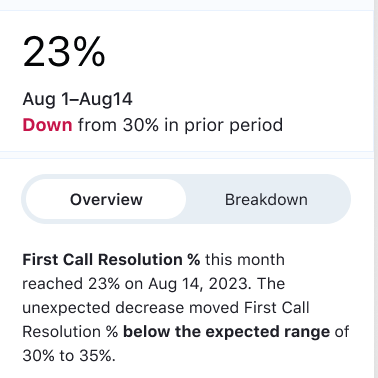
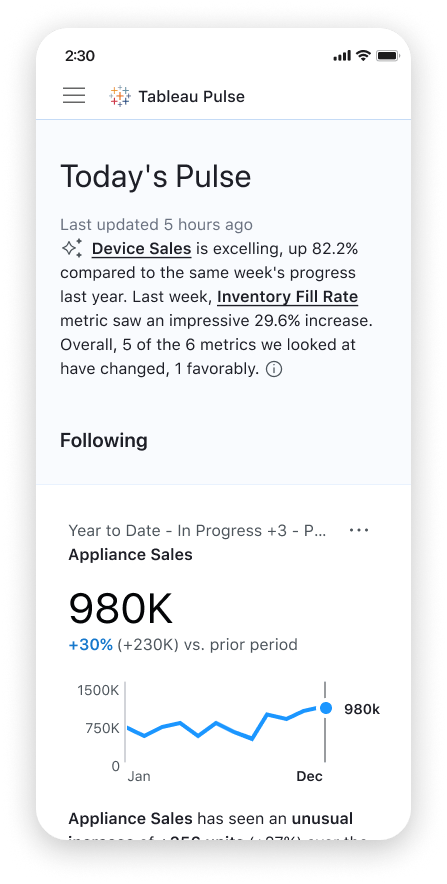
Tableau Pulse Mobile
Check your metrics on the go. Access Tableau Pulse on Tableau Mobile and explore personalized data insights to help you understand the trends, outliers, and other noteworthy changes to the metrics that matter most to you. Tableau Pulse on Mobile makes it easy for you to access your insights by linking metrics in Tableau Pulse email and Slack directly to the app's insights exploration page so you can dig deeper with just one click.
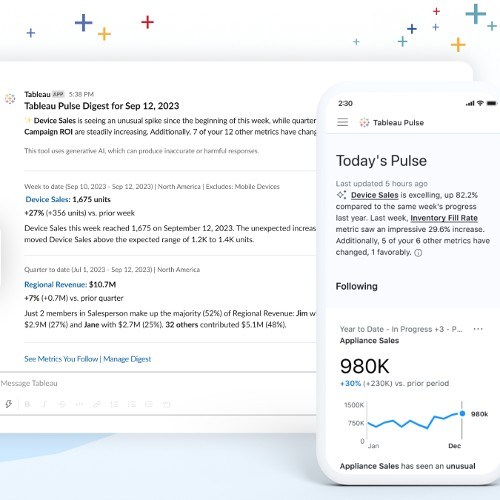
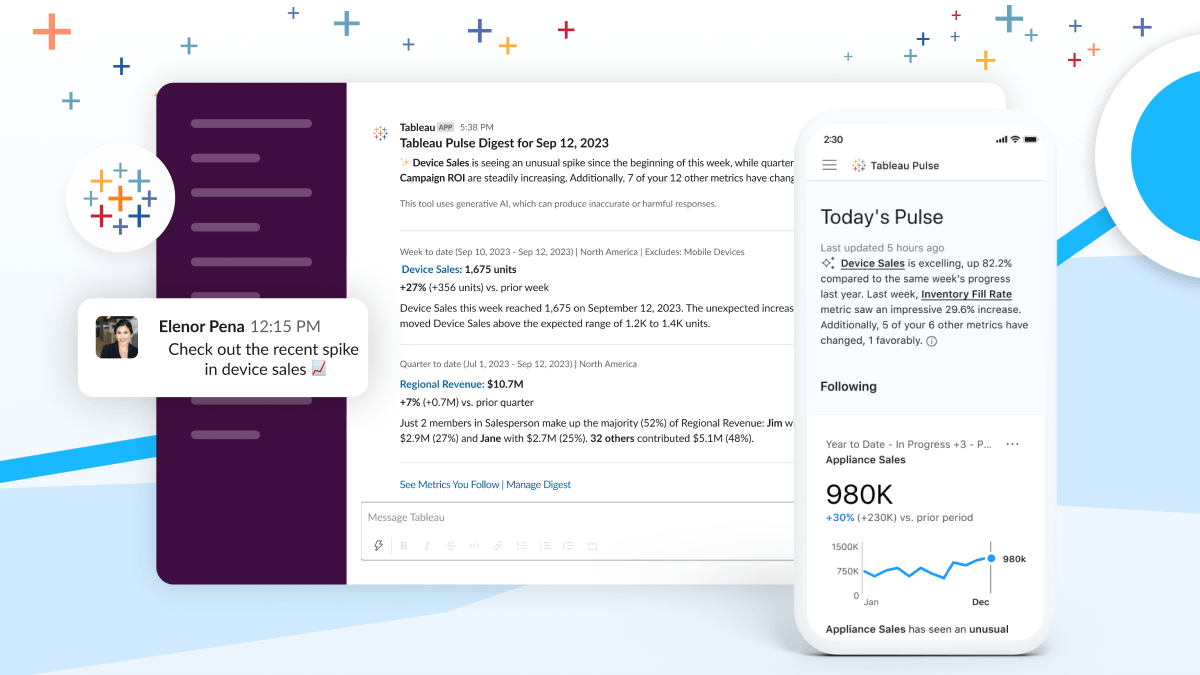
Tableau Pulse Next-Gen Experiences
Discover, follow, and share your key business metrics to quickly identify insights in a friendly and intuitive experience. Tableau Pulse’s Next-Gen Experiences provide digestible data insights wherever you like to work—whether it’s in Slack, email or any application. The best part? Tableau Pulse delivers your insights proactively so you can make decisions on time.
Tableau 2023.3
Tableau 2023.3 has new capabilities that help you see, understand, and act on your data. Highlights include dynamic axis ranges, the Embedding Playground, the native Lightning Web Component for Tableau, and more.
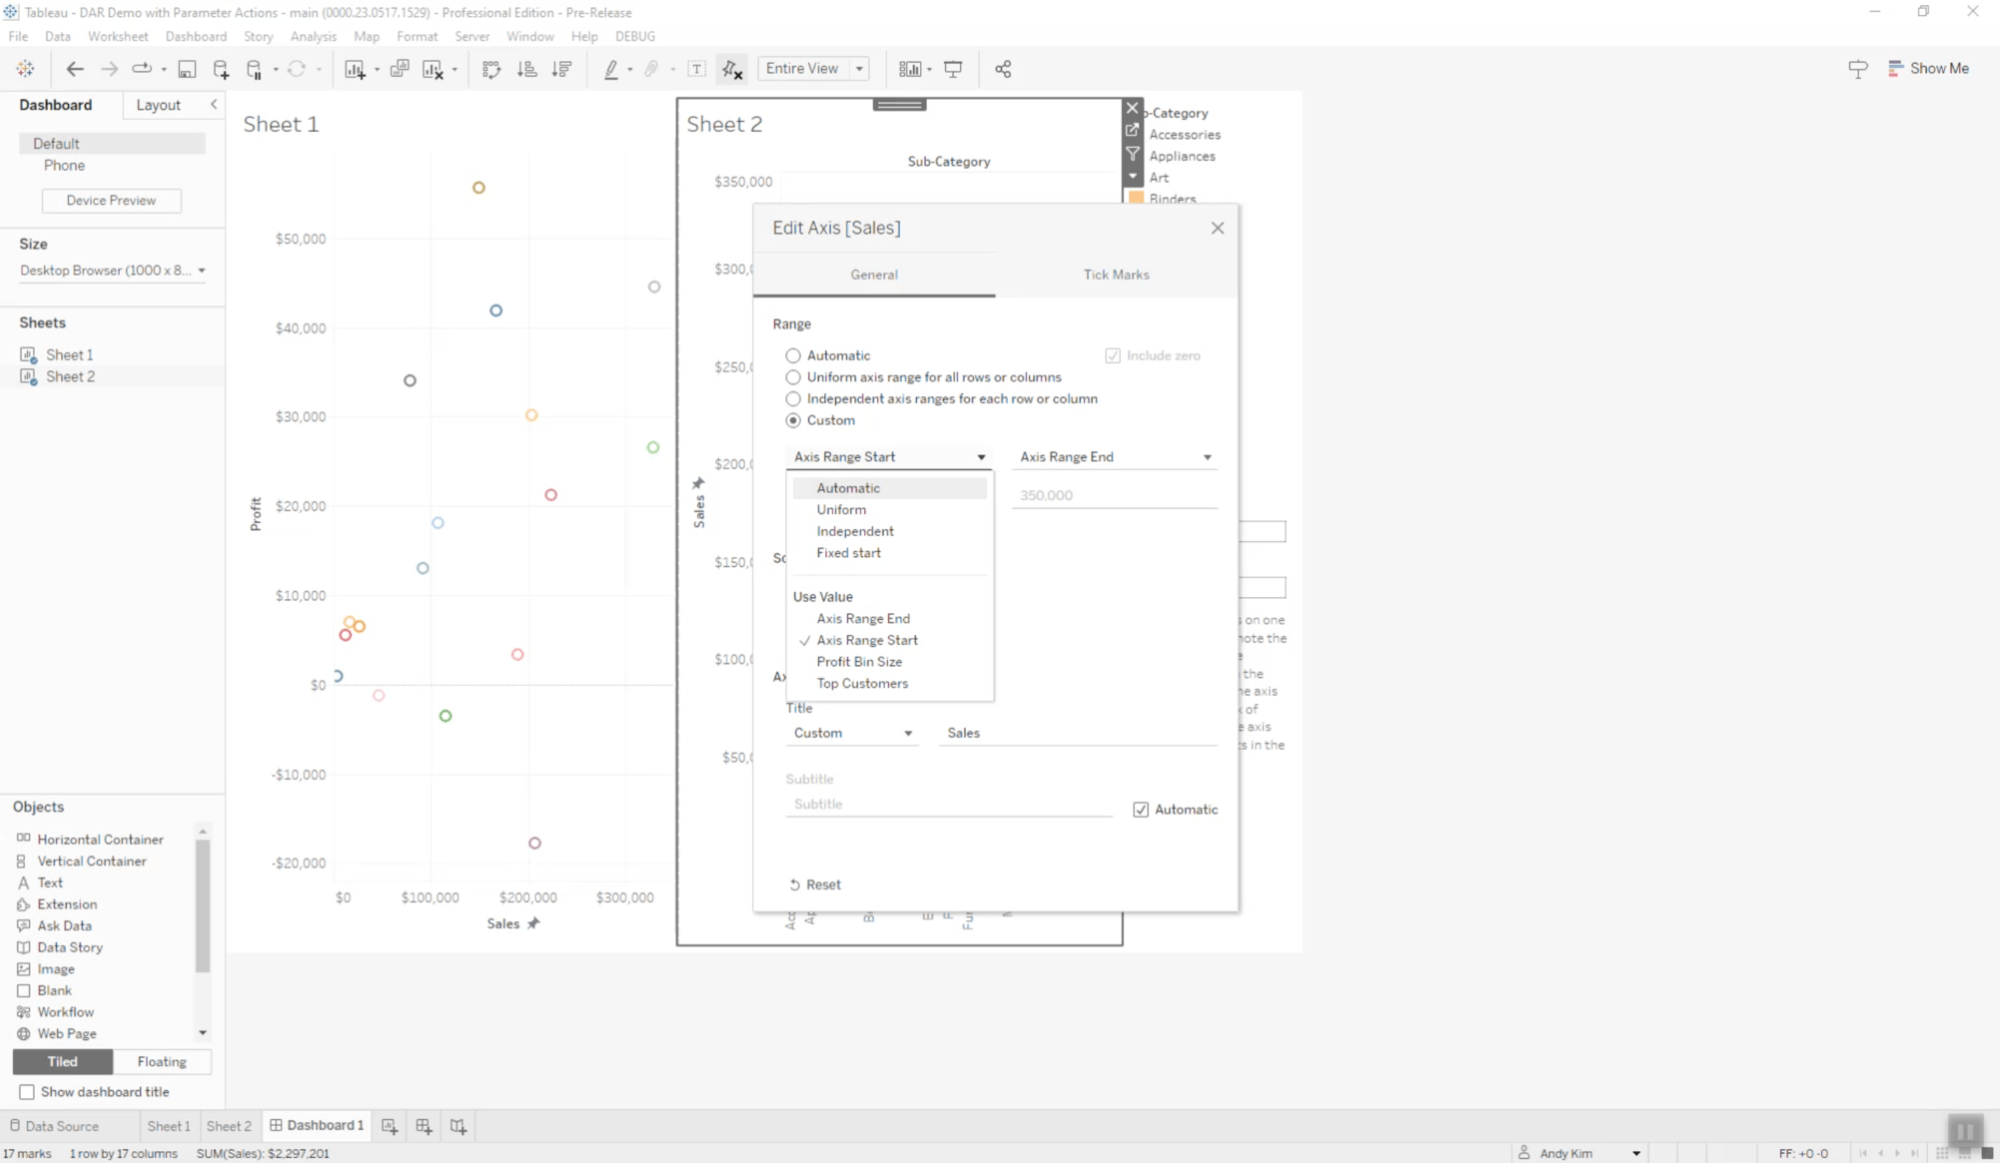
Dynamic axis ranges
Create more dynamic visualizations by using the value of parameters in the workbook to set axis ranges. This feature allows you to select different parameters to use as each axis range. You can have a single dynamic axis extent (just start or end) or can set both extents using compatible fields.
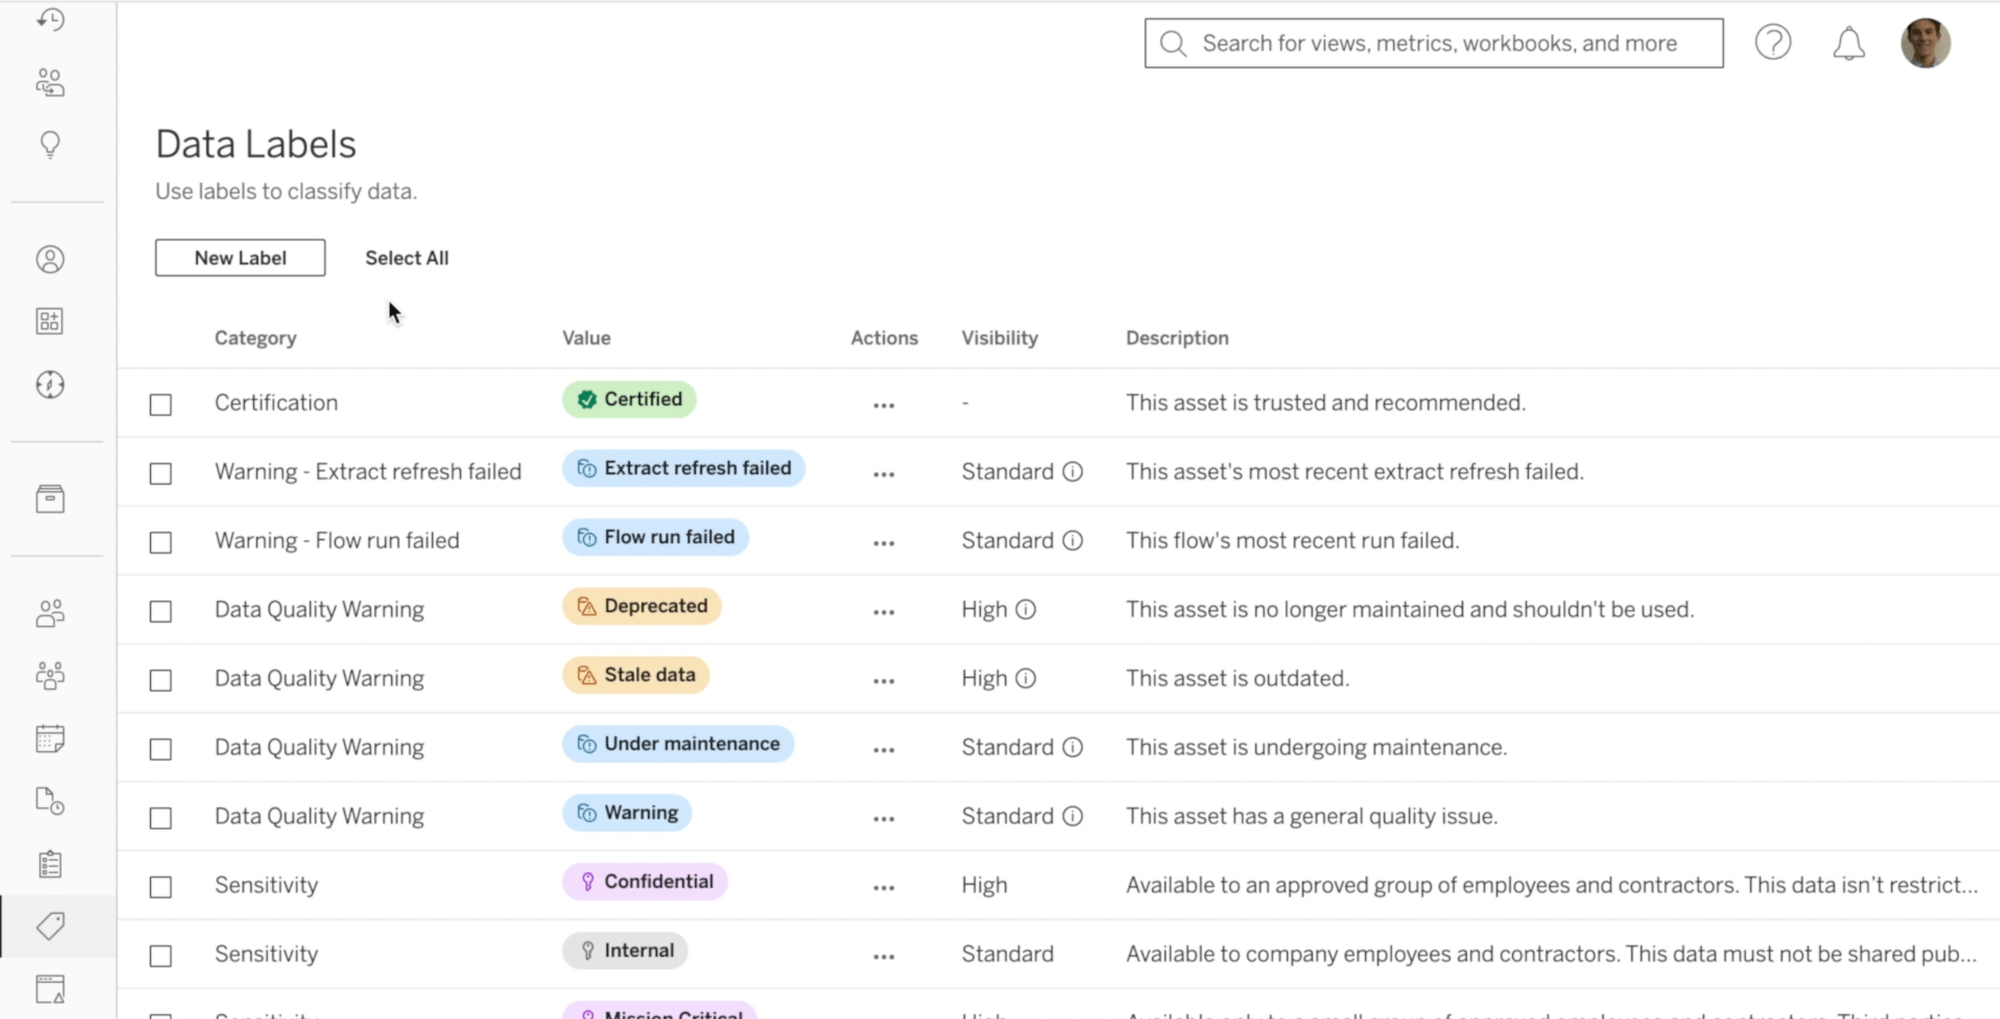
Custom data labels
Make your data more discoverable by categorizing it within Tableau. Custom data labels are a continuation of a set of labeling features we've brought to Tableau over the years, including certifications, data quality warnings, and sensitivity labels. Admins can now define custom data labels that Creators and Explorers can add to data assets for improved discovery and auditing within Tableau. You can also use the Data Labels API to allow third-party applications to add labels to a Tableau site for metadata not created in Tableau, such as those in upstream content like databases and tables.
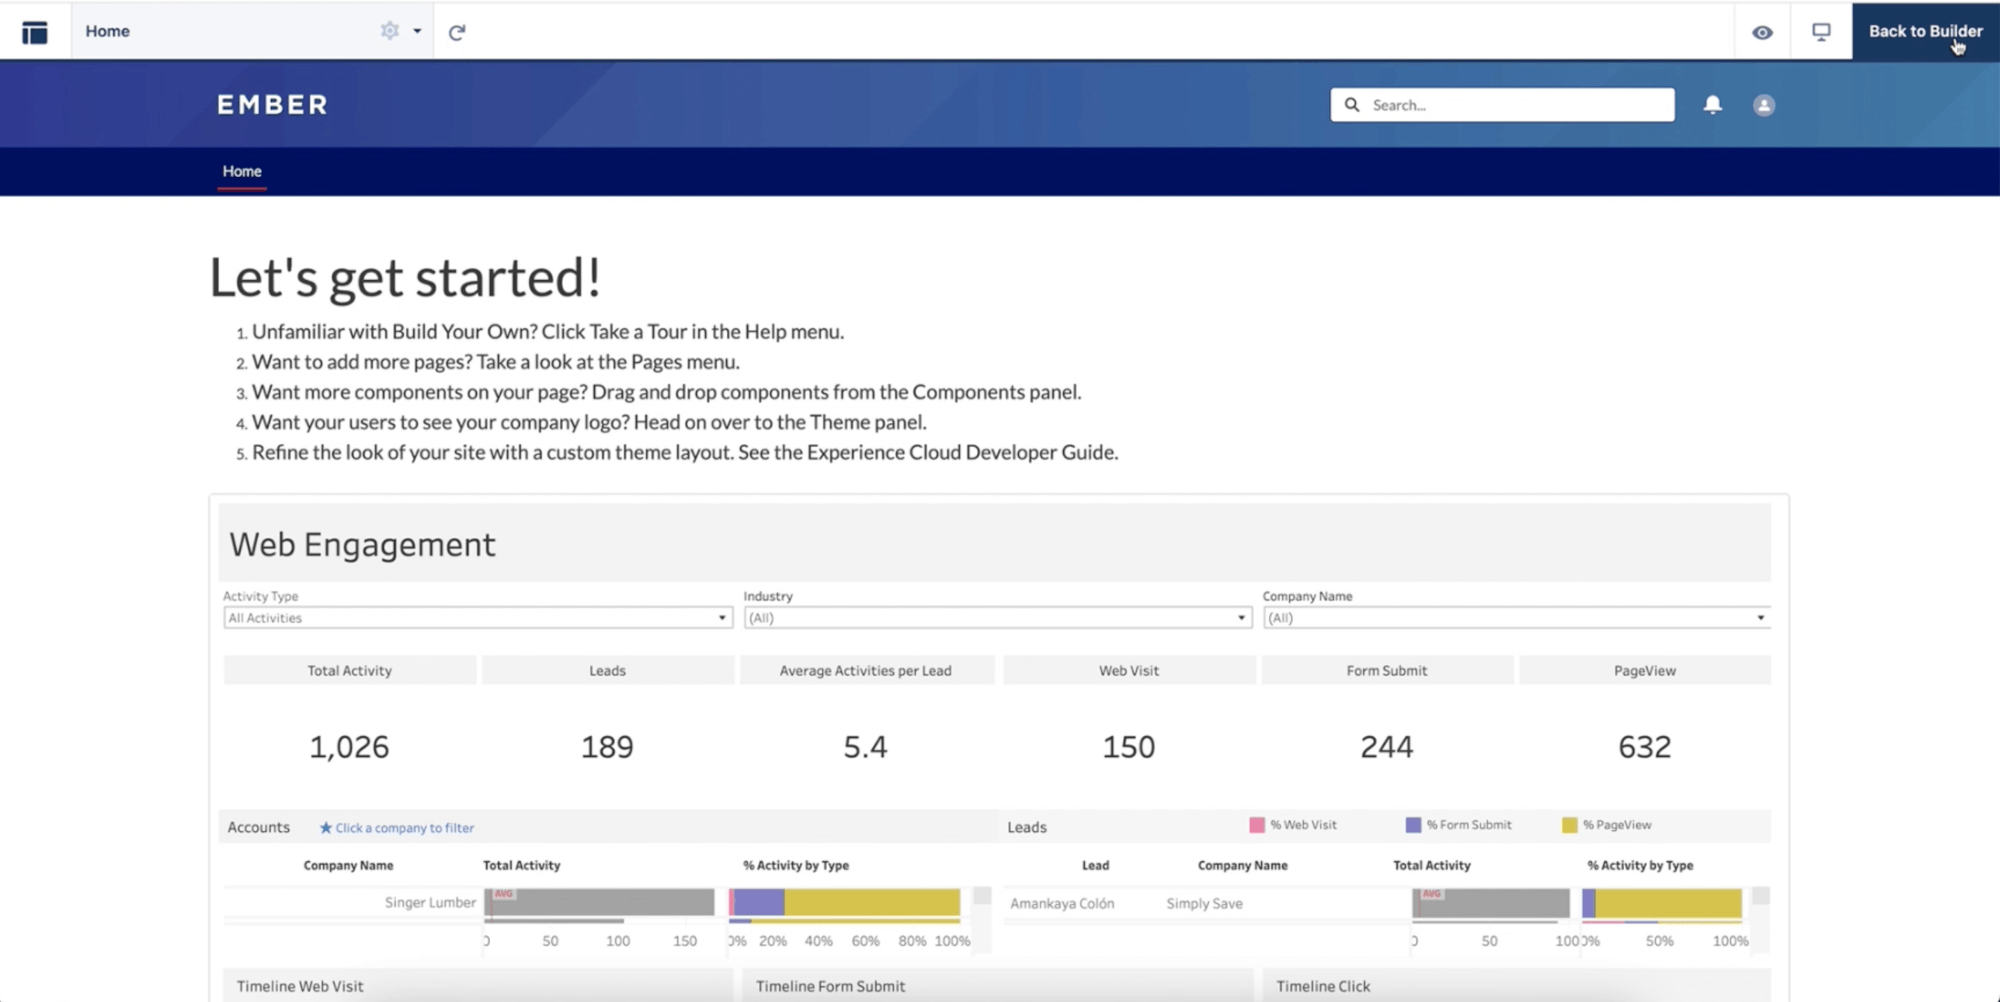
Native Lightning Web Component for Tableau
Take your data insights where your users are. You can now embed Tableau Vizzes into Salesforce via Lightning Web Component and seamlessly authenticate with Trusted Tokens using Connected Apps. This allows for a more seamless analytics experience where CRM Analytics charts and Tableau visualizations can be viewed in the same experience, all within Salesforce. Tableau Component filter parameters also allow filters to pass from a CRM Analytics Dashboard to a Tableau Component and vice versa to keep them in sync.
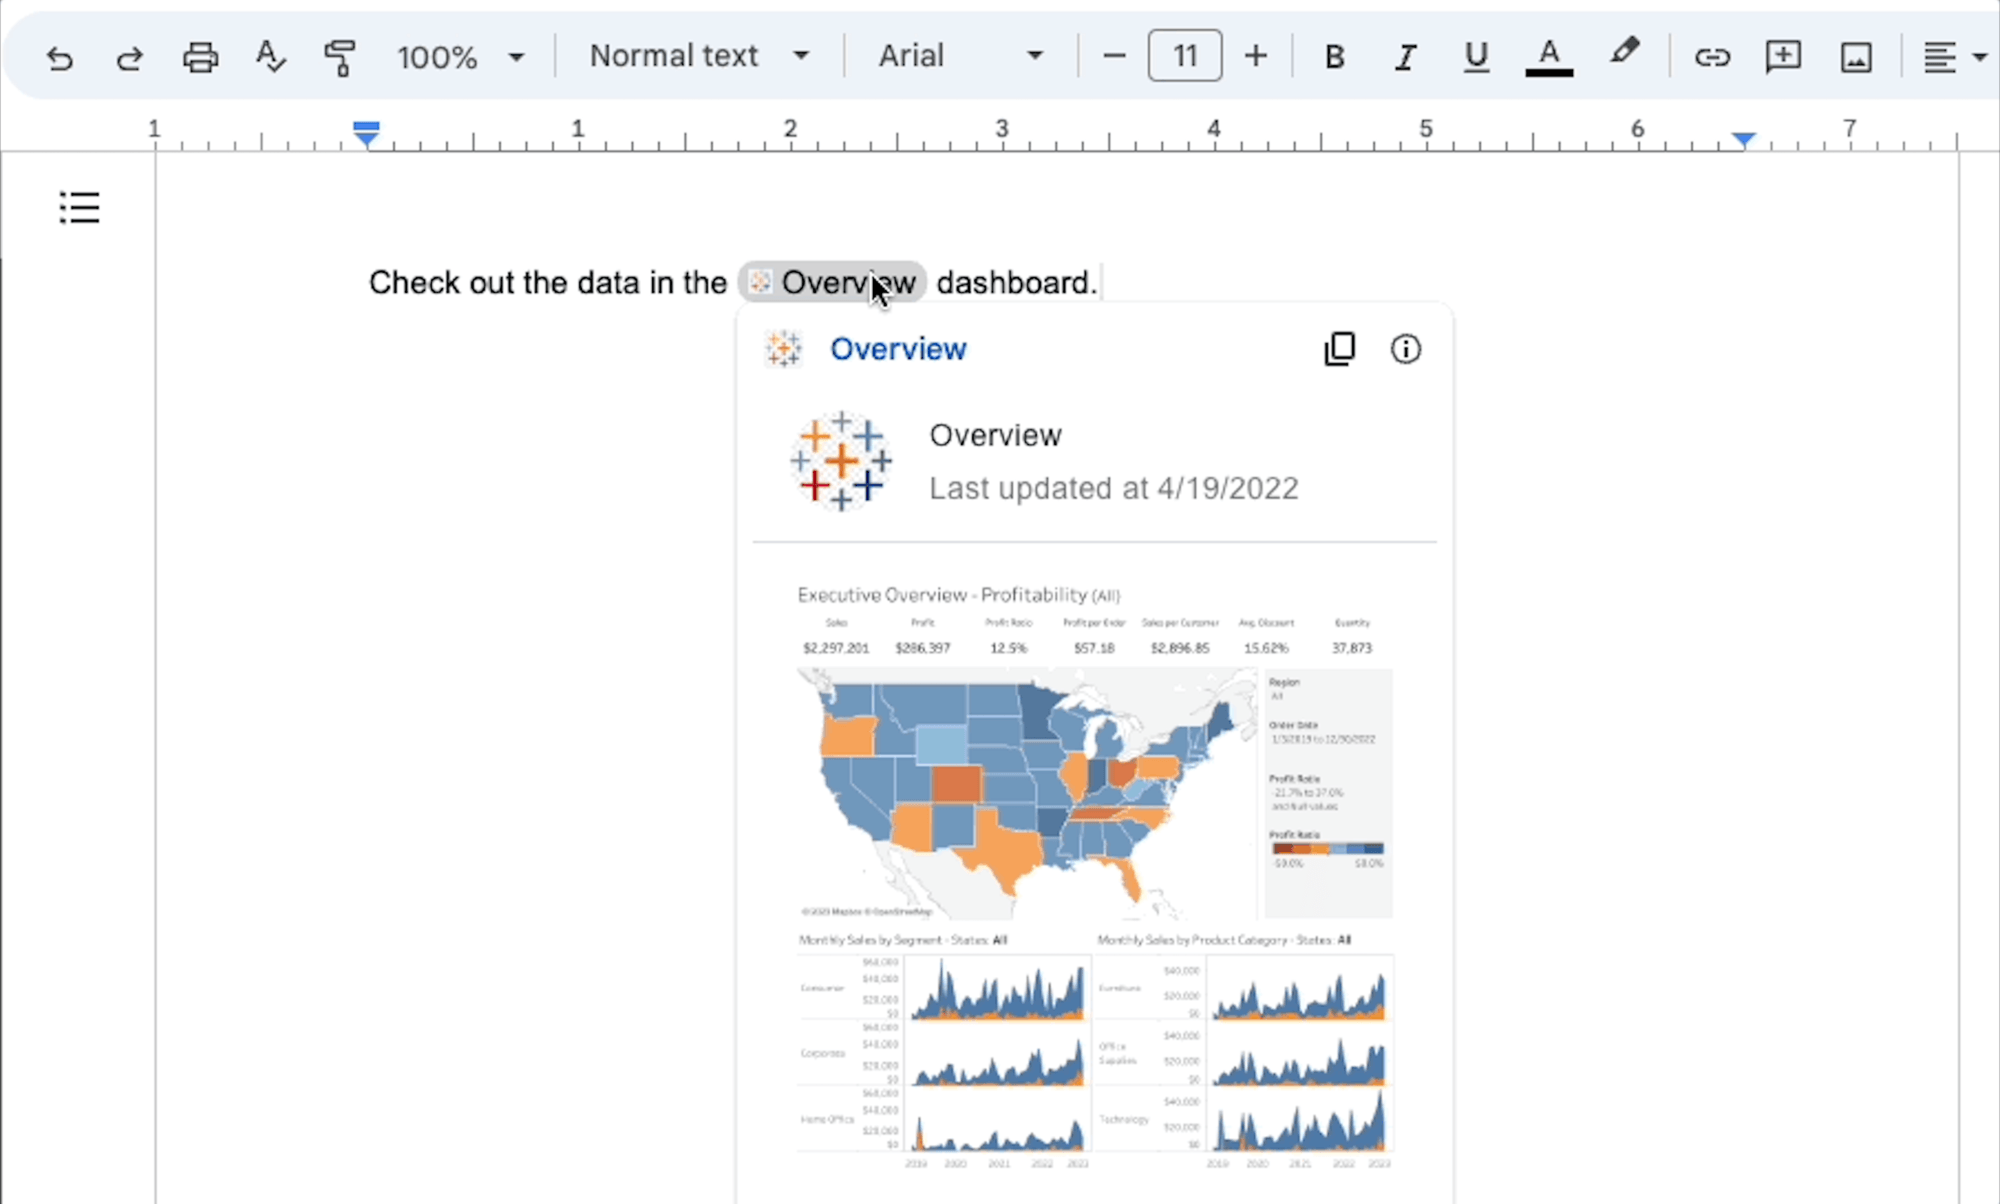
Tableau Cloud add-on for Google Workspace
Get data insights in the flow of work. With our latest partnership with Google, users can quickly preview a Tableau Cloud visualization from within Google Docs. With the Tableau integration with Google Smartchips for Google Workspace, links pointing to a Tableau Cloud visualization are instantly converted to thumbnail views showing the Tableau visualization’s name, last updated date, and a preview image. Thumbnails are generated on the spot, always showing the latest data! You can also click to open the visualization in Tableau Cloud for further exploration. Available now in the Google Workspace Marketplace.
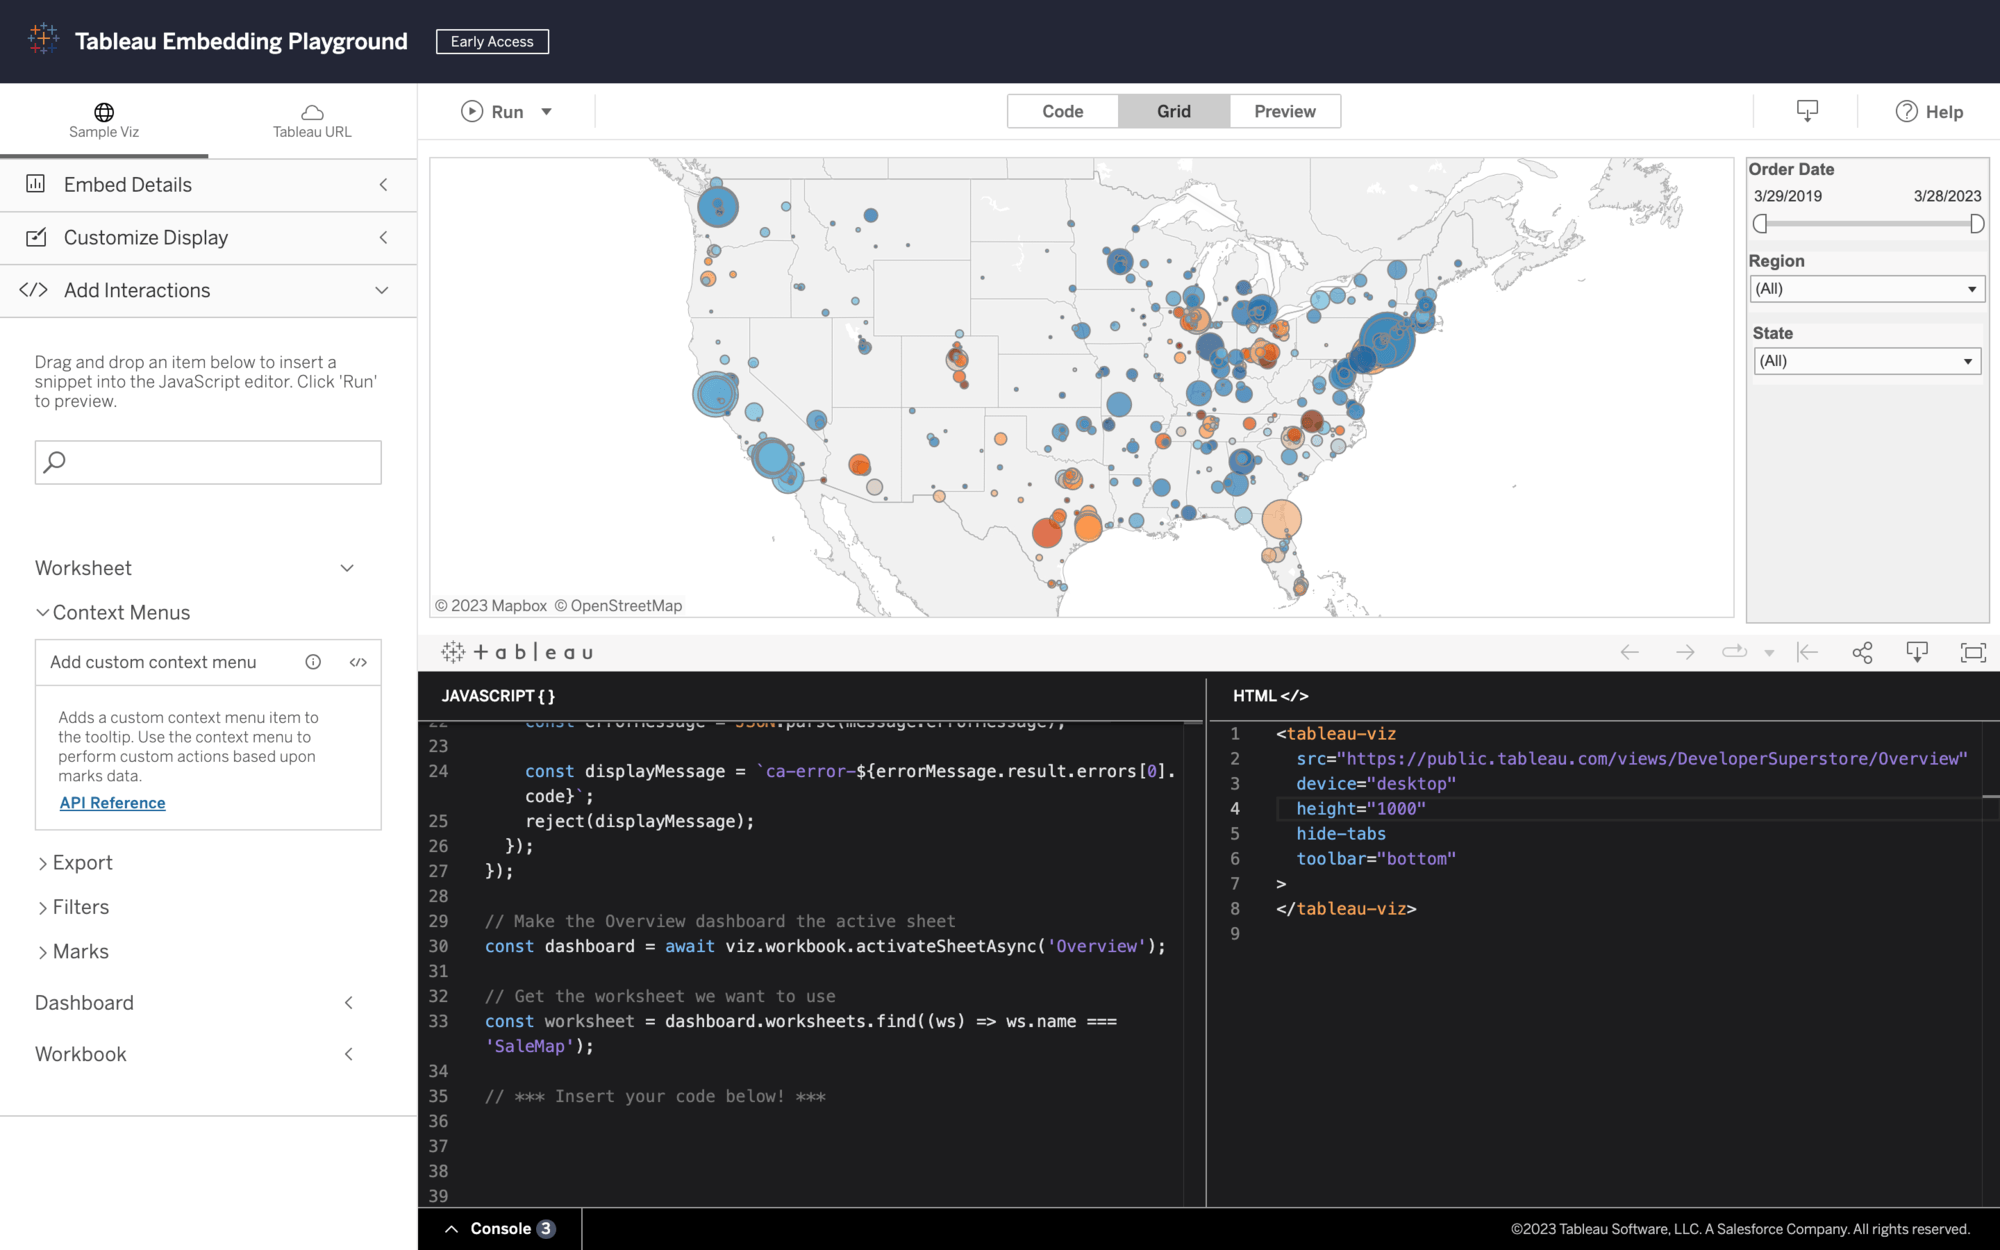
Embedding Playground
Rapidly develop custom code in a matter of minutes. The Tableau Embedding Playground is an interactive learning environment where you can gain hands-on experience with key embedded analytics capabilities. In the Embedding Playground, you can quickly create exportable code to embed interactive visualizations into your application. Discover new possibilities, experiment with capabilities, and get inspired to take your embedded analytics solution to the next level. Available now.
On-demand access
On-demand access allows Embedded Analytics Usage-Based Licensing customers to establish a connected authentication system between their application and Tableau Cloud. With on-demand access, customers can use Tableau’s Connected Apps functionality to assert users and permissions at the time of access. You can now maintain a single source of truth for user identities, roles, and privileges in just your application instead of having to create, sync, and/or maintain those accounts in Tableau too.
Tableau 2023.2
Tableau 2023.2 has new capabilities that help you analyze your data more effectively and efficiently. Highlights include unified tooltips, a new Data Cloud connector, multi-row calculations in Tableau Prep, and more.
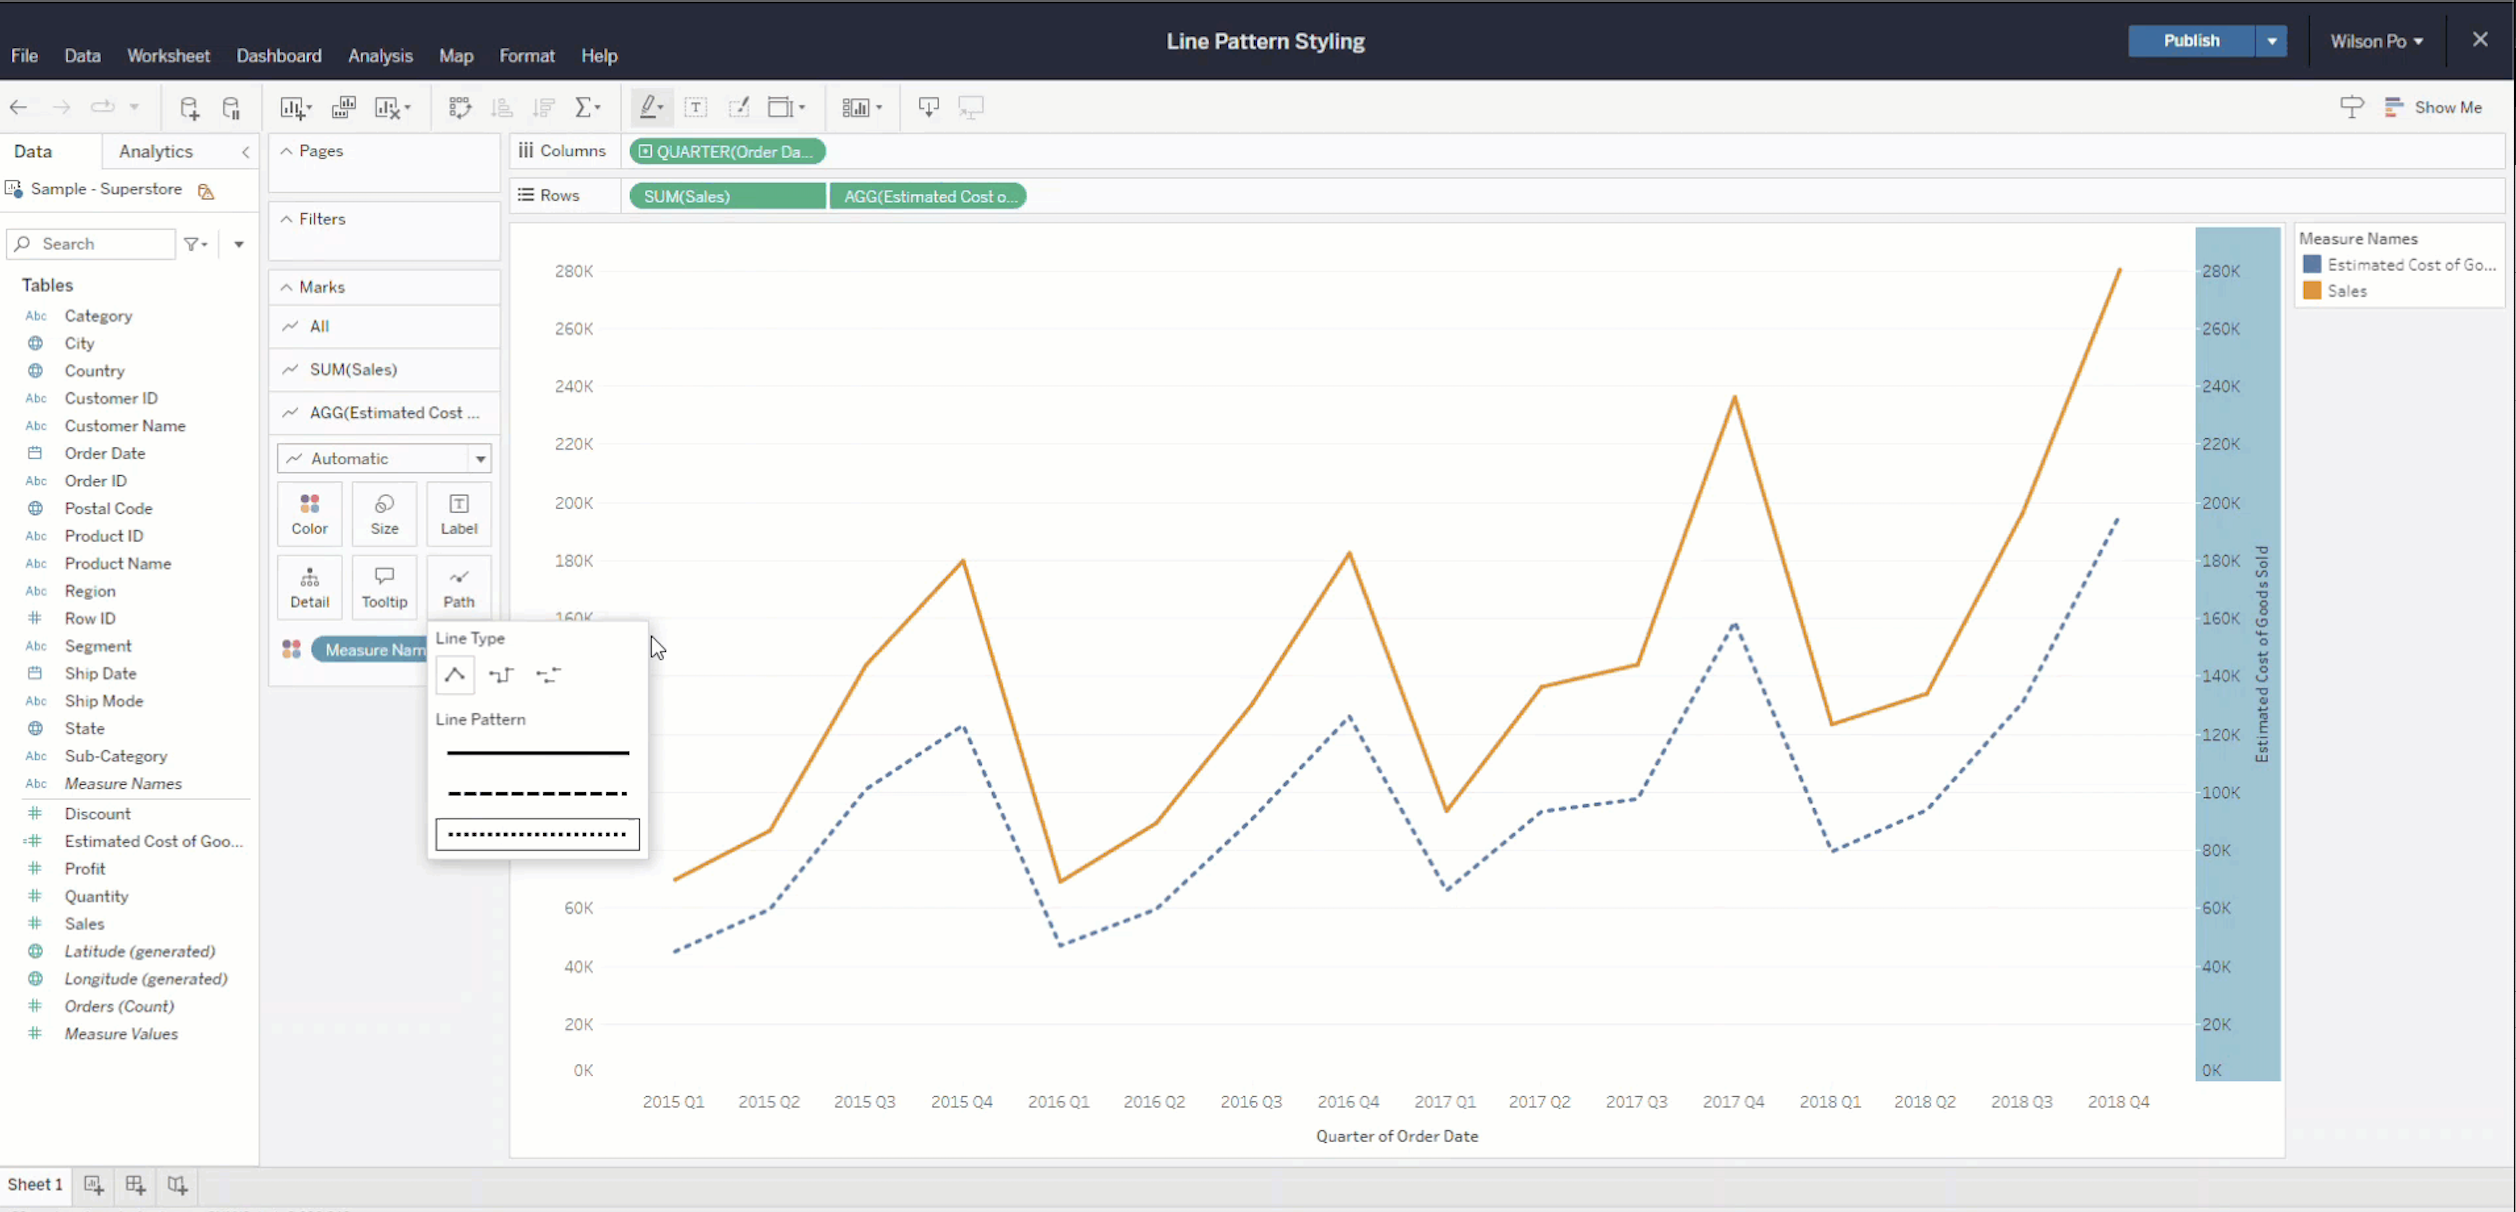
Line Patterns
Line Patterns offer new styling capabilities, allowing an author to select any trend line to be represented as a solid, dashed, or dotted lines. This new capability makes it easier to convey nuance when representing multiple trends, where styling can help to convey when certain lines represent unique context, such as thresholds or modeled data points.
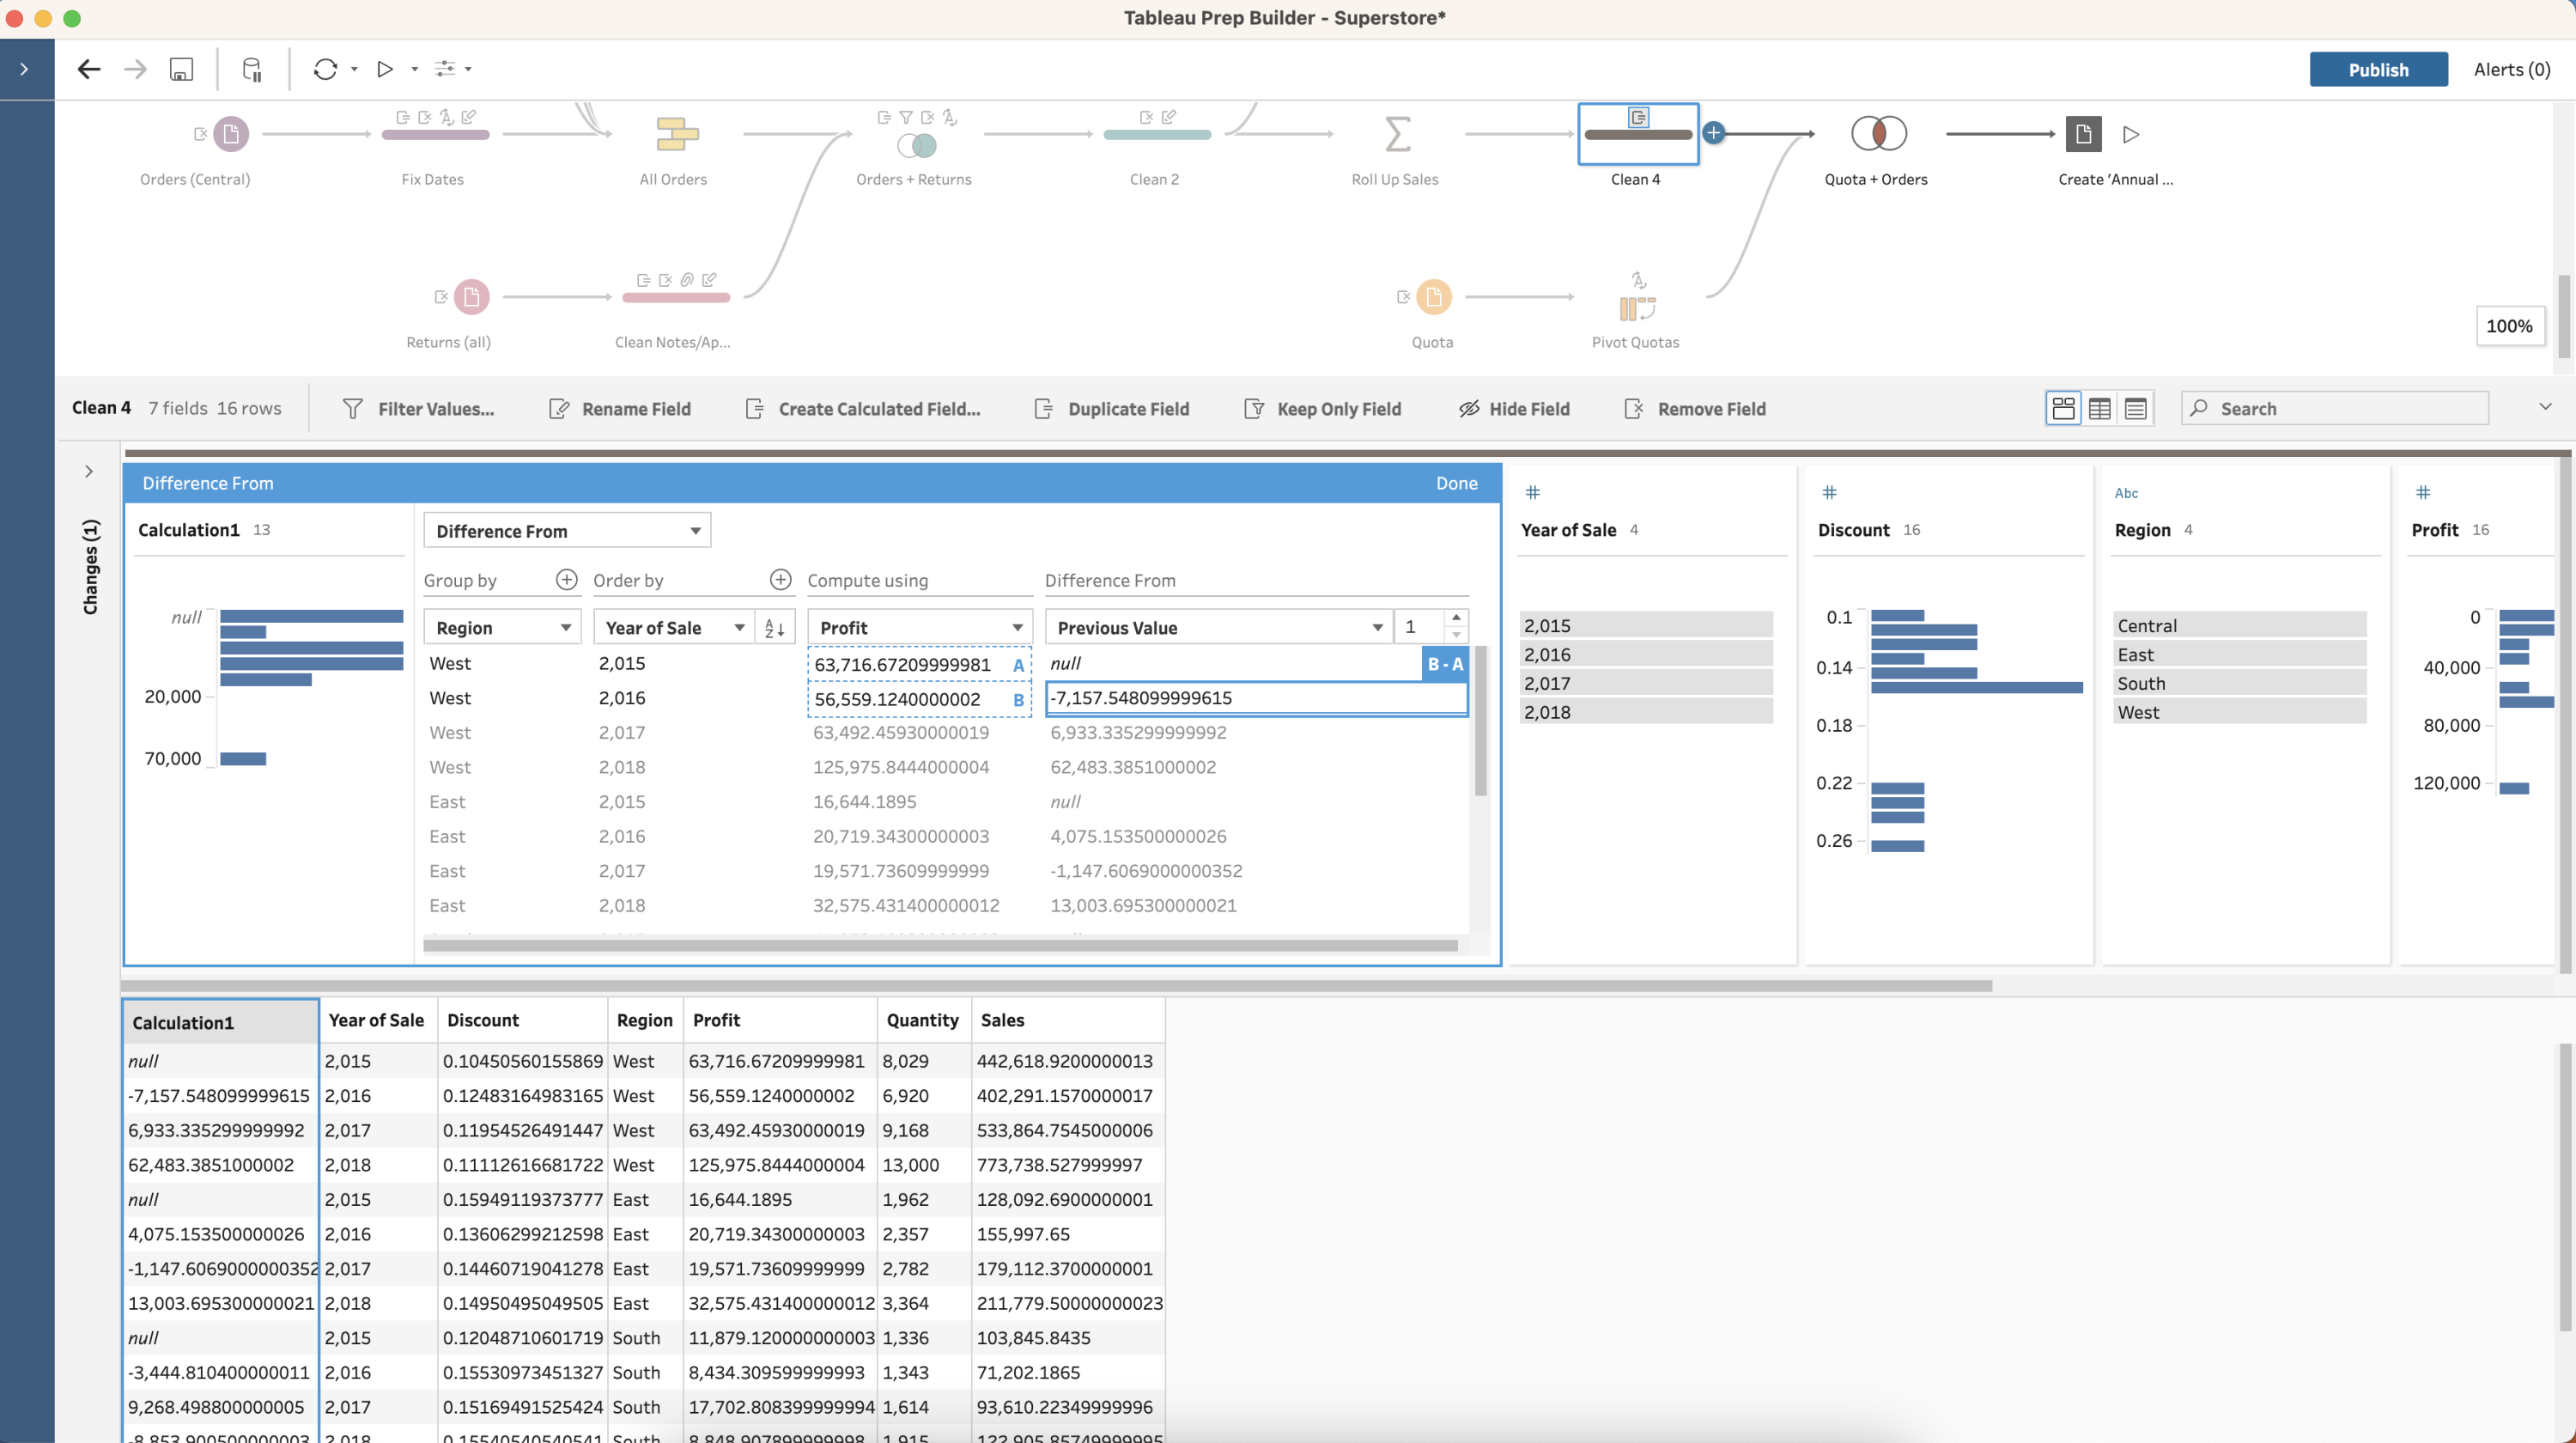
Multi-row calculations in Tableau Prep
With multi-row calculations in Tableau Prep you can compute table calculations while preparing your data. Using clicks, not code or complex calculations, it is easier than ever to calculate difference from, percent difference from, and moving calculations. You can also now write LOOKUP calculations in the expression editor of Tableau Prep.
Personal access token admin control
Meet your organizational security requirements with additional control over personal access tokens (PATs) in Tableau Cloud.
Changes for all Tableau Cloud sites include:
- Site admins can now control who has the ability create PATs
- Site admins can now control how long PATs are valid, ranging from 1 to 365 days
Changes for Tableau Cloud sites created after 23.2 include:
- PATs are disabled by default
- Default expiry of PATs shortened to 180 days
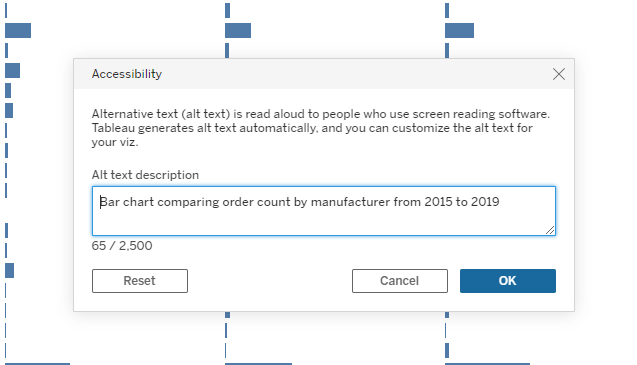
Editable viz alt text
You can now edit automatically generated alt text. By default, Tableau provides automated screen reader text, ensuring there's a description to be announced by screen readers for all online visualizations including client and server side rendered and embedded visualizations. Now, content authors can edit the alt text from either the Data Guide panel or by selecting Accessibility in the Worksheet drop down. Authors can add up to 2500 characters of alt text, providing deep insight into the contents of the visualization.
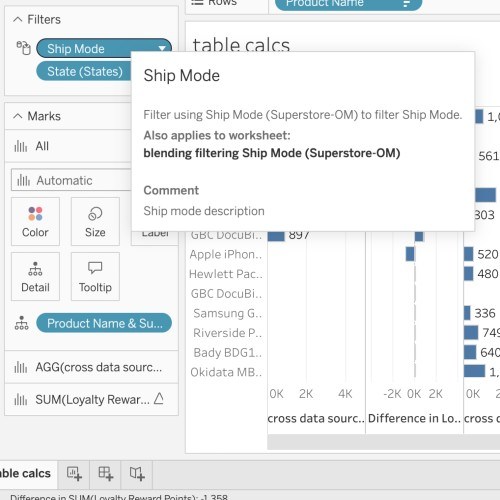
Unified Tooltips
Get more context for your in-shelf pills with new tooltips. Unified Tooltips combine up to six previous tooltips into one that prioritizes information based on relevance. Get the field name, table calc details, and field comments in a single place. Any error messages or filter information now displays in the same tooltip. This unified tooltip is available for pills on all shelves.
Salesforce Data Cloud connector
The Salesforce Data Cloud connector makes it seamless to analyze data from Data Cloud in Tableau. The Data Cloud connector is driver-less, requiring no install, and Data Spaces aware enabling you to create visualizations specific to a Data Space. Data Spaces are logical partitions to organize metadata, data, and processes for relevant stakeholders in Data Cloud. Additionally, the Data Cloud connector shows object label, instead of the object API name, in the Tableau connect UI. This creates a more user-friendly experience when choosing tables to build data sources. The connector also supports an additional 11 functions, including datetime functions, improving your content creation and data analysis processes.
Tableau 2023.1
Tableau 2023.1 has new capabilities that empower everyone to make data-driven decisions. Highlights include Accelerator Data Mapping, Tableau for Slack enhancements, Identity Pools, and more.
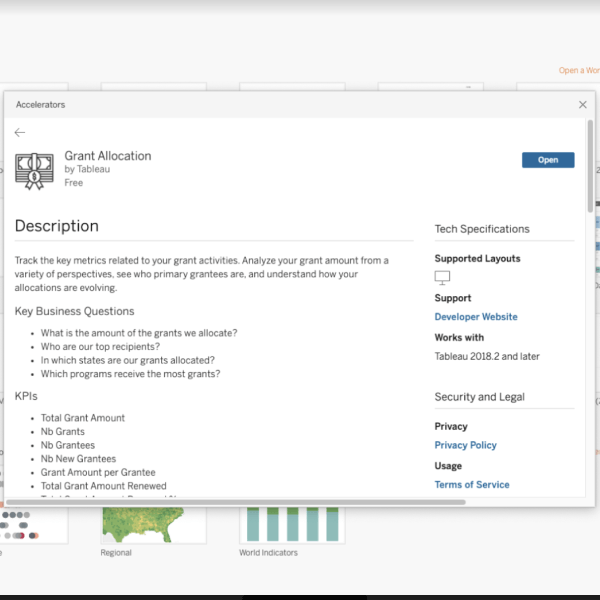
Accelerator Data Mapping
With Data Mapping you can jump start your analytics even faster by reducing the time and effort required to set up an Accelerator’s ready-to-use dashboards. Now, when configuring an Accelerator, the Data Mapper allows users to pull outside data into the Accelerator and map fields from their data source into the fields the Accelerator expects. This will be made possible via the Data Mapping UI - a hybrid dialogue box that opens by default with any Data Mapping enabled Accelerator.
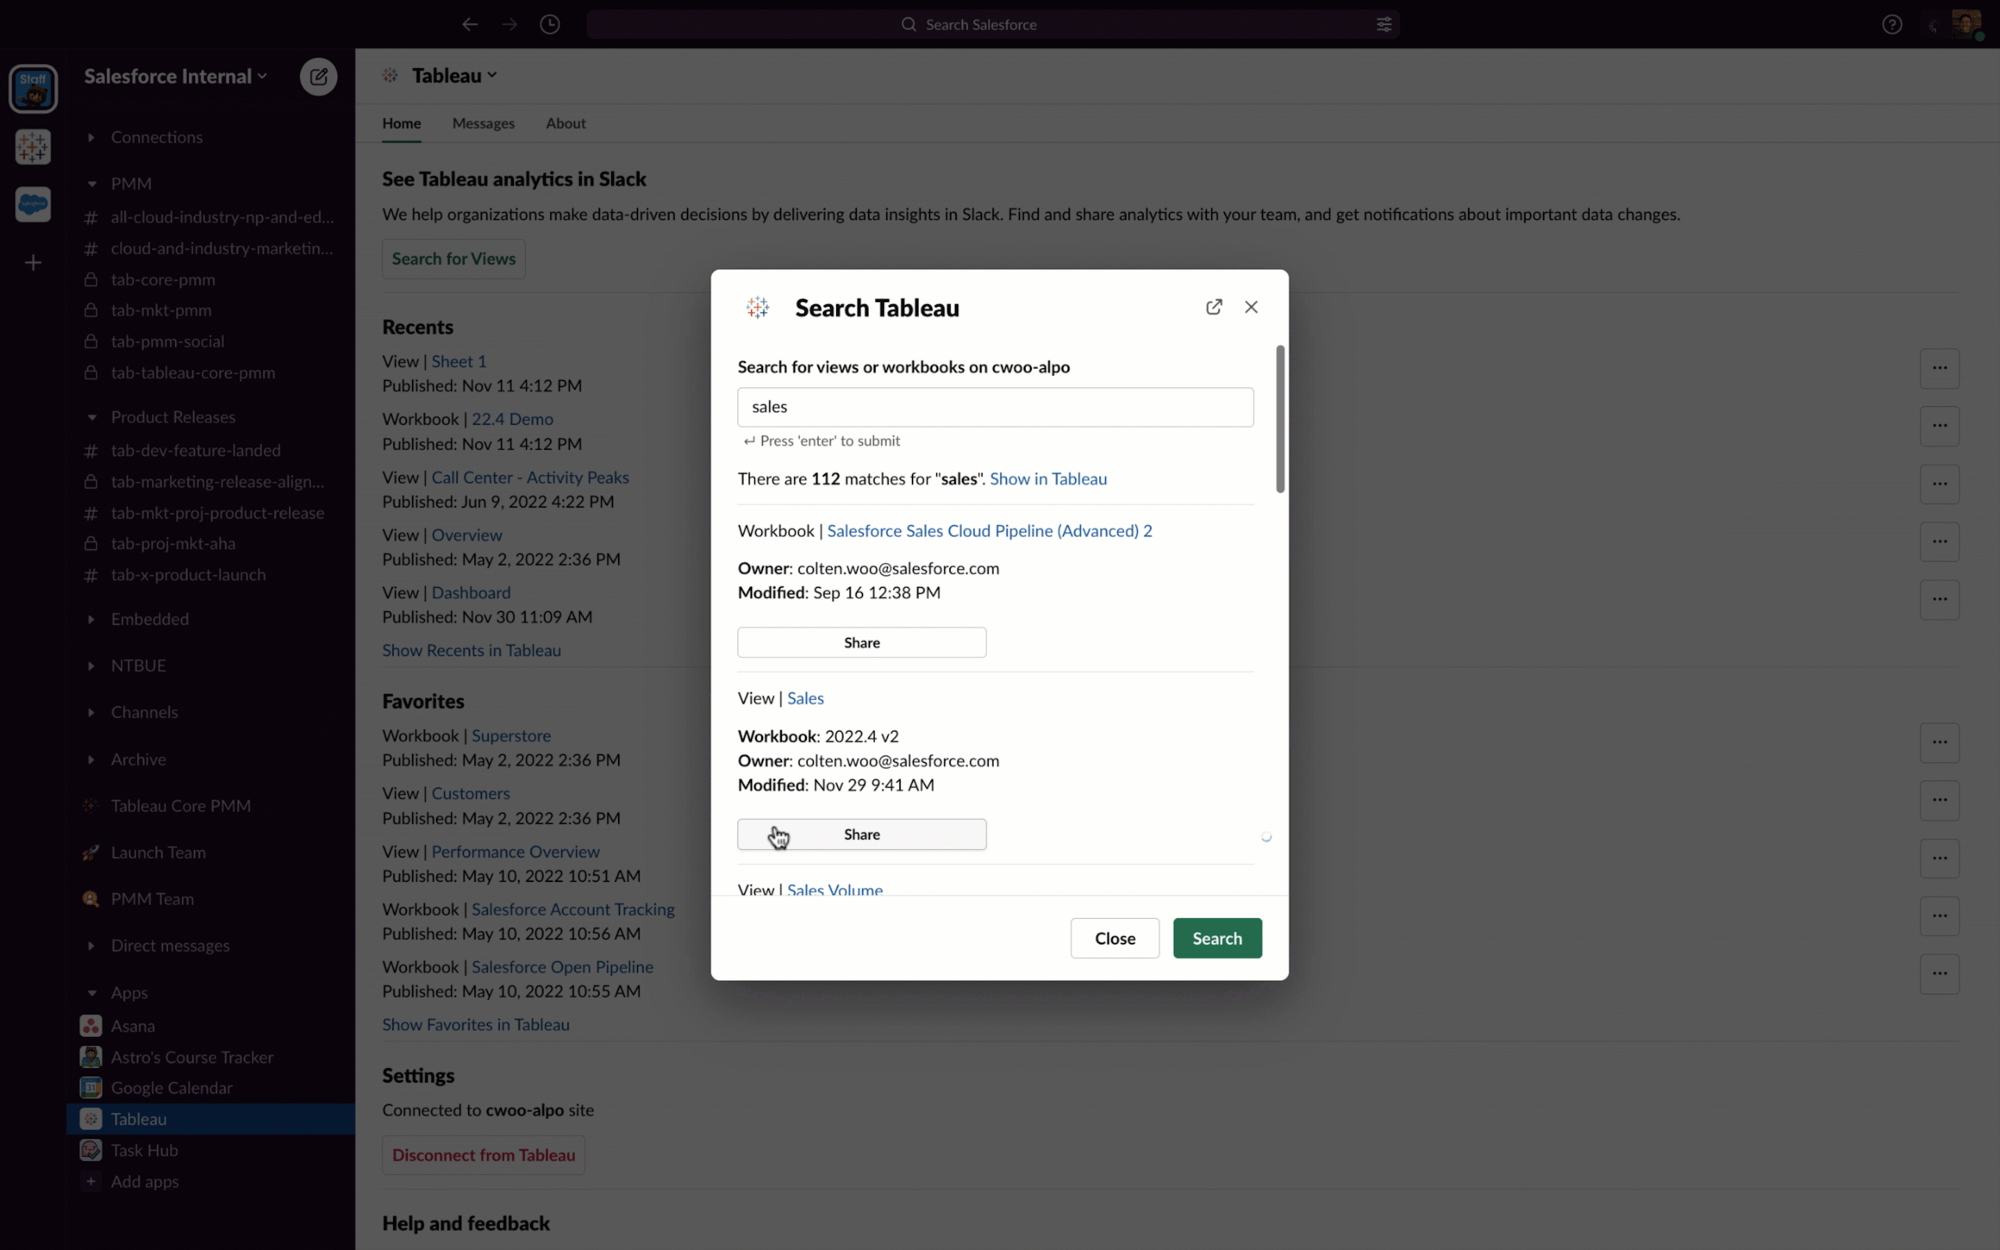
Tableau for Slack enhancements
Collaborate on insights more effectively with the Tableau for Slack app. The latest enhancements make it even easier to put data at the center of every conversation and decision. Now, you can:
- Share Tableau content with context. Links now come with previews so your team can quickly recognize–and act on–relevant information.
- Easily search for and share Tableau content in direct messages and channels.
- Get to insights faster by conveniently accessing recents and favorites from the App homepage.
*The Tableau for Slack enhancements will be available in the coming weeks.
Dynamic Axis Titles
Users can alter the title of their axis based on the value of a parameter or a single-value field with dynamic axis titles.
Identity Pools for Tableau Server
Identity Pools will enable you to branch out of the strict single identity store limitation we have in Tableau Server. An Identity Pool is the combination of a “Source of Users”, traditionally called the Identity Store and an authentication mechanism. With this feature, you will be able to add additional pools where you can have your source of users belong to a local identity store and have them authenticate with OpenID Connect for modern authentication. This added flexibility will be particularly helpful for organizations that have a set of external users that need access to Tableau that they are not able to invite to their corporate Active Directory. More information here.
User Attribute Functions (UAFs)
User attribute functions (UAFs) are brand-new user functions - UserAttribute() and UserAttributeIncludes() - that let you use users attributes defined during the Connected Apps login flow in calculations. These functions can be used to create data source filters for row-level security beyond username and group (for example, department, region, etc.), enabling you to tailor any user's data access in embedded scenarios.

Non-Safari Browser Support for Mobile Authentication
Admins can now specify a browser–such as Microsoft Edge – for authentication to handle Conditional Access checks. With the proper configurations for Tableau Mobile and your Microsoft Intune environment, admins can override the default browser used for authentication.
Tableau 2022.4
Tableau 2022.4 delivers new capabilities to save you time and effort. Highlights include Tableau External Actions, Usage Metrics, ideas from the Tableau Community, and more.
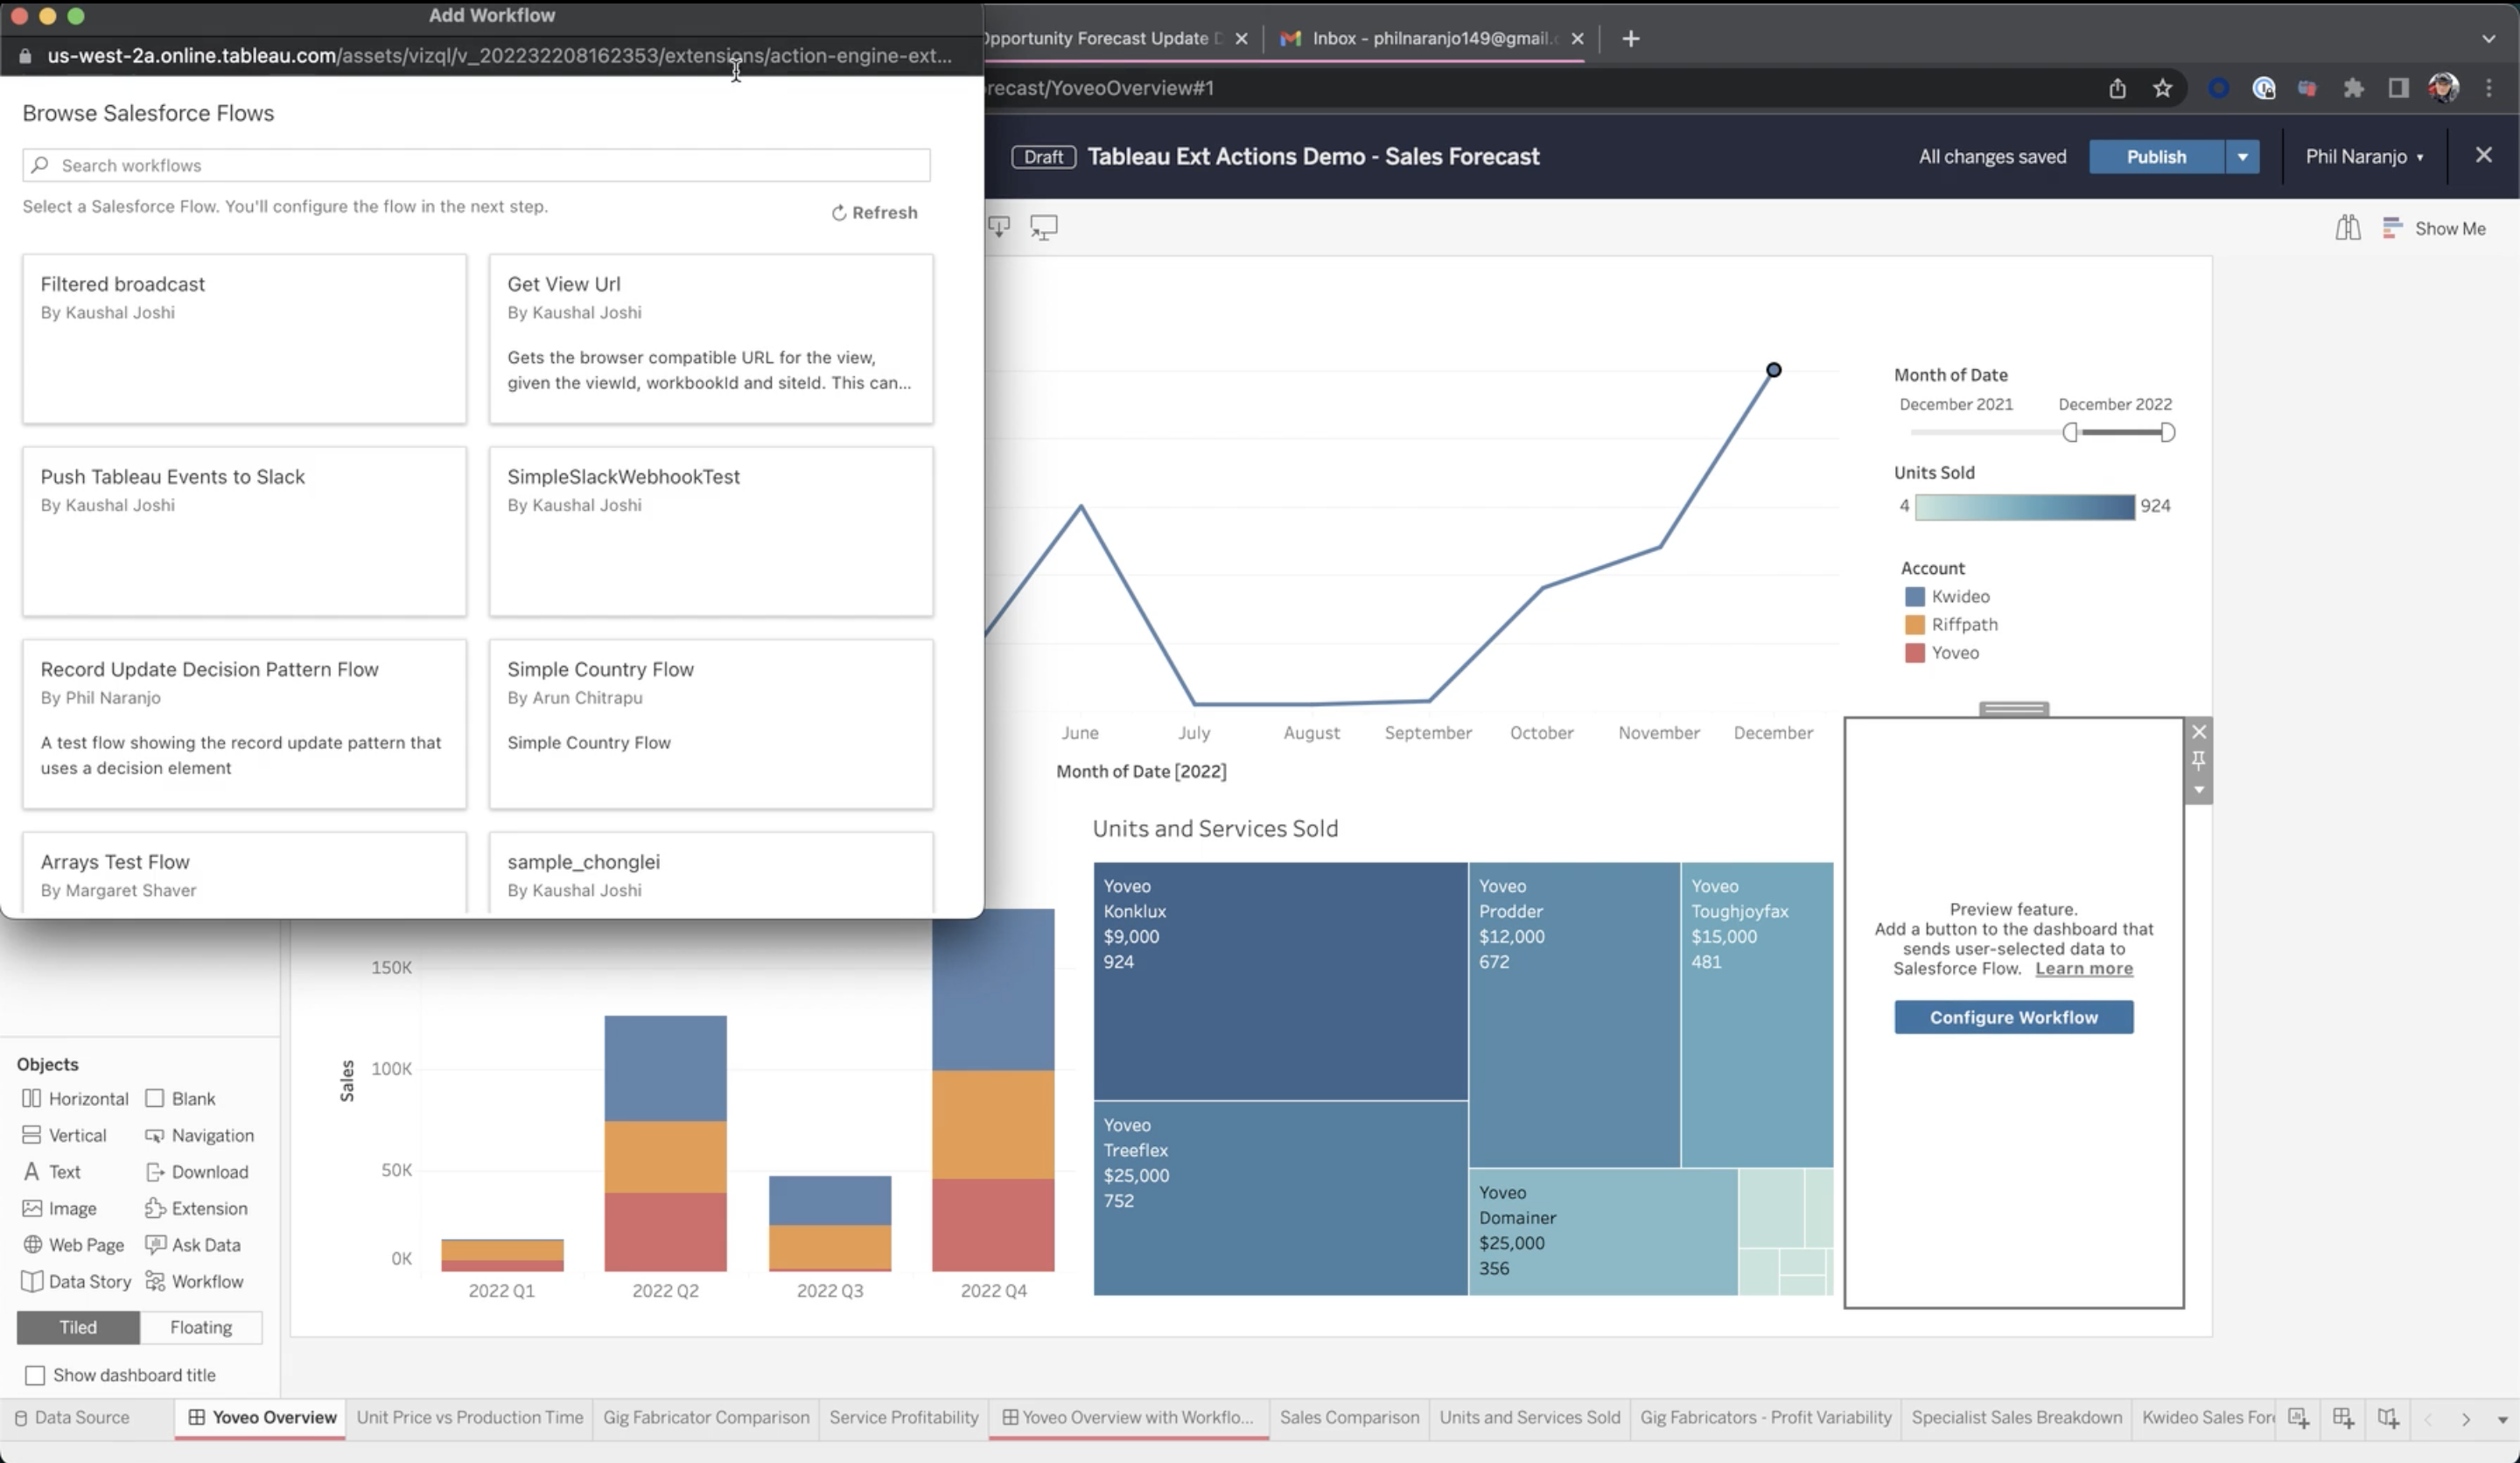
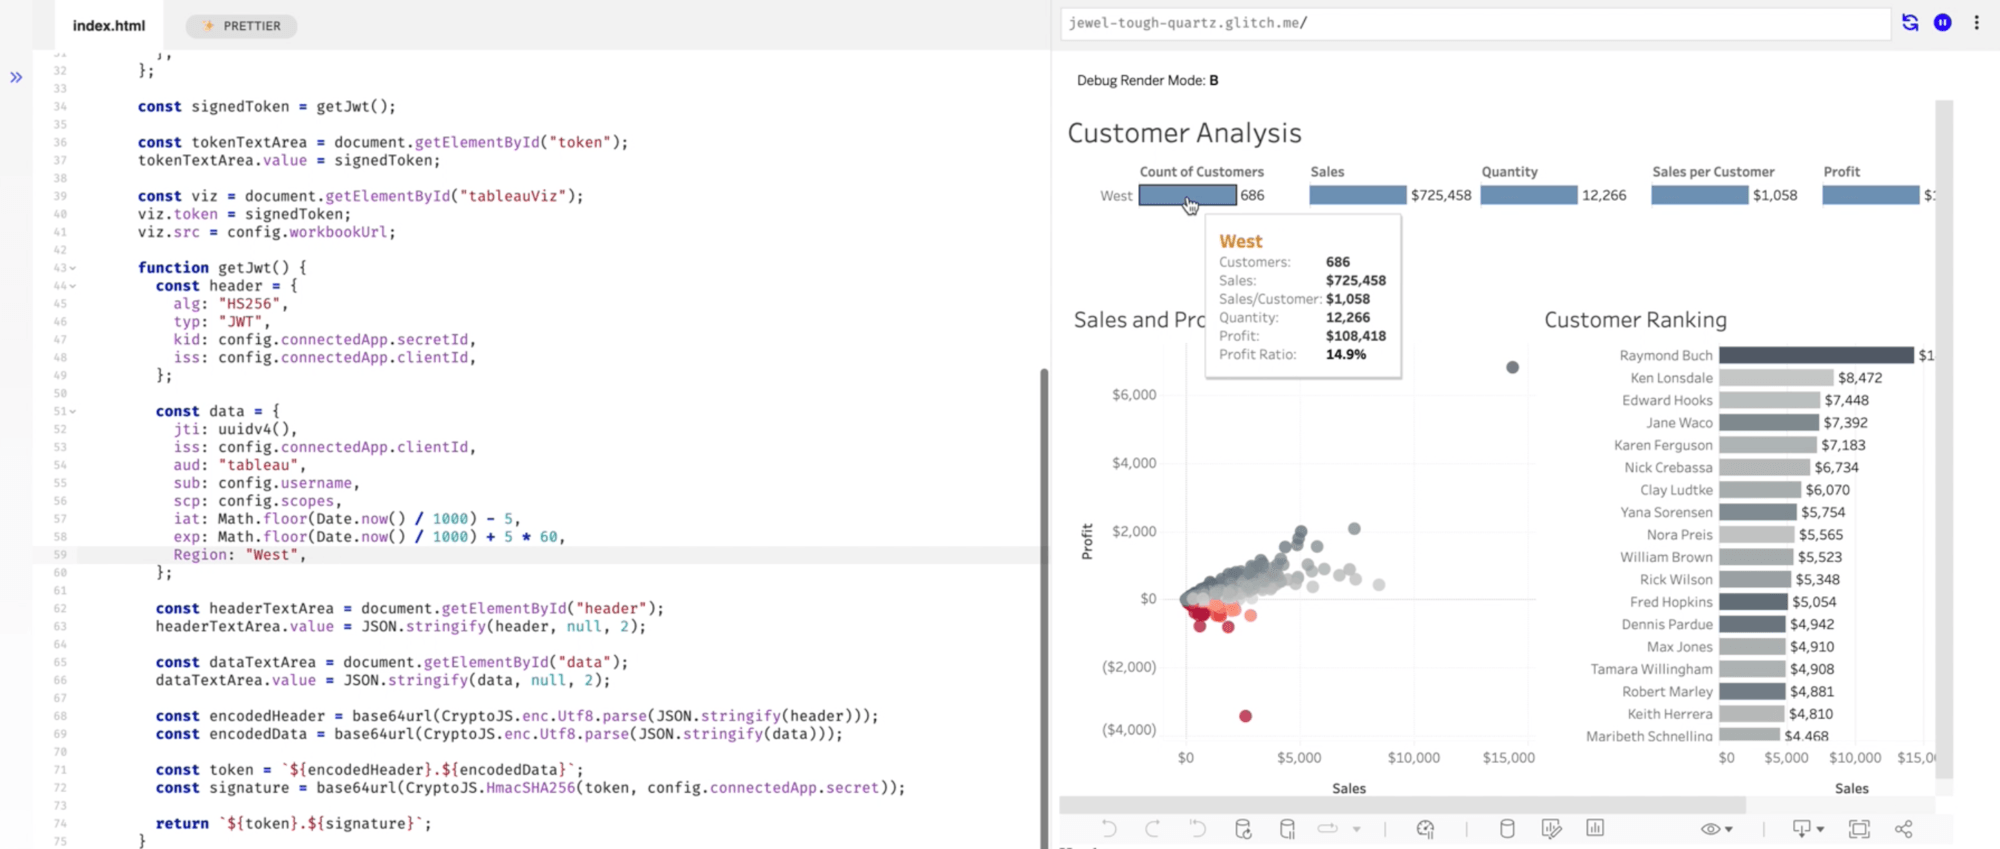
Tableau External Actions
Tableau External Actions delivers a native integration with Salesforce Flow to help automate business processes, saving you time and money. By connecting your dashboards to Salesforce, you can make decisions in context and run flows without leaving Tableau. Now, you can escalate a case, send a customer invoice, and more with the click of a button.
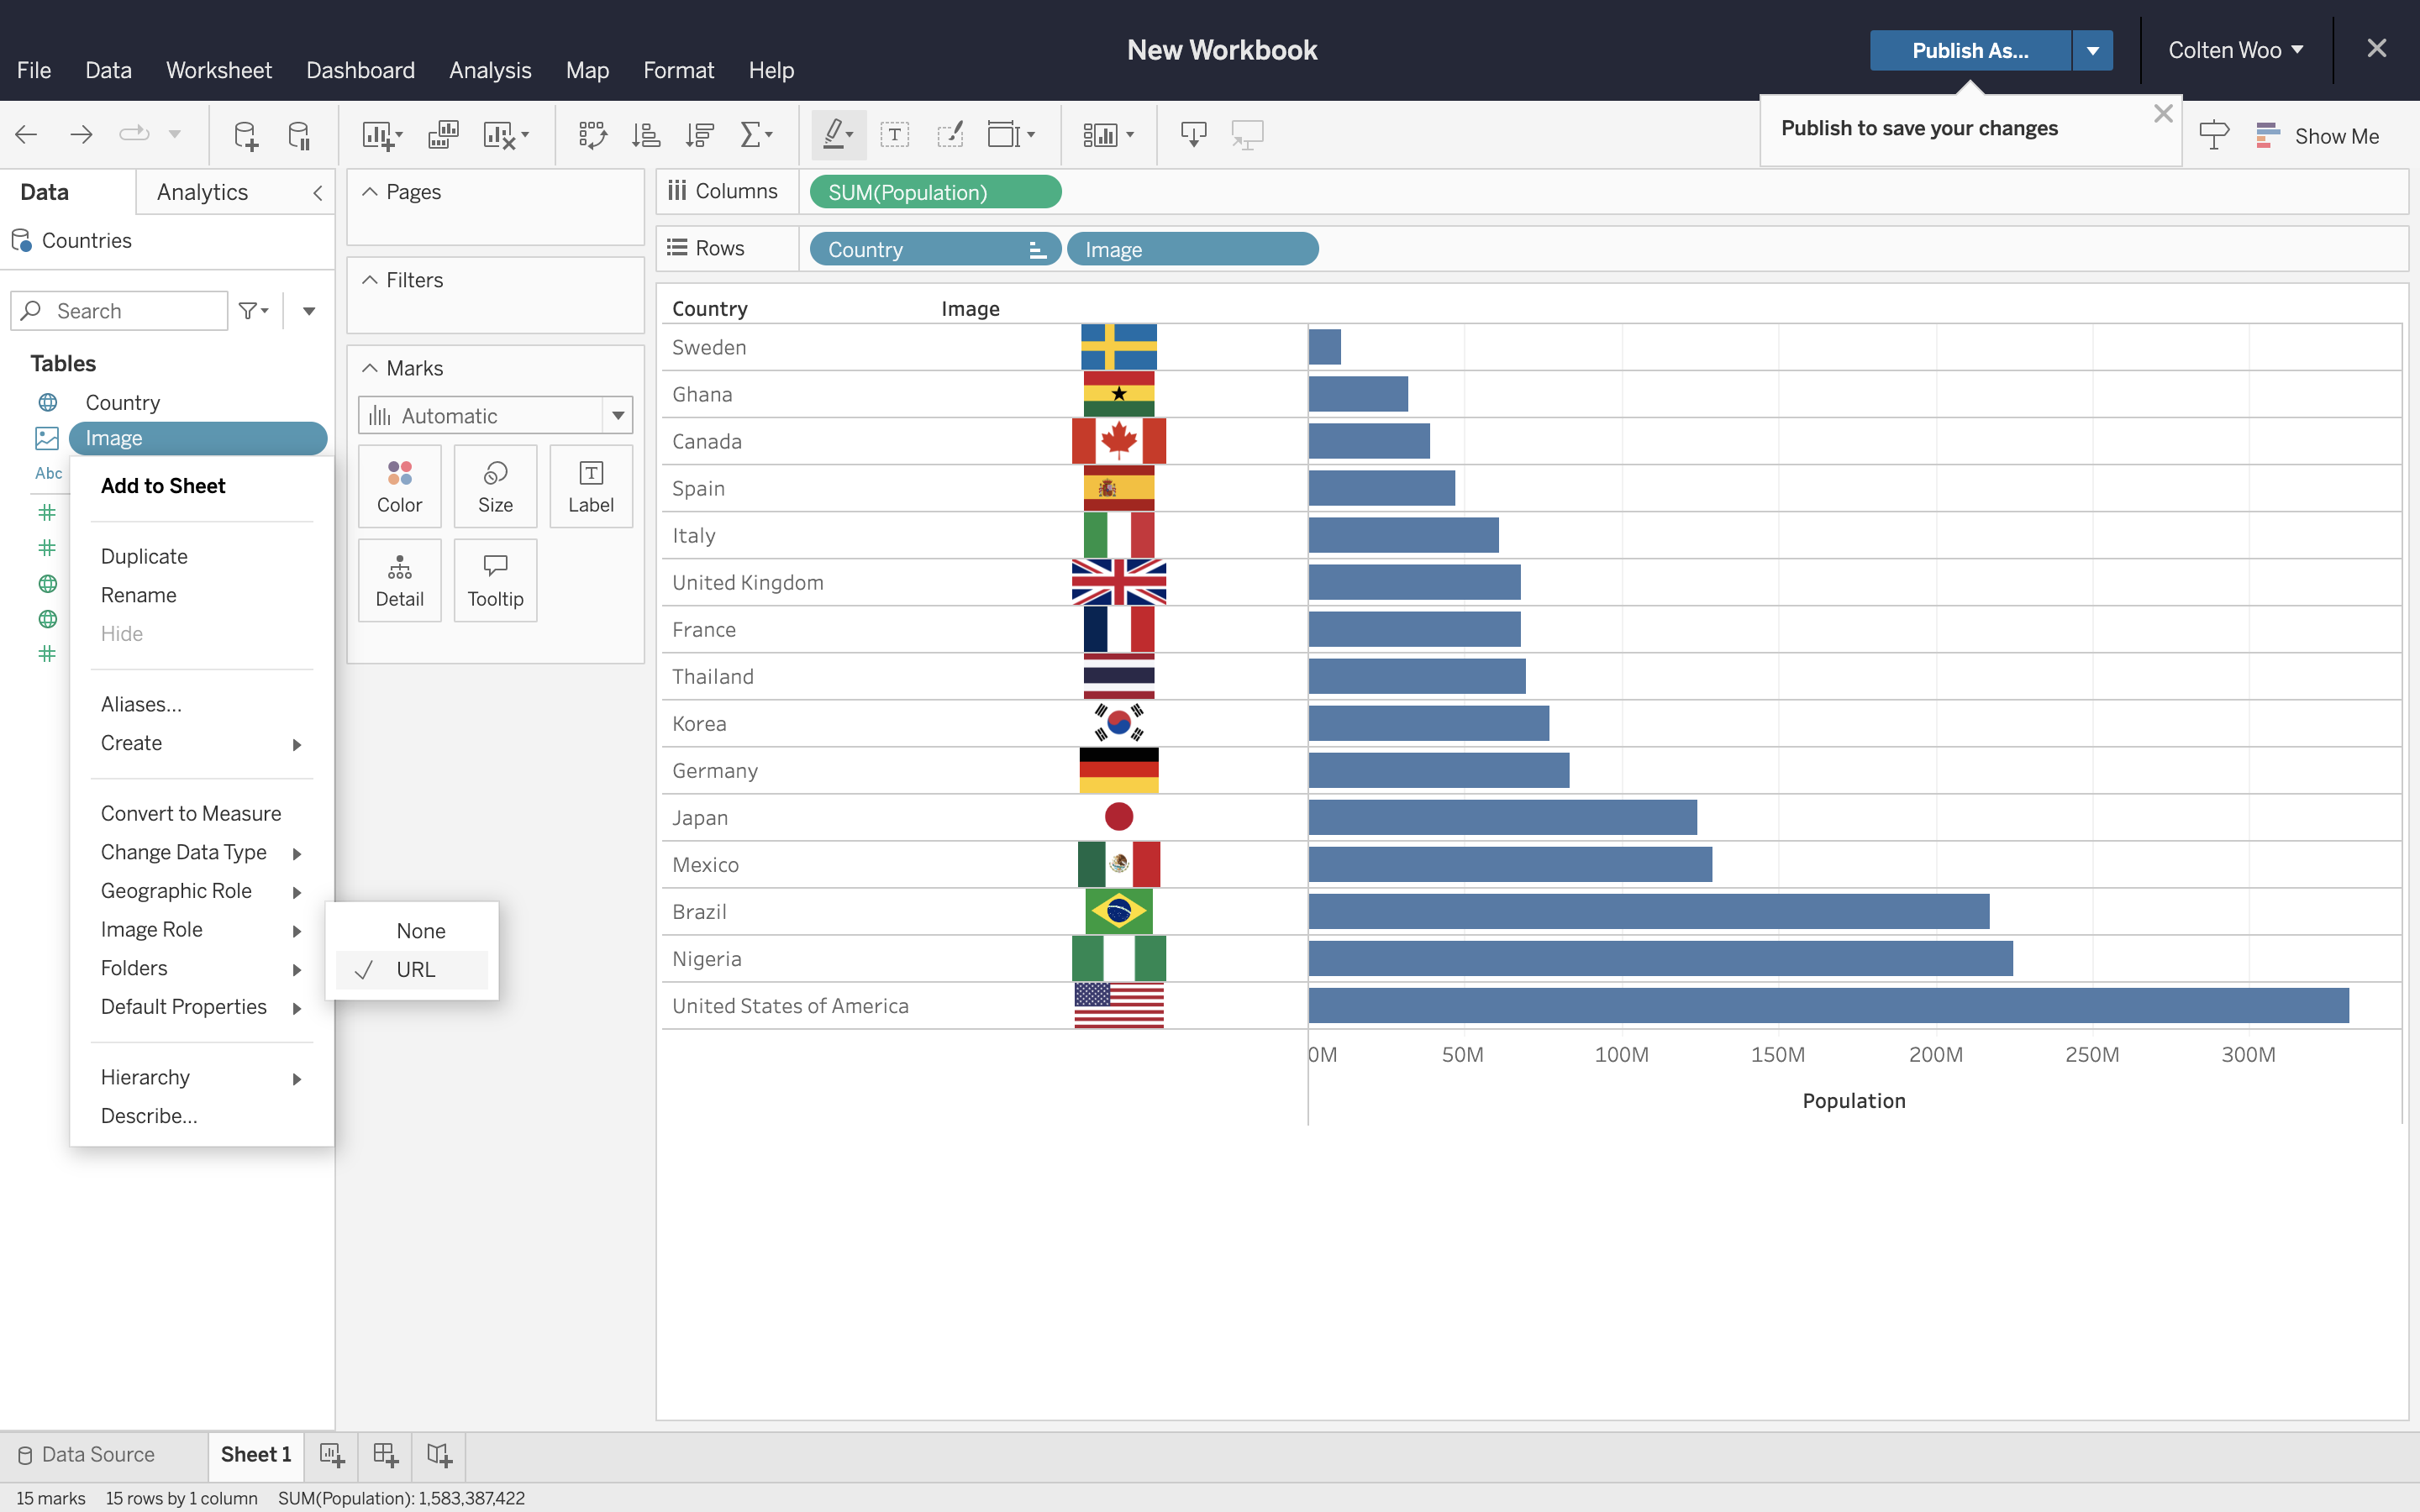
Image Role
Improve insight comprehension and help end-users better connect to and understand visualizations using Image Role. Image Role is a new field semantic that offers a scalable and automated way to bring image assets into Tableau. Tableau can now dynamically map images to links in your data and encode them as exportable row or column headers. This new capability makes it possible to manage image assets externally to prevent workbook sizes from becoming too large to maintain and share. More information here.
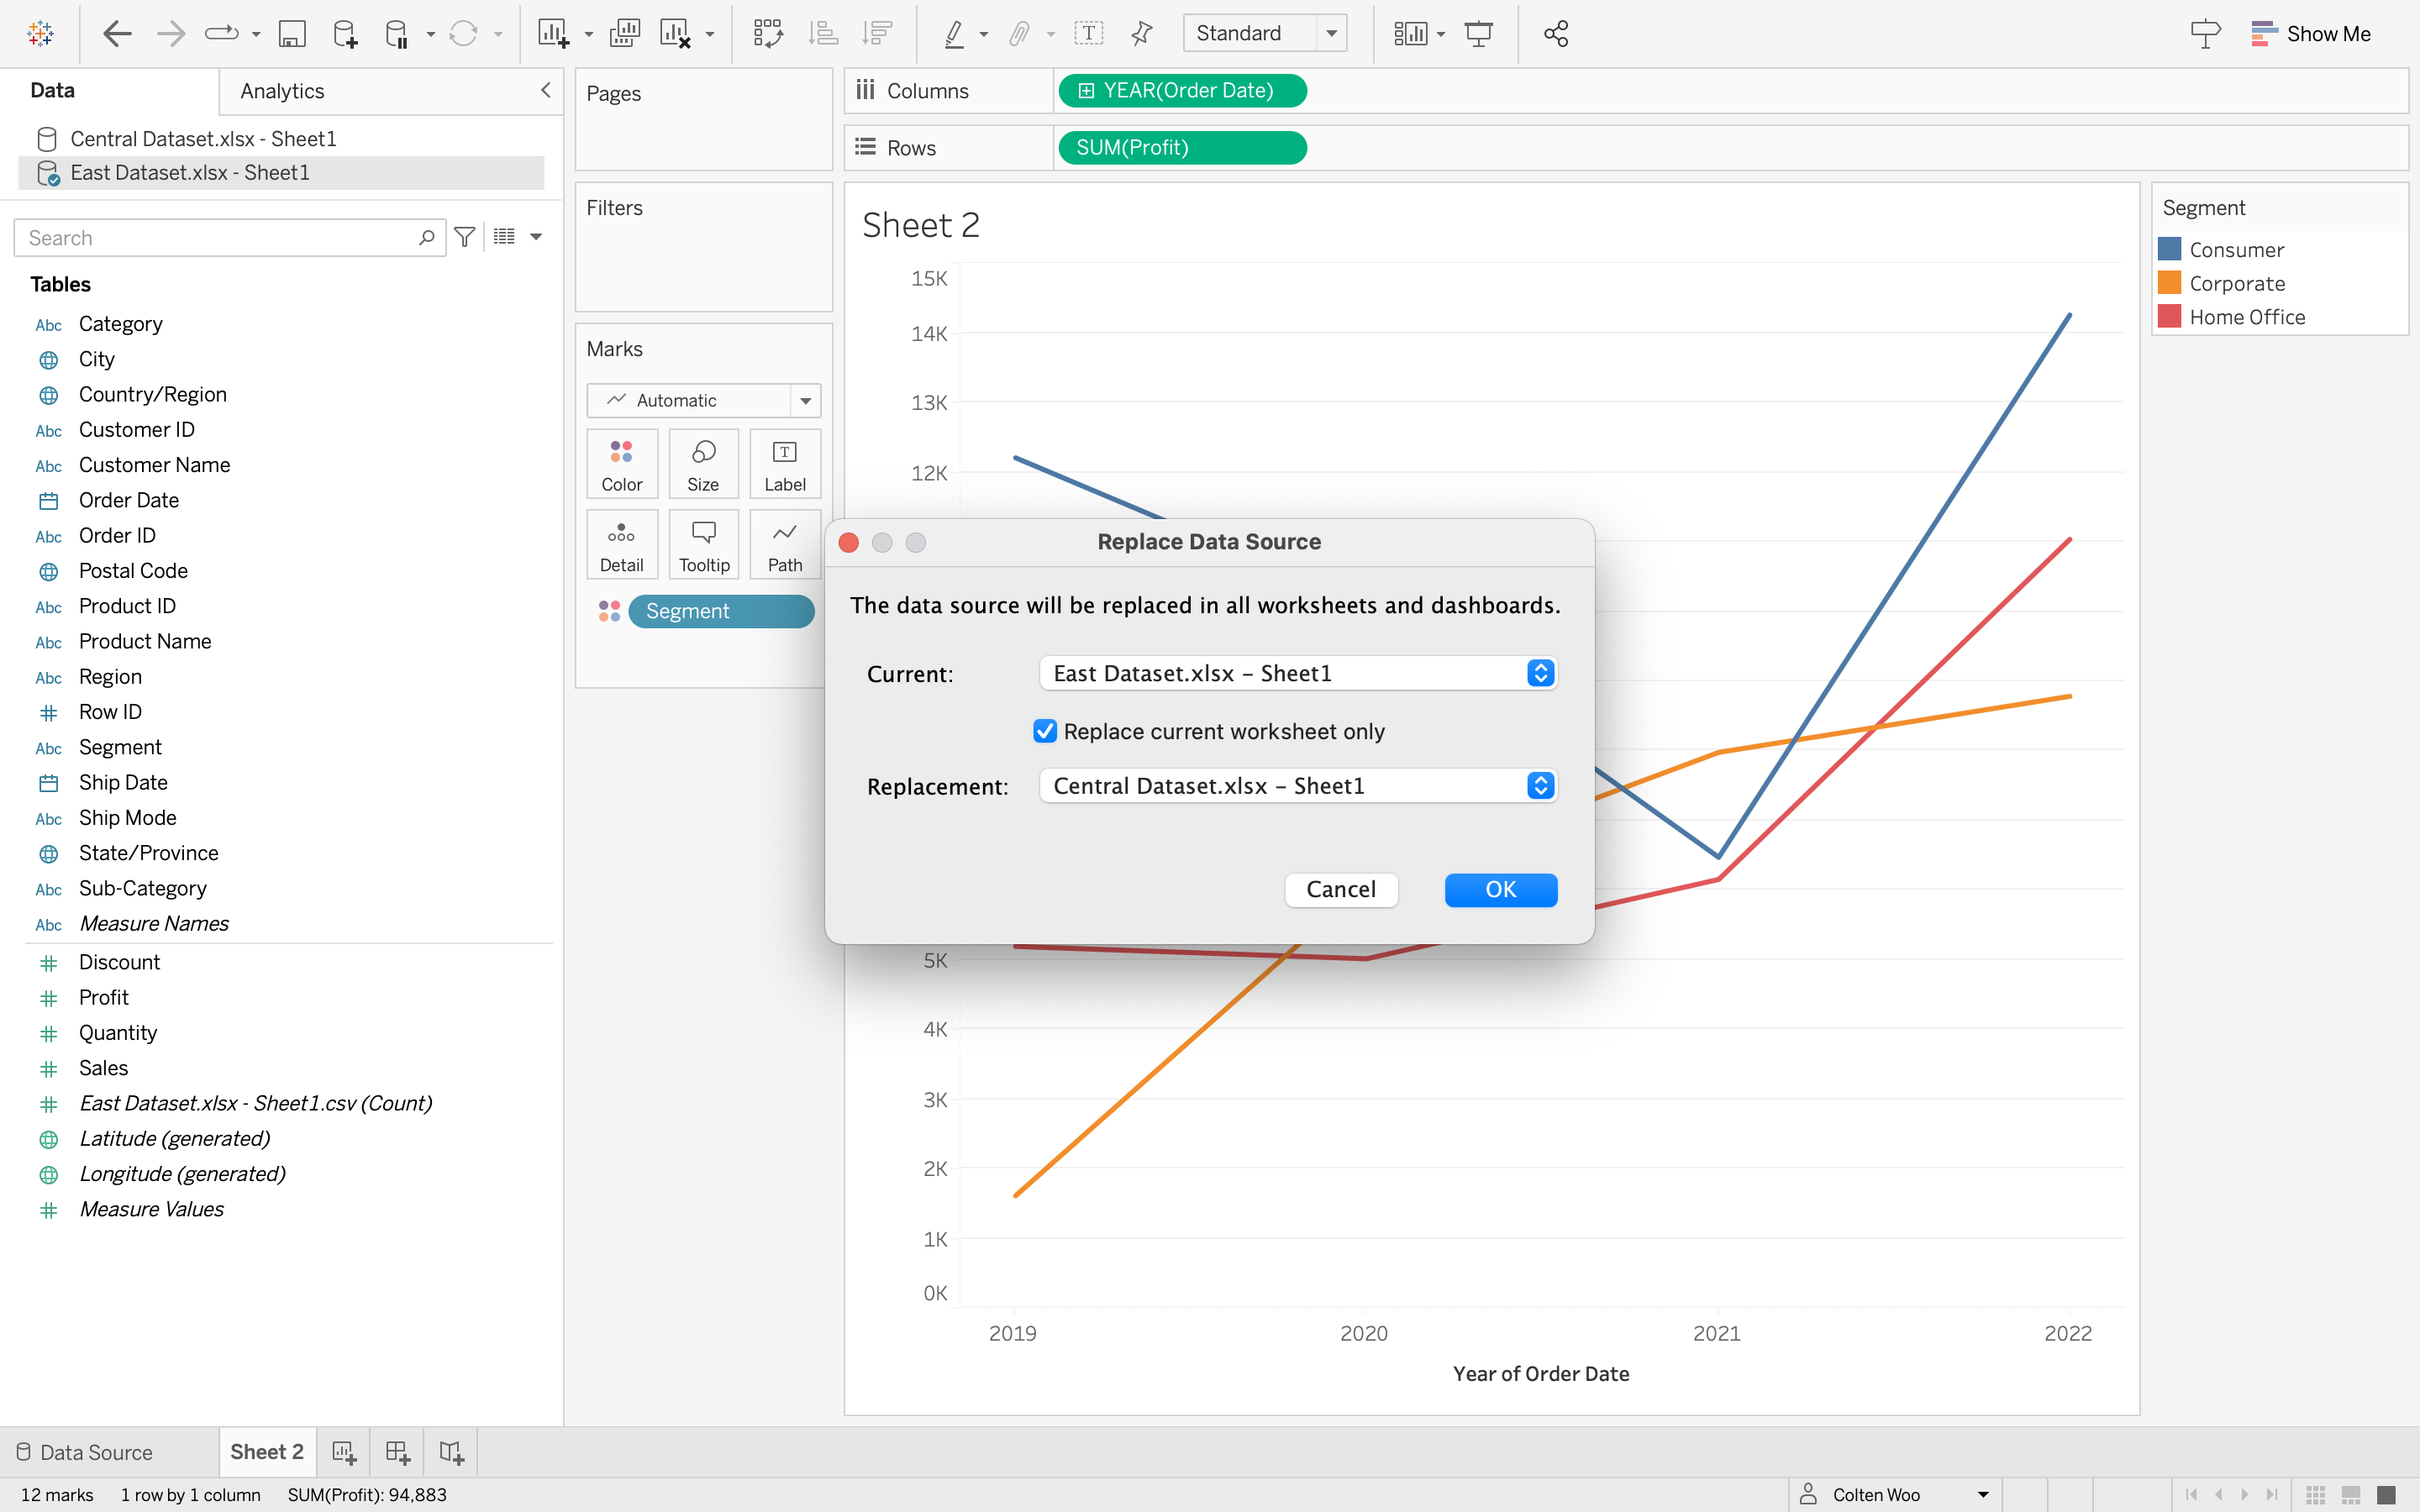
Replace datasource per sheet
Selectively replace data sources on a worksheet-level without complicated workarounds. Previously, replacing data sources would apply to all worksheets in the workbook using the datasource. Now, you have greater control and can select to apply data source changes to only the current worksheet.
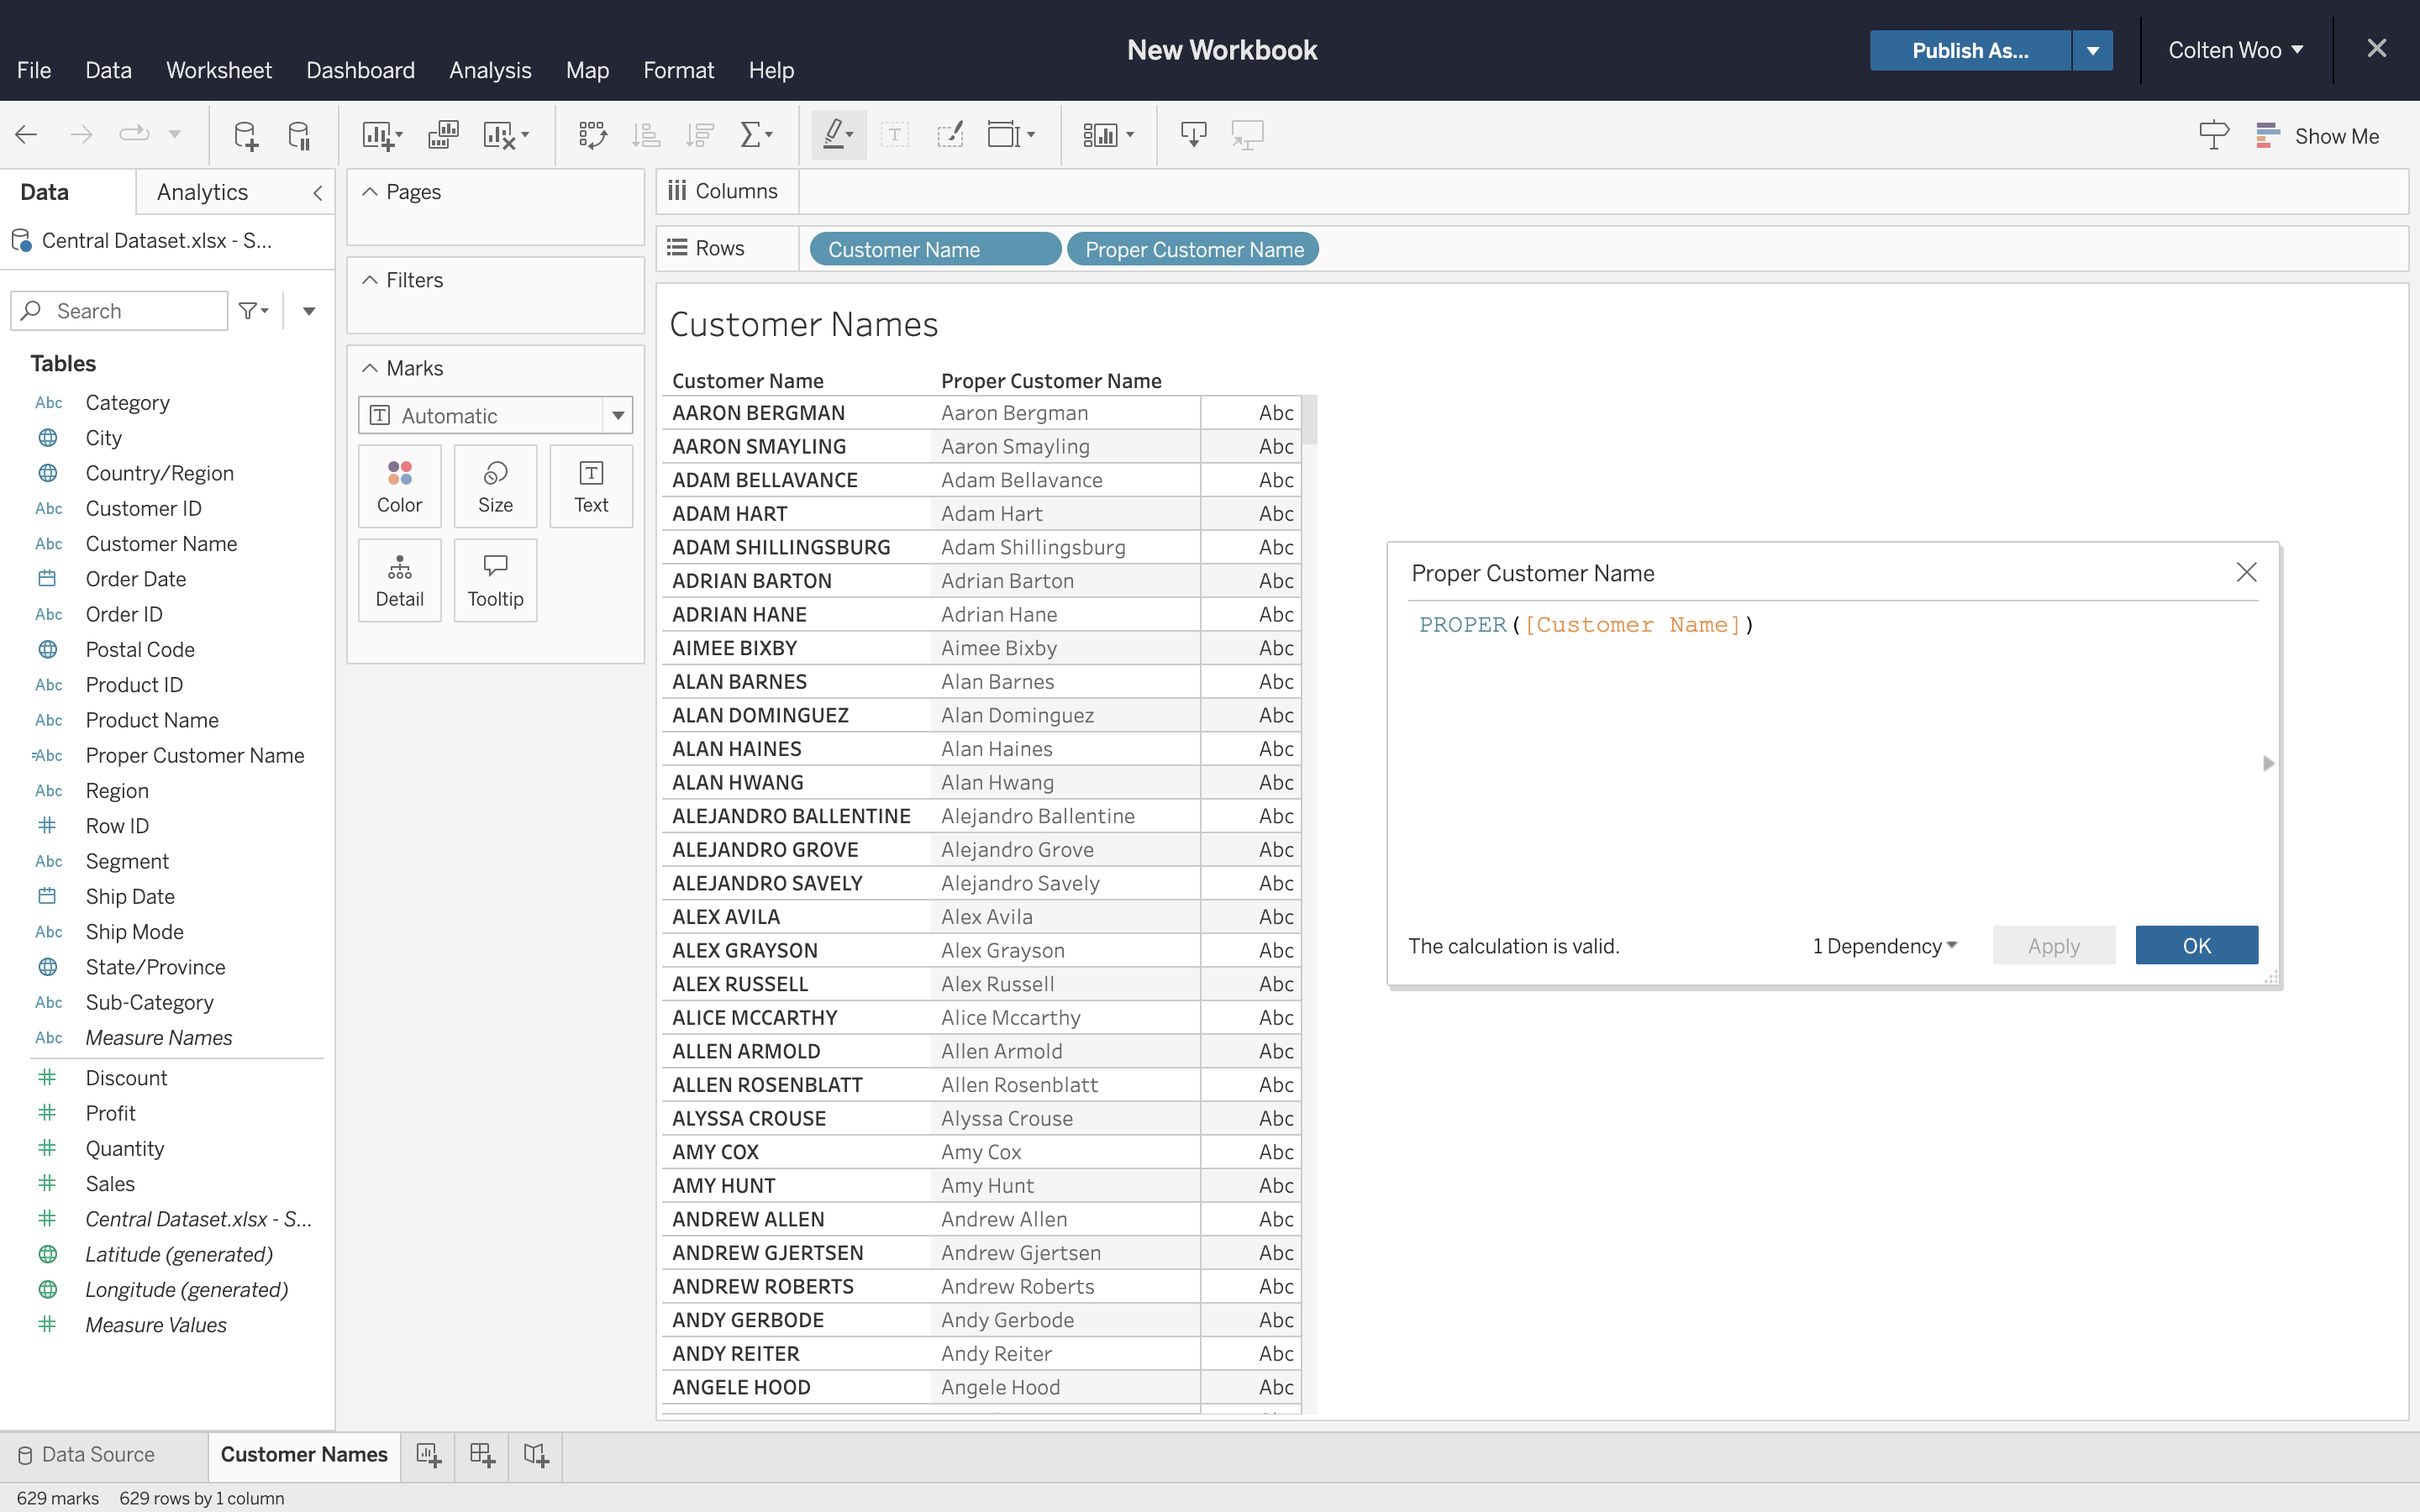
‘PROPER()’ string function
Format string fields using the ‘PROPER( )’ function instead of complex workaround calculations. This new function converts strings to proper case. The first letter of a text string and any letters following non-letter characters are capitalized, while the rest are converted to lowercase.
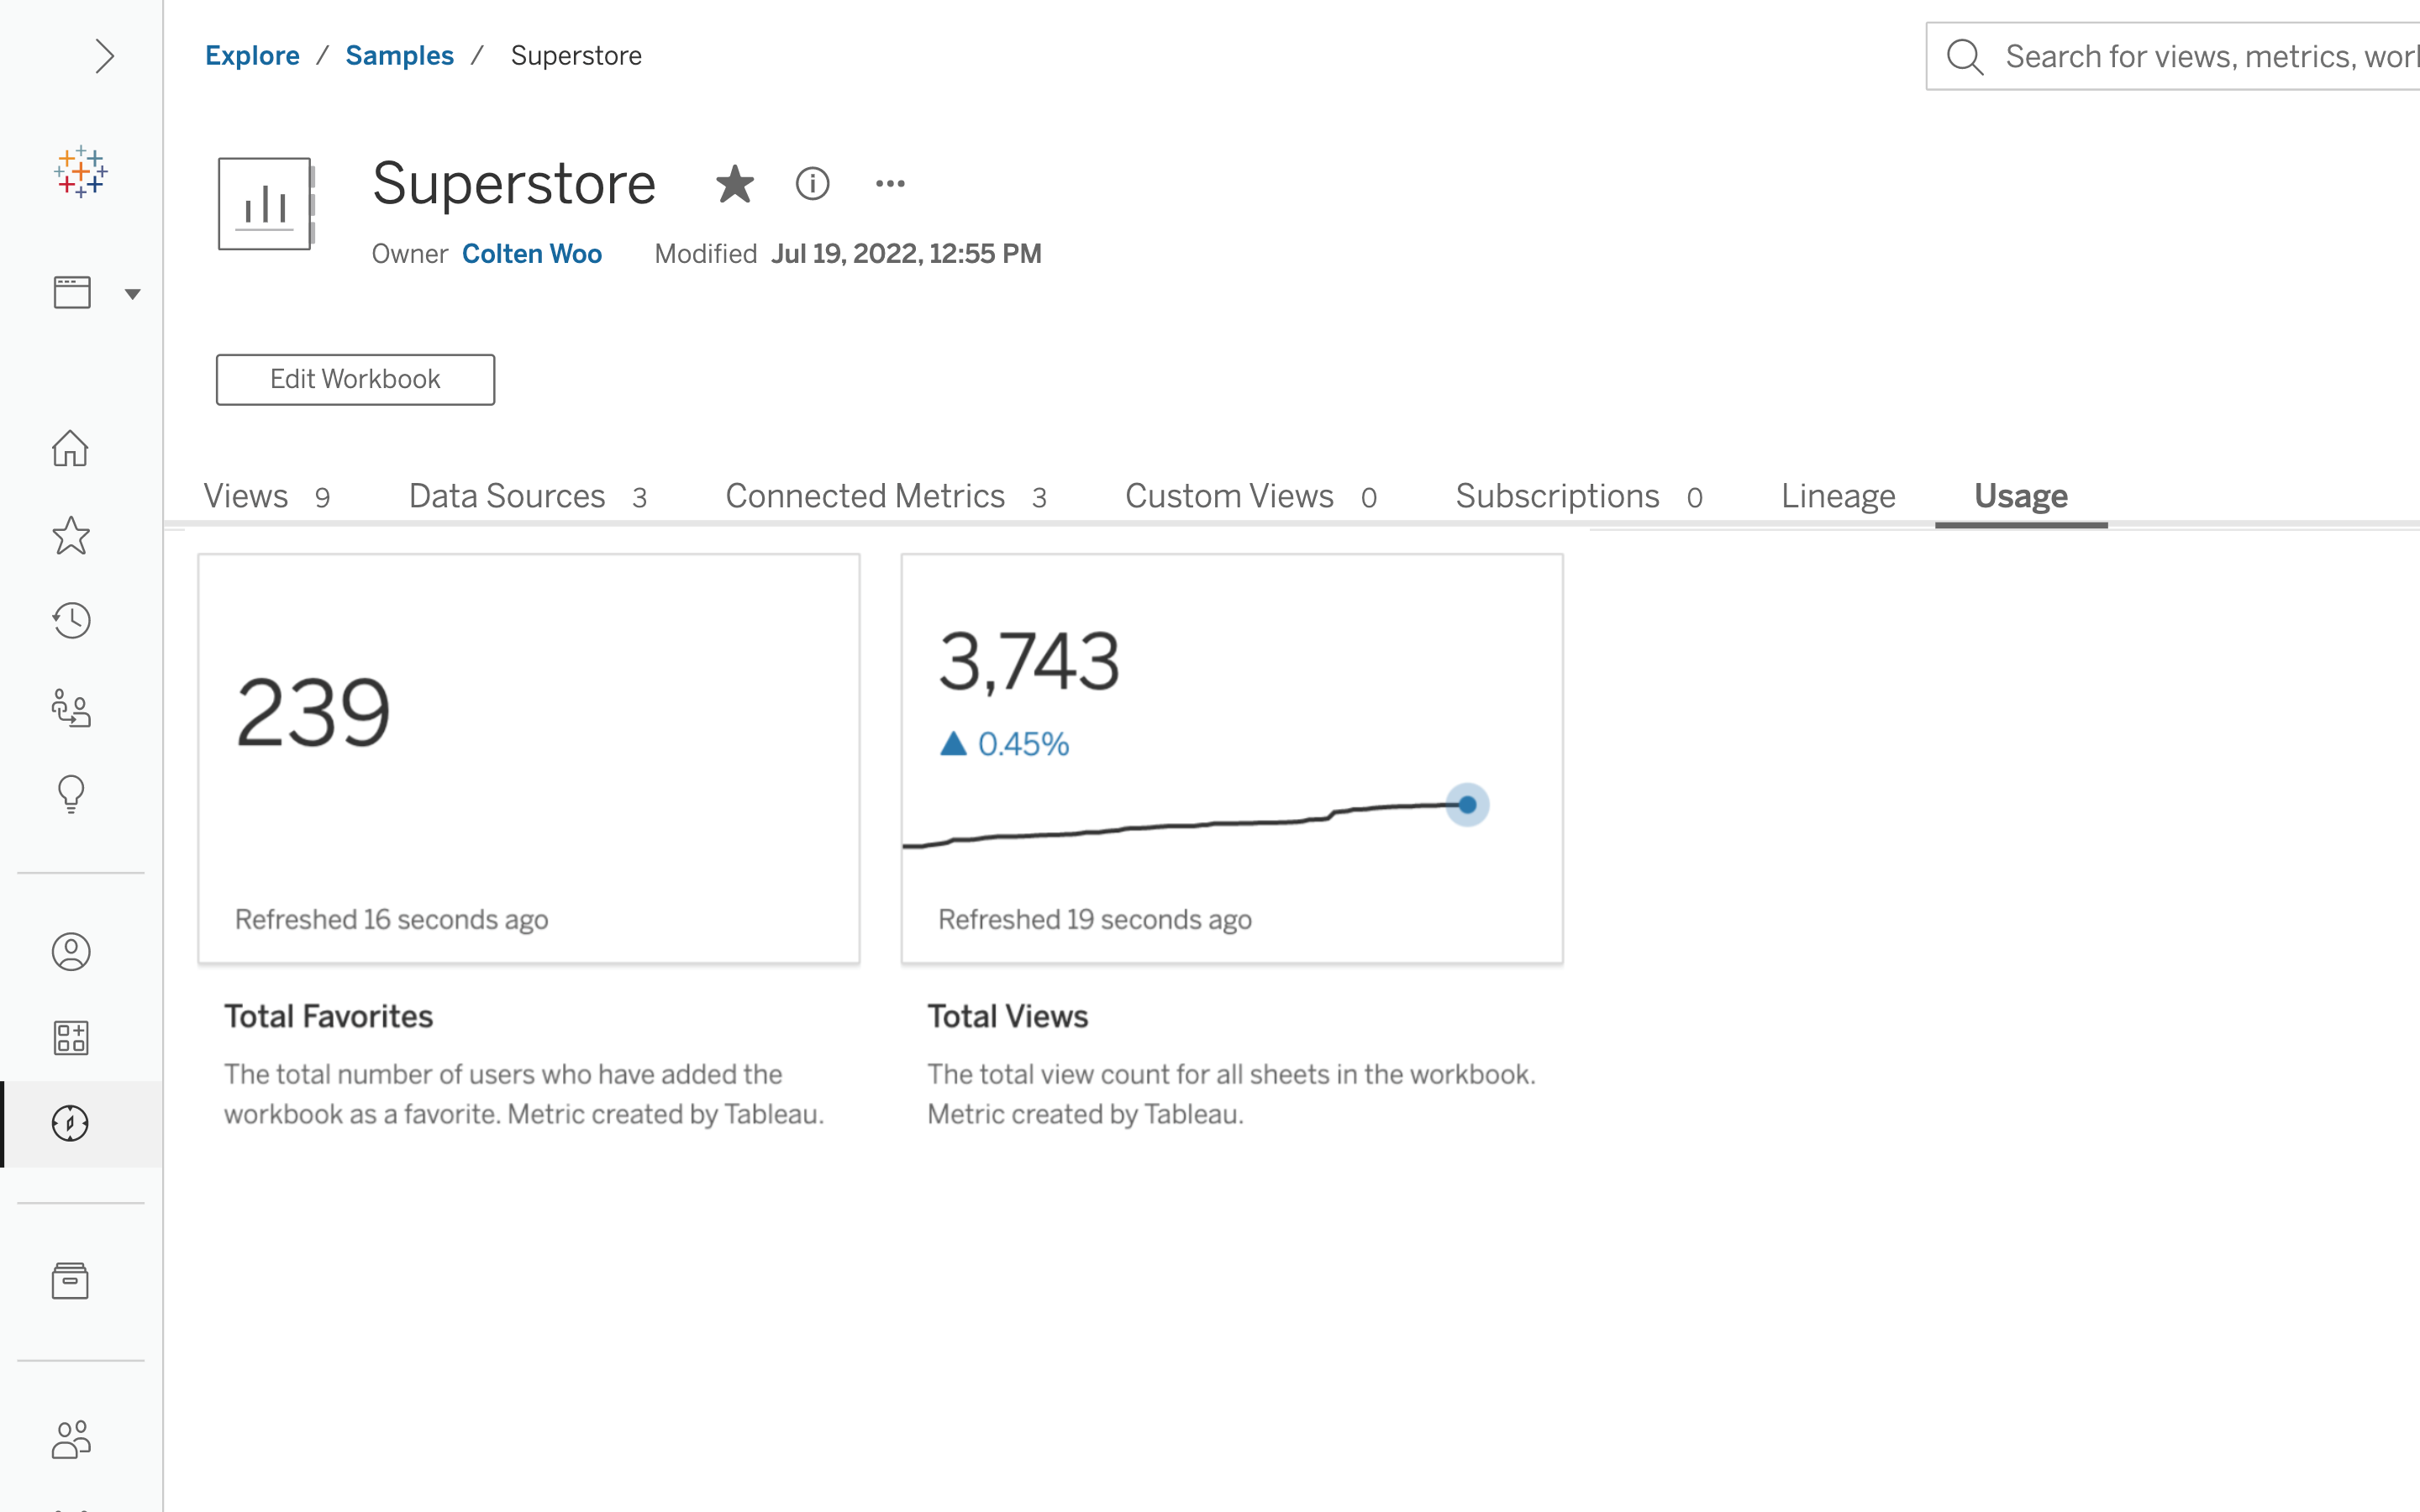
Usage Metrics
Total views and favorites are displayed as Metrics in the new Usage tab. With these insights, analysts can better understand what workbooks are popular so they can build content that resonates with their audience. Viewers can leverage Usage Metrics to validate that the content is widely used and trustworthy.
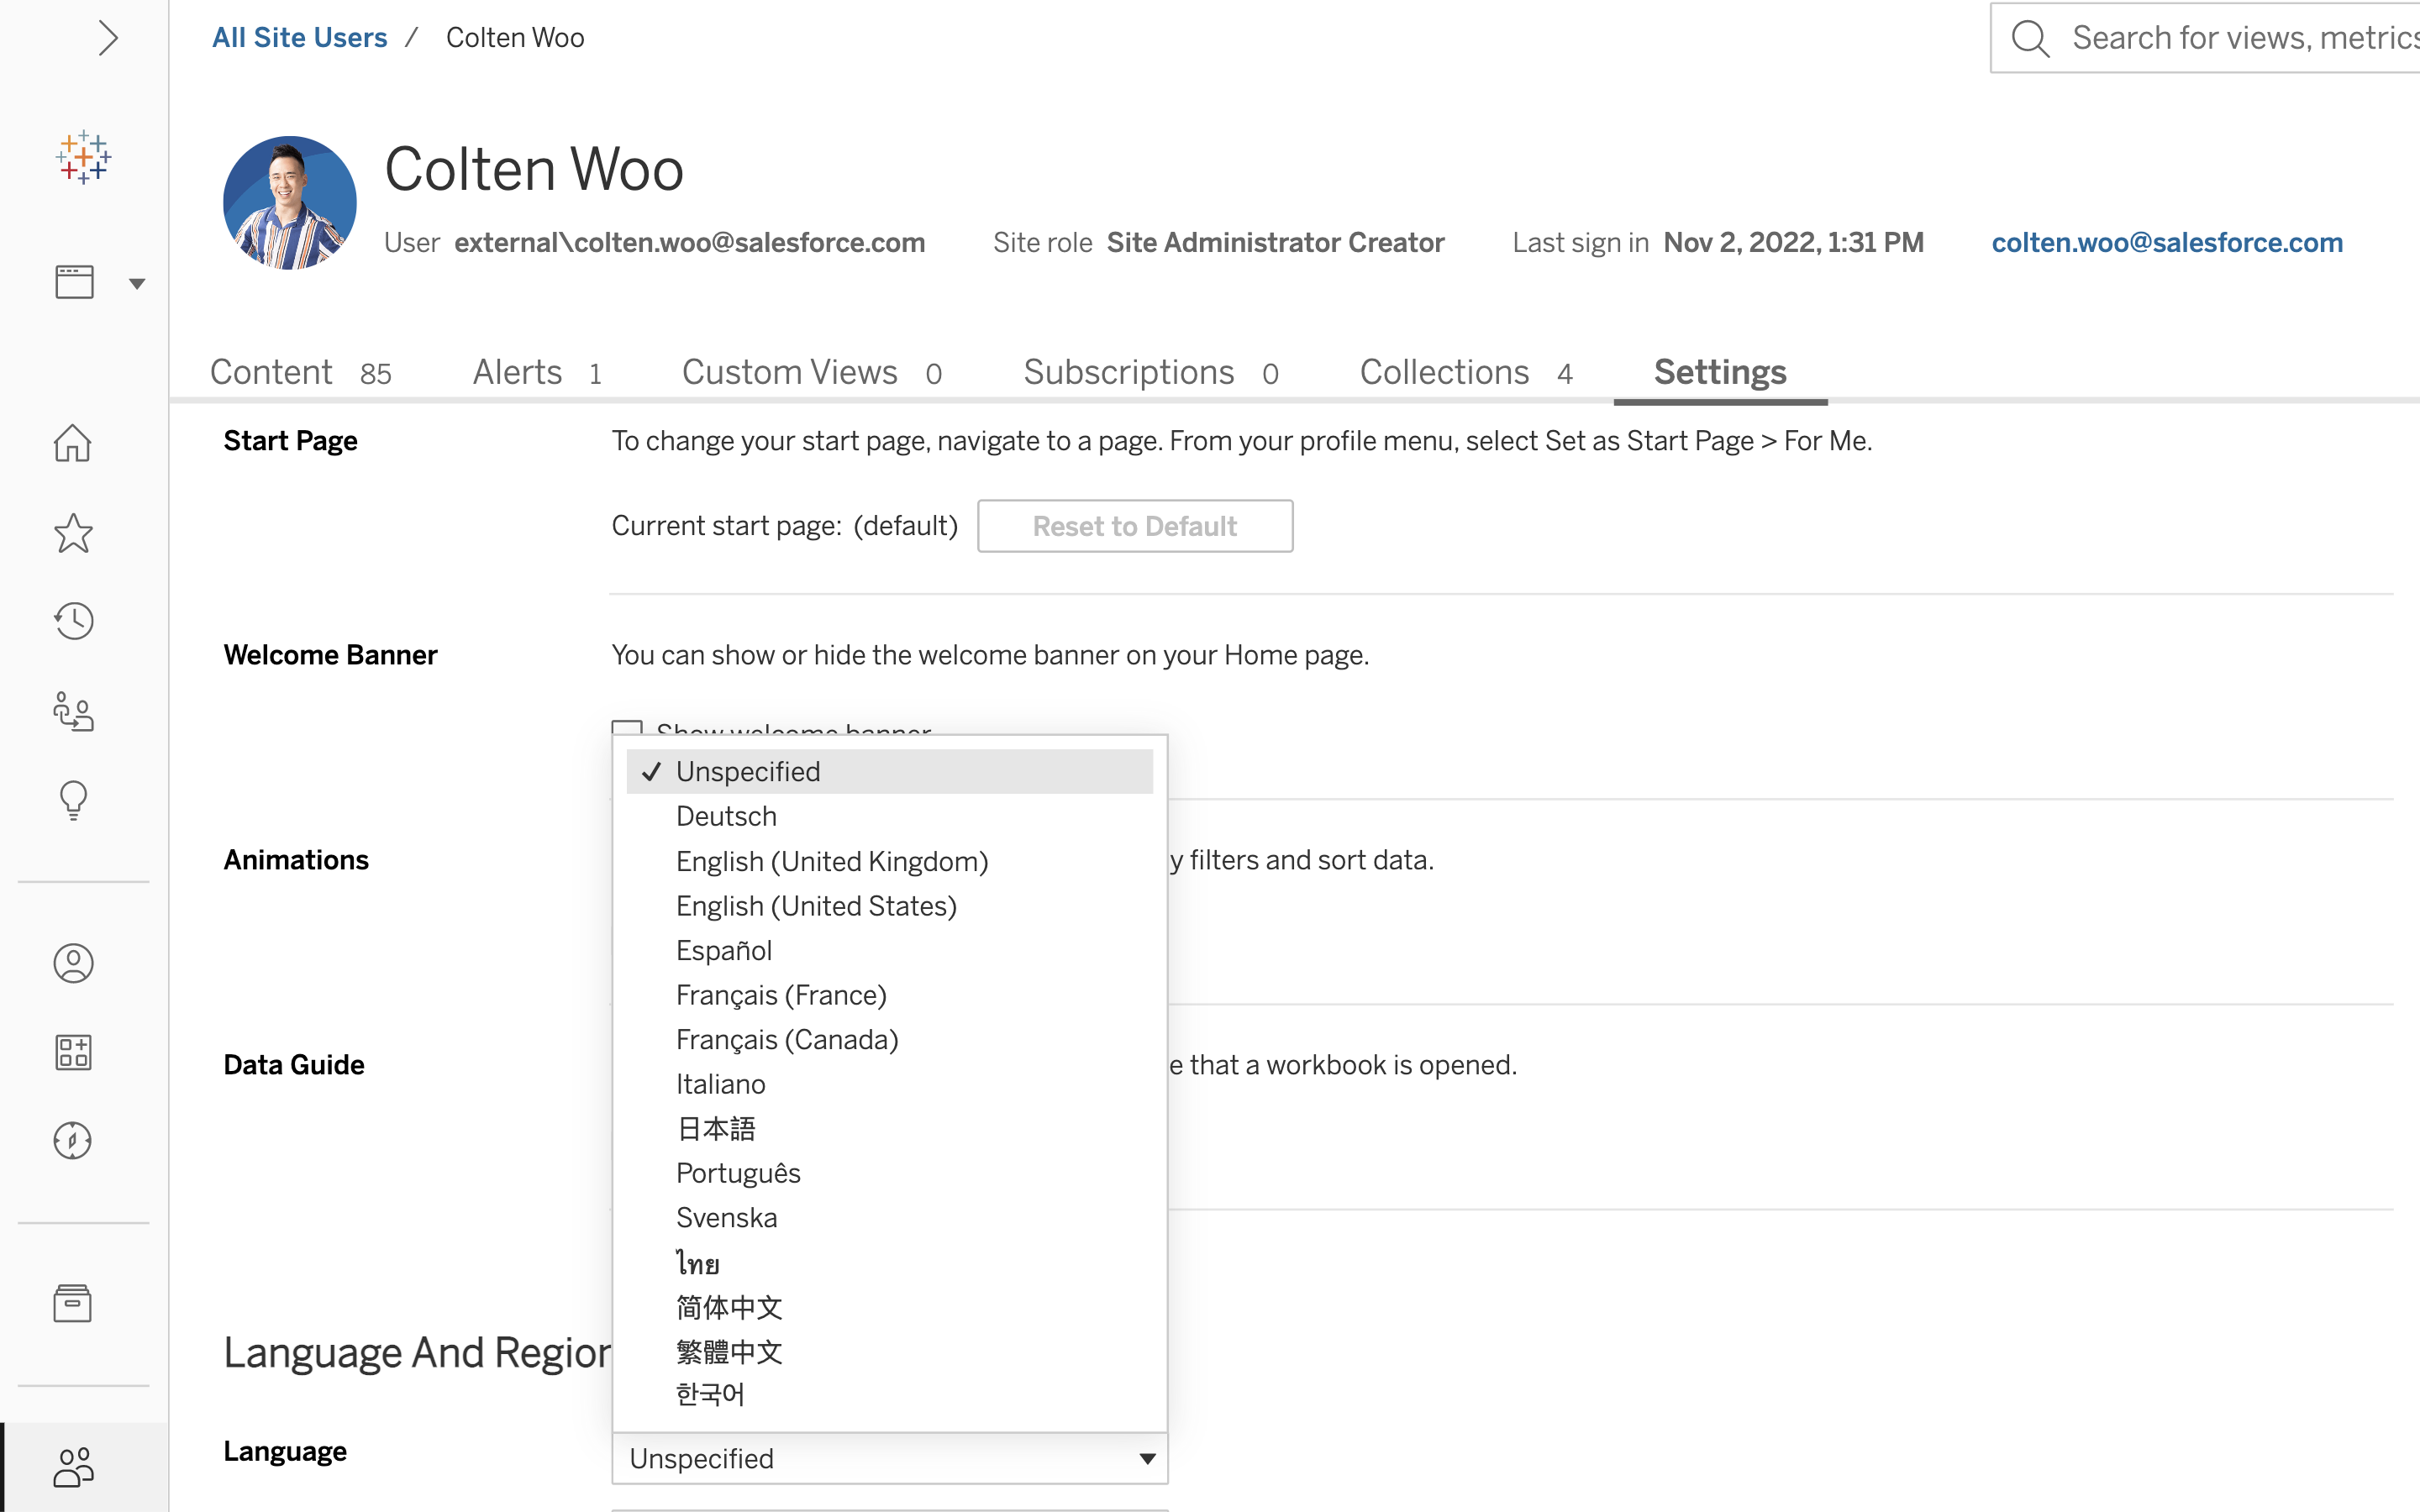
Swedish & Thai language support
See and understand data in your preferred language. Tableau has expanded language options to include Thai and Swedish.
Tableau 2022.3
Tableau 2022.3 brings new capabilities that help you easily unlock insights about your data at scale. Highlights include Data Guide, Table Extensions, dynamic zone visibility, and more.
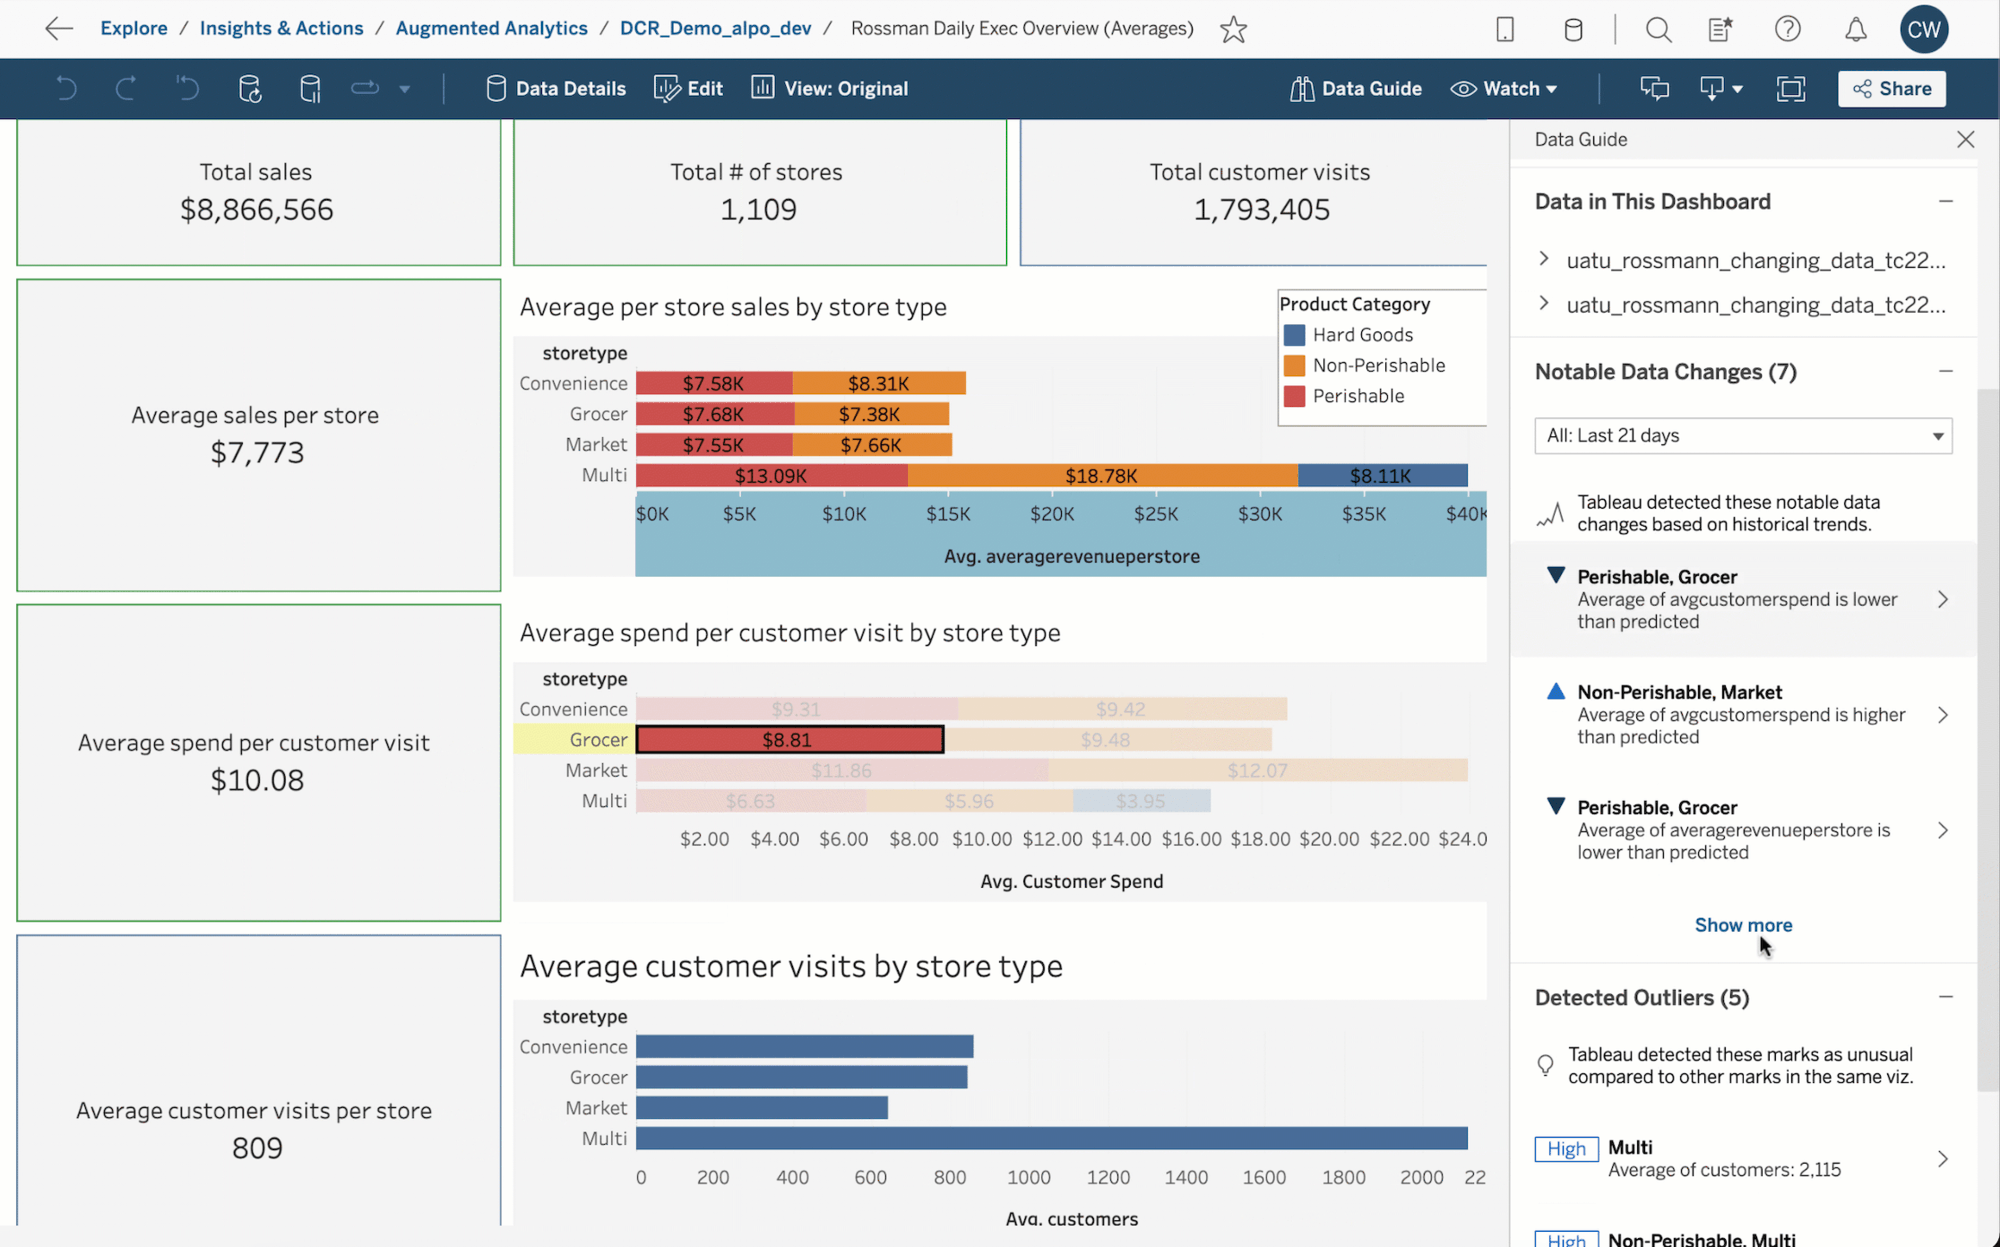
Data Guide
Data Guide is a new pane that provides helpful information about a dashboard and the data behind it. With Data Guide, you can understand if the data can answer your questions, build trust that the data is accurate, and establish confidence in your understanding of the viz. This feature makes it even easier to find data related to the selected viz, dashboard, marks, and important information like outliers and trends in your data. Data Guide also introduces Explain the which Viz scans your dashboards for outlier measures and potential key drivers behind them. This pane is available on Tableau Server, Tableau Cloud and Tableau Desktop. More information here.
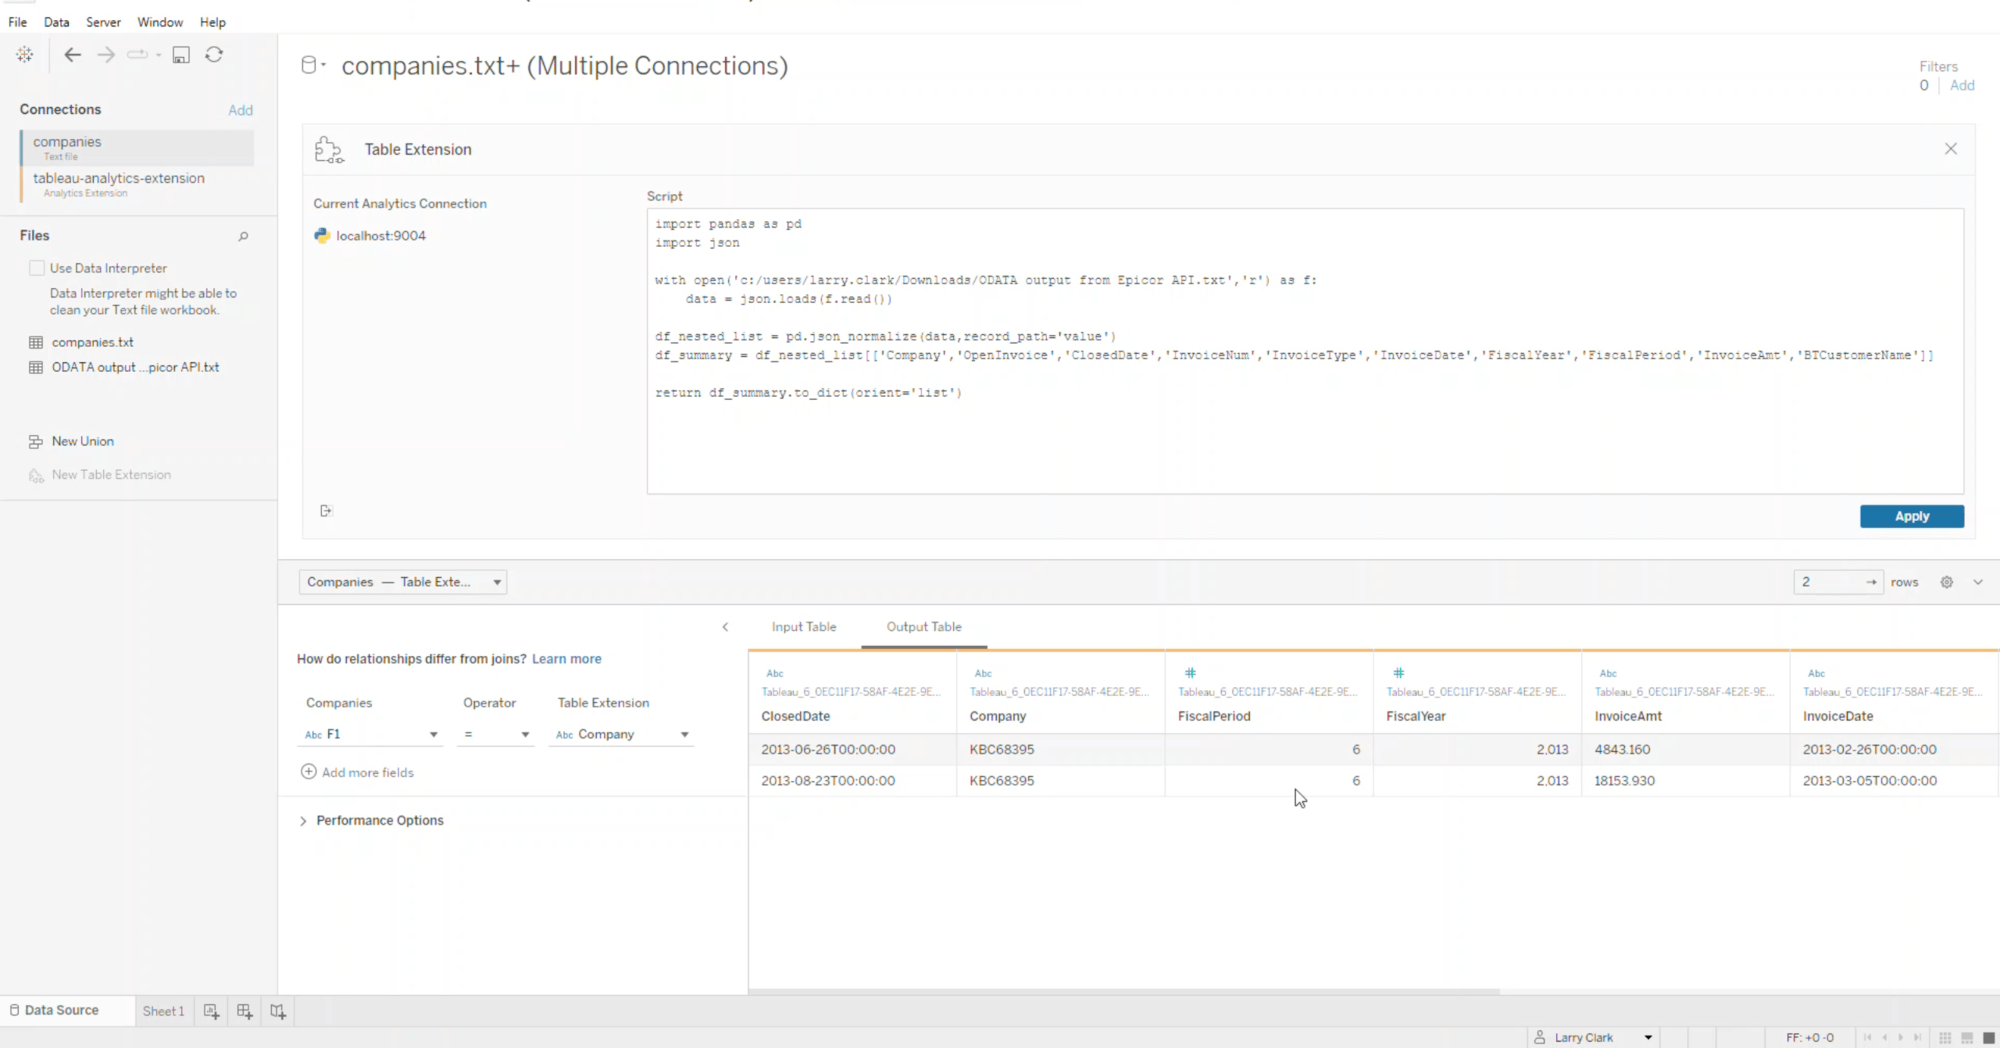
Table Extensions
Table Extensions add new depth to seeing and understanding data by bringing deep analytics and data shaping with code and APIs to the core of Tableau. Dynamically bring entire data tables from analytics tools like Python, R, Einstein Discovery, and more into Tableau's data model. Live query tables of data using Tableau's Data Model and pass it to analytics extensions for analysis, re-shaping, or enrichment, and return results tables to Tableau just like any other data source. With Table Extensions, you are able to inject advanced analytics and predictions at different levels of detail, bring more data for better business decisions, and get real-time results because values are re-computed dynamically.
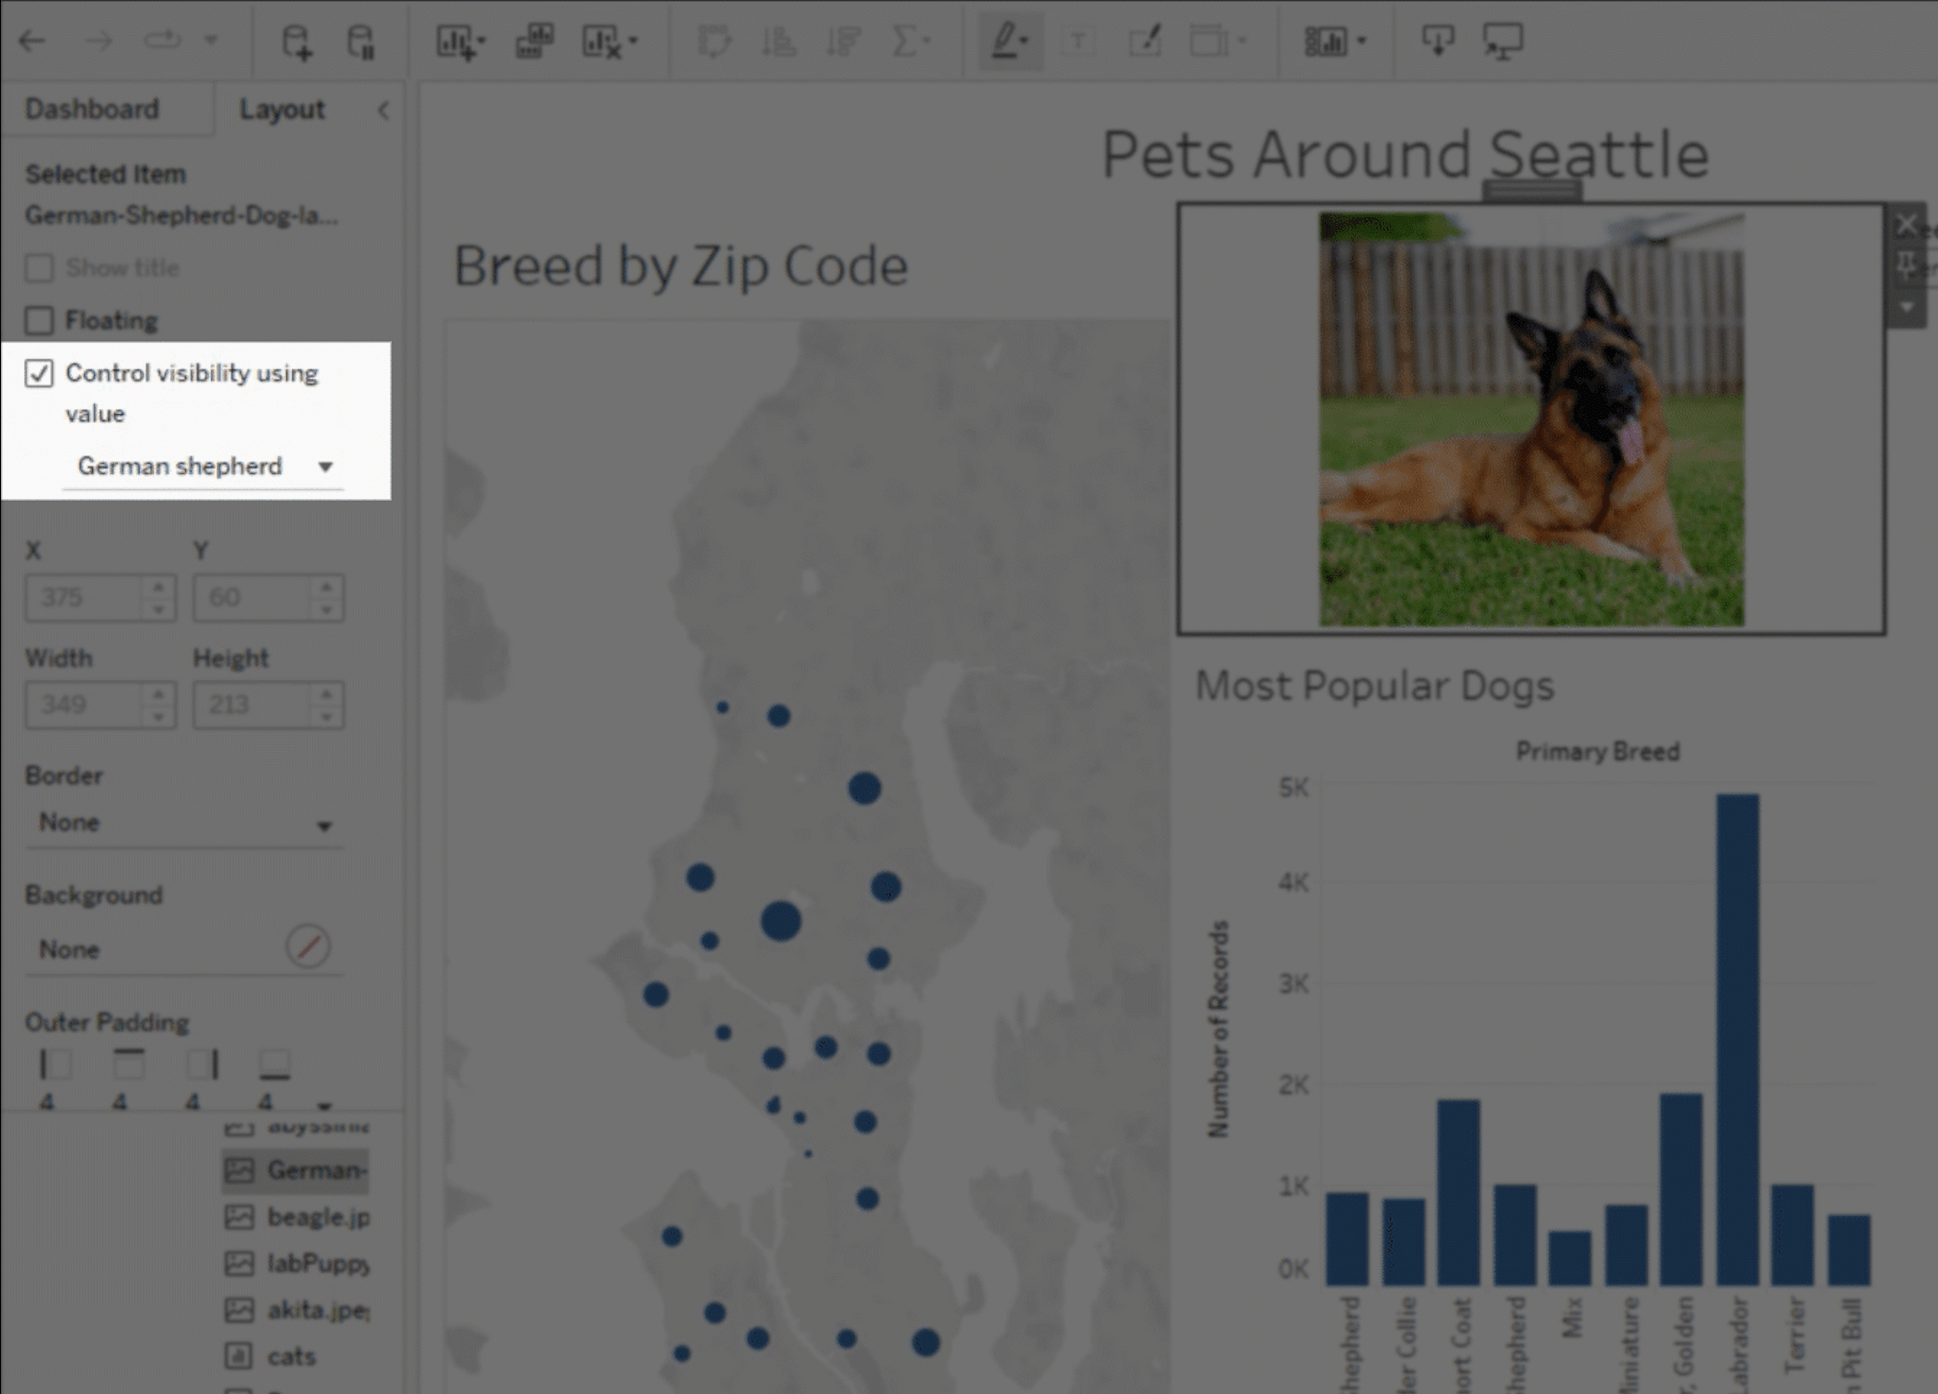
Dynamic zone visibility
With dynamic zone visibility, you can tailor experiences for your end-users so they only see the dashboard elements relevant to them. Create sophisticated and interactive dashboards that dynamically reveal dashboard elements. In the layout pane, you configure when dashboard elements are shown or hidden based on the values of parameters and fields. More information here.
Dynamic scaling in a container
Advanced Management for Tableau Server customers can now scale Backgrounders, and their supporting processes, in Docker containers via Kubernetes on a set schedule. In the past, Tableau Server admins faced a predicament: pay to size the deployment for peak load times or save money but face longer delays before Backgrounder processes finish. Now, you can add additional Backgrounder resources when needed and spin them down after peak times, giving you control over the cost vs. performance tradeoff.
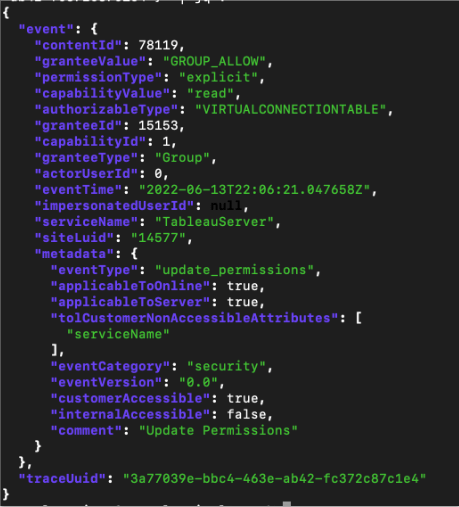
Activity Log in Tableau Server
The Activity Log goes above and beyond existing event data by exposing more events within your Tableau environment. These events will be structured and documented. For Advanced Management for Tableau Server customers, this comes to life through a new log file in your Tableau Server logs folder. The Activity Log will make permissions auditing possible which is essential for implementing a robust book of controls on your Tableau environment.
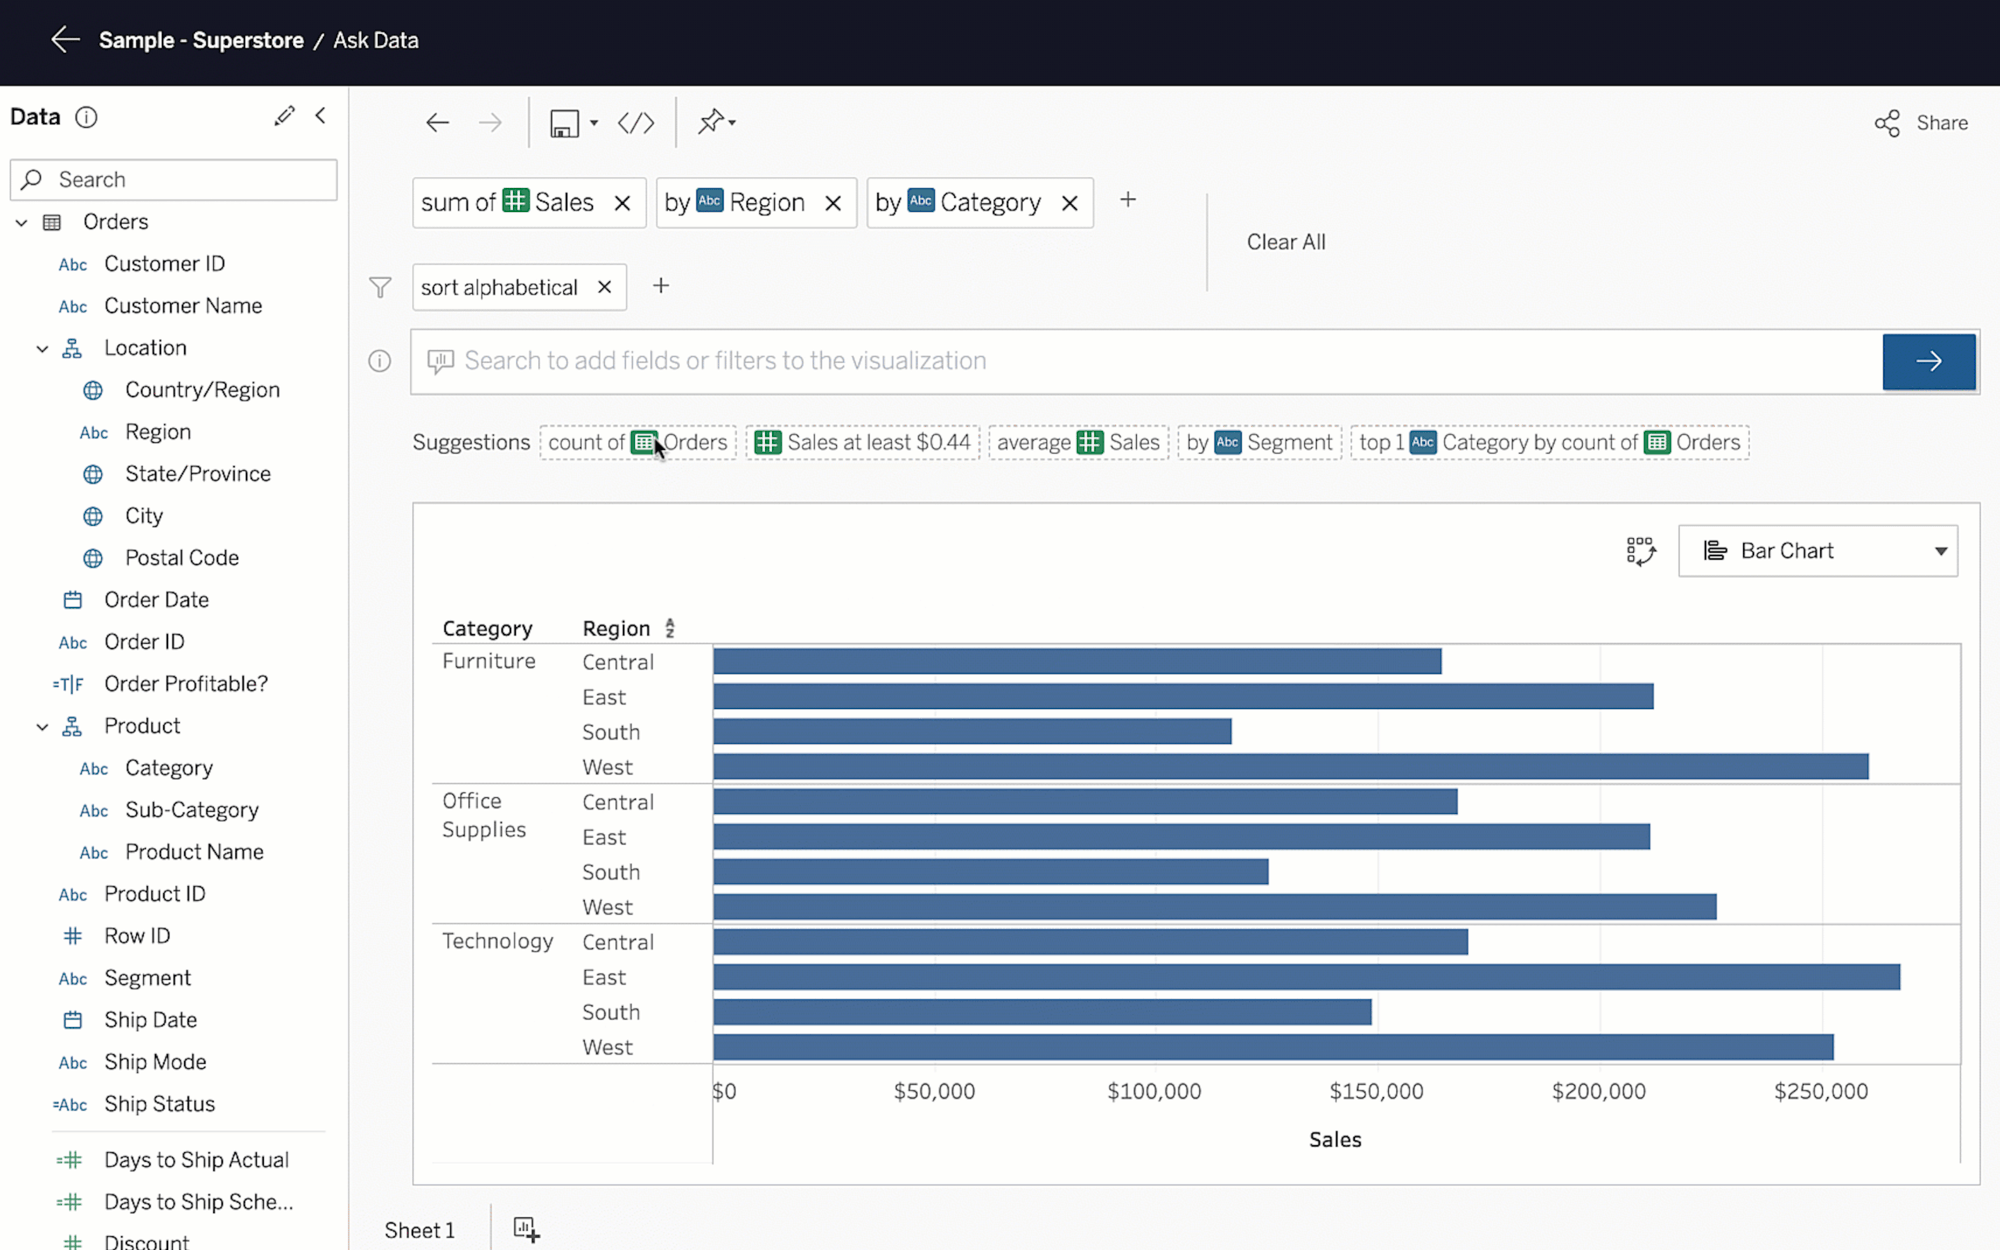
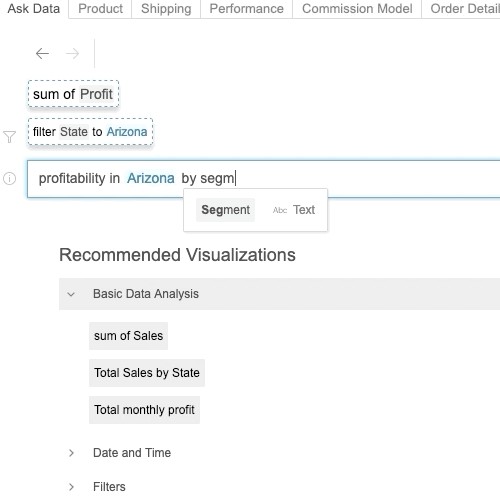
Ask Data phrase recommendations
Ask Data phrase recommendations make it even easier for business users to ask questions of their data using natural language. Powered by machine learning models, Ask Data intelligently recommends next steps to uncover insights in your data by suggesting new measures to add to your question or dimensions to group by or filter on. Selected recommendations automatically update the query sent to Ask Data and the visualized answer that is returned. More information here.
Tableau 2022.2
Tableau 2022.2 delivers new capabilities that make data easier for everyone to use, including more efficient data prep and faster analysis. Highlights include Data Stories, Autosave in the browser, and the In-product Exchange.
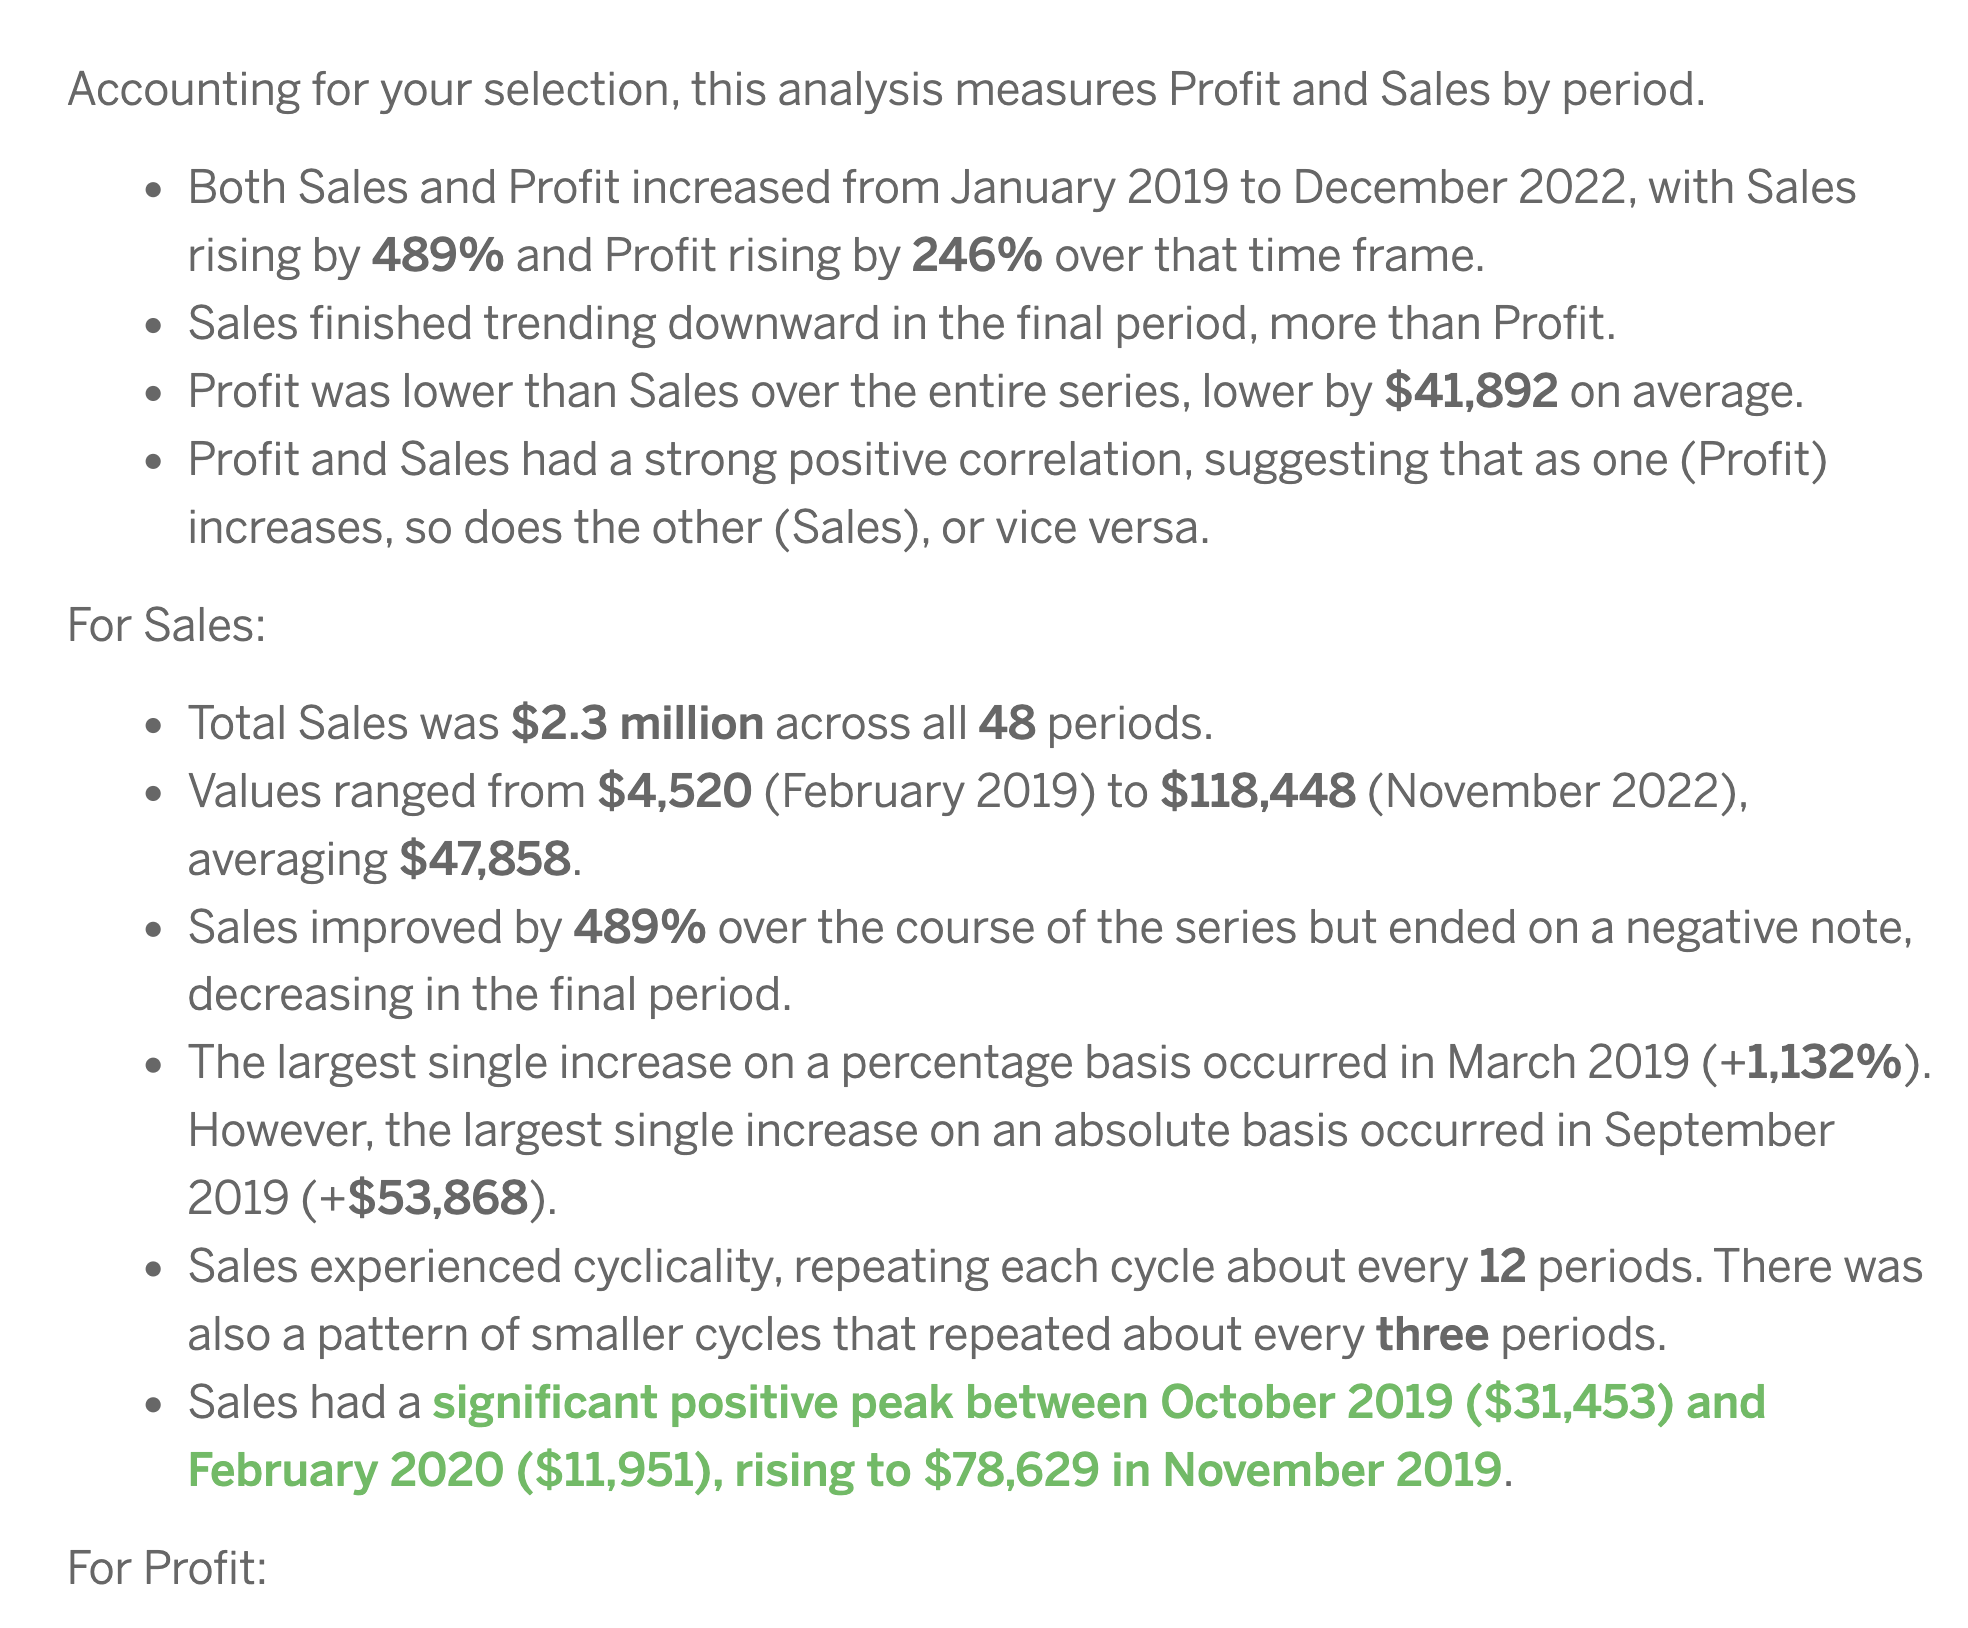
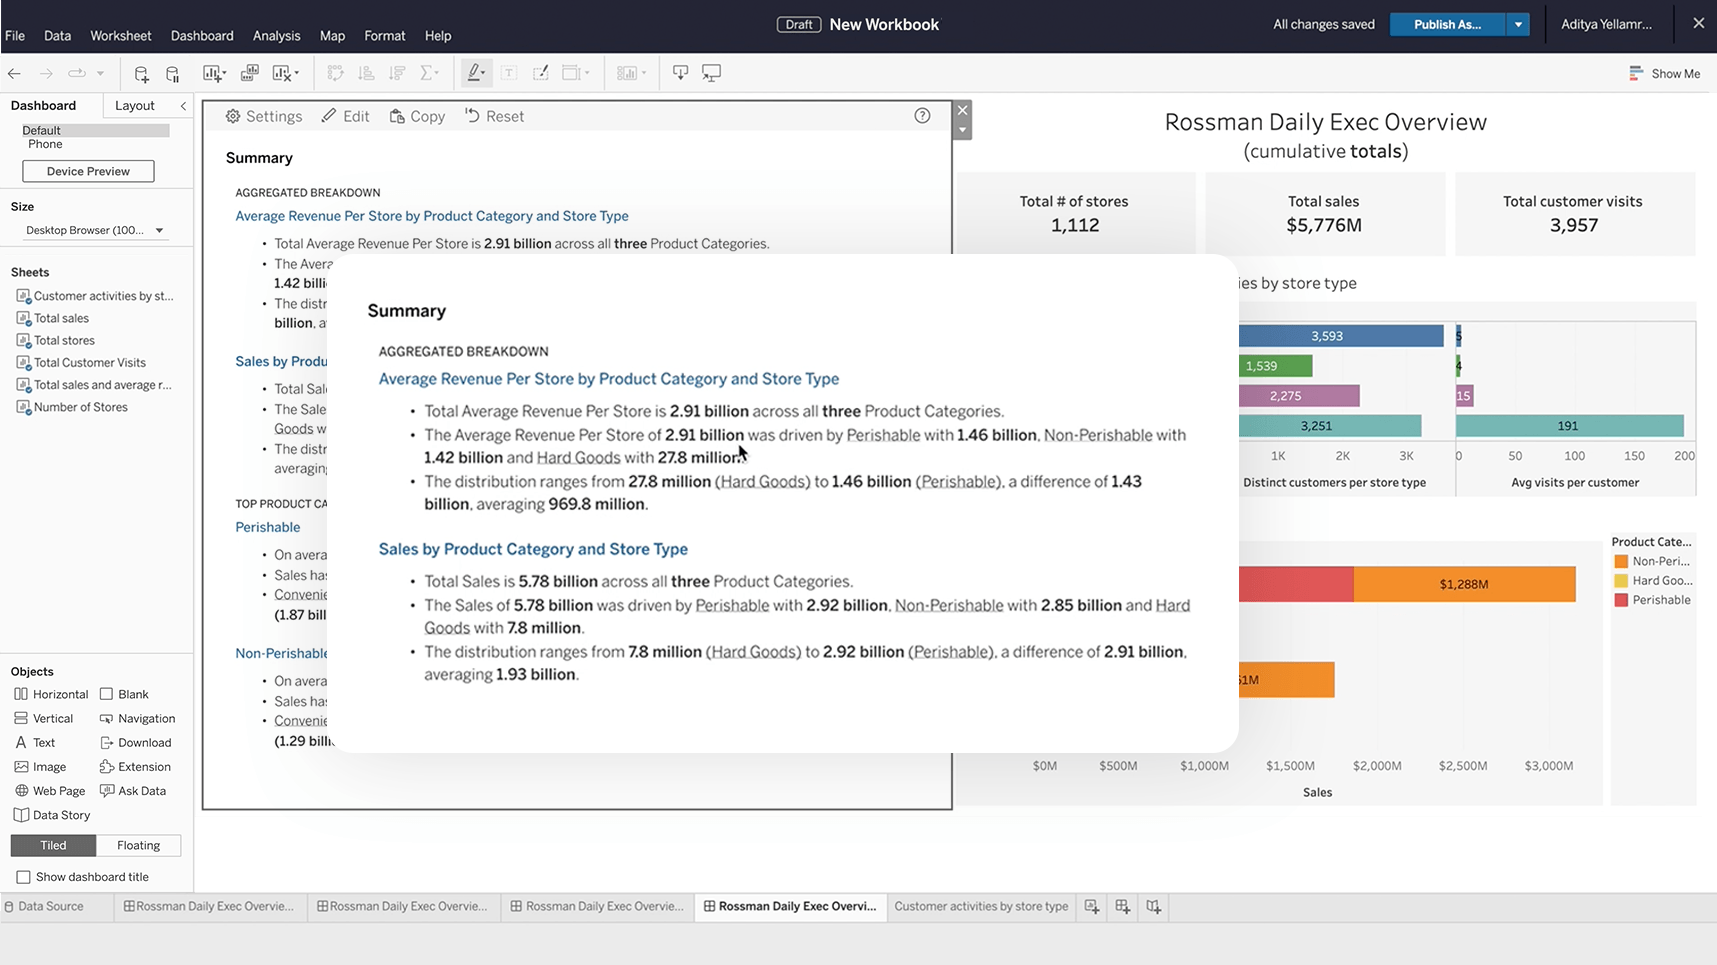
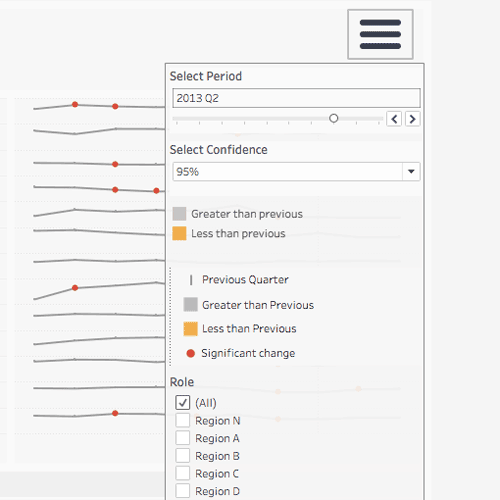
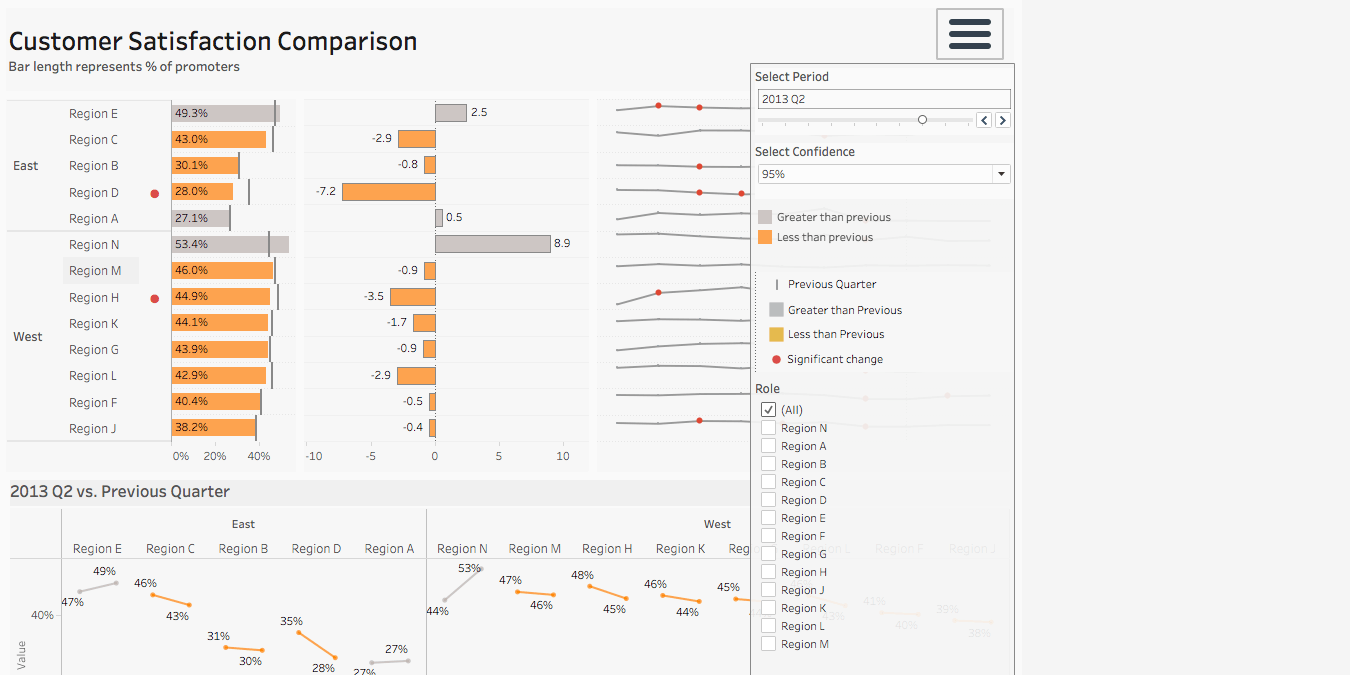
Data Stories
Help any user to confidently access, understand, and communicate with data. Data Stories automate the analysis, build, and communication of insights, but are fully customizable, so you can tailor the stories based on your audience. Choose which analyses are included, change the confidence interval, rename fields, apply colors to denote positive or negative changes, and more.
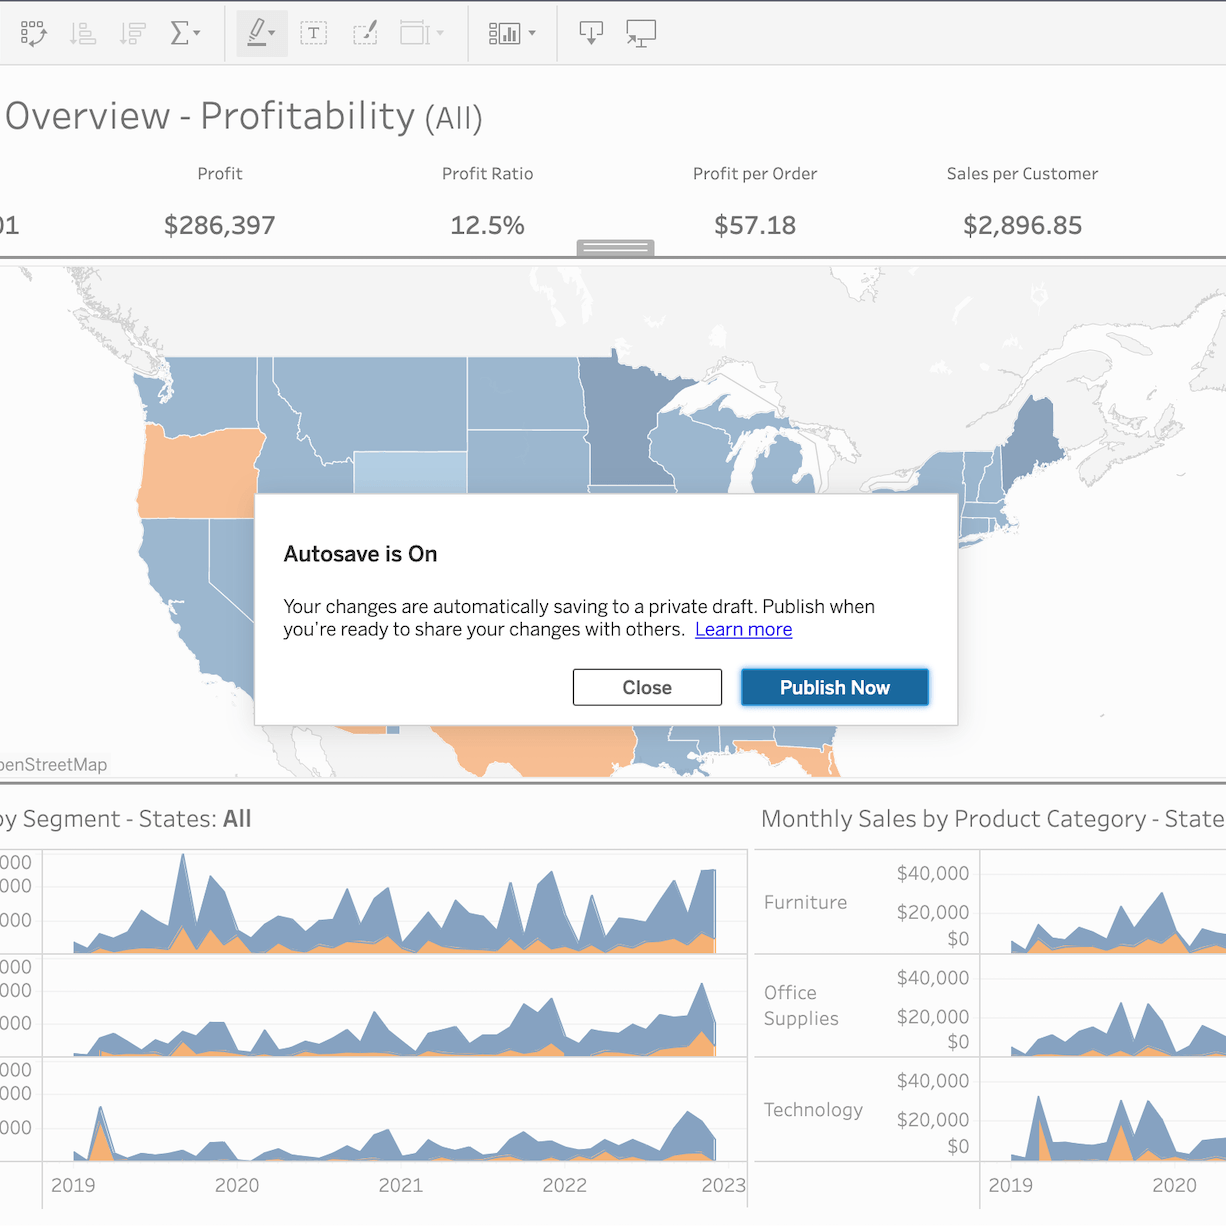
Autosave
Trust your work won’t be lost. Autosave lets you edit an existing workbook in a draft until you’re ready to publish so you won't lose your changes or share them prematurely with other workbook users.
In-product Exchange
It is now even easier to leverage trusted offerings from the Tableau Exchange right where you work in Tableau. Dashboard Extensions and Tableau Accelerators from the Tableau Exchange are accessible directly in Tableau Desktop as part of the core authoring experience.
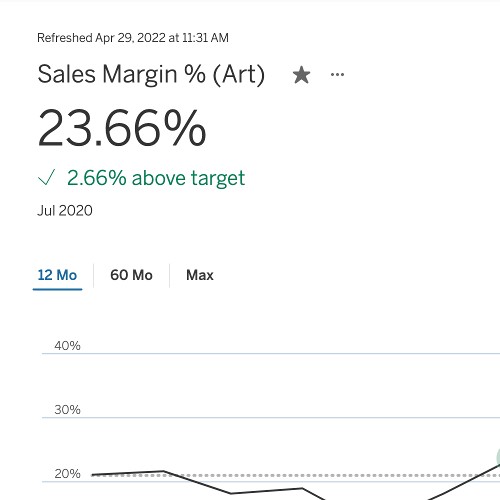
Metrics improvements
Create metrics to track key data points without having to access your dashboards and edit them at any time. You can now come back and edit existing metrics to change the historical comparison period, the date range used by the metric, and the status indicators. Additionally, you can dynamically explore different date windows while analyzing the metric without editing the configuration.
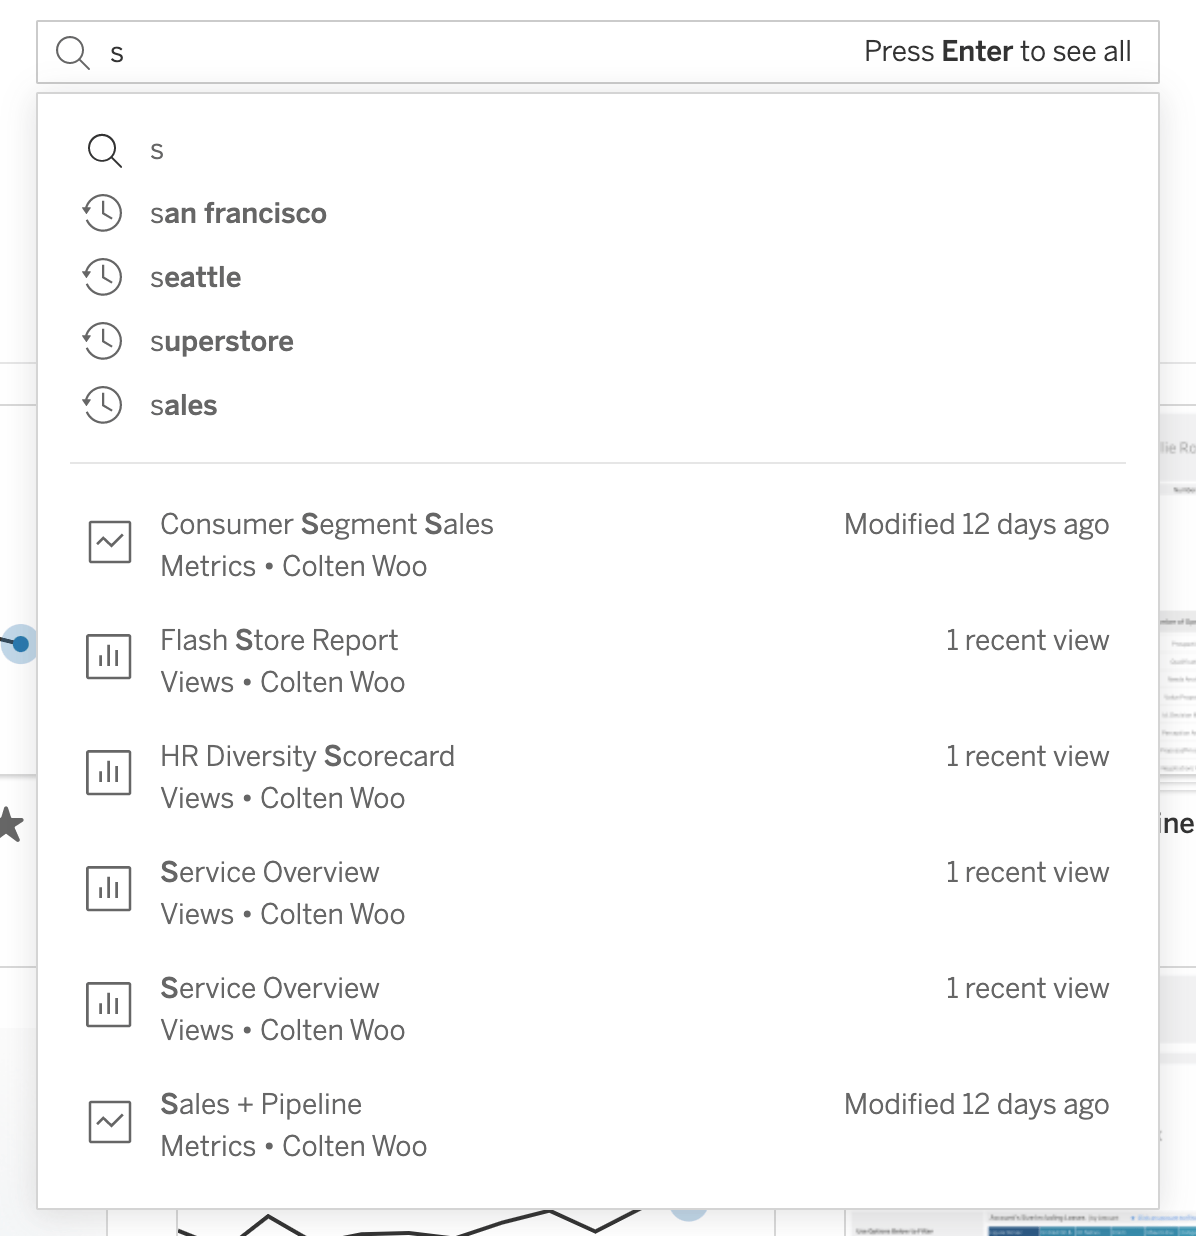
Improved Quick Search
Navigate to relevant content faster and more intelligently in Tableau Cloud. The reimagined Quick Search includes a new suggested content algorithm, a streamlined design, and past searches a click away to save time and speed up your time to insight.
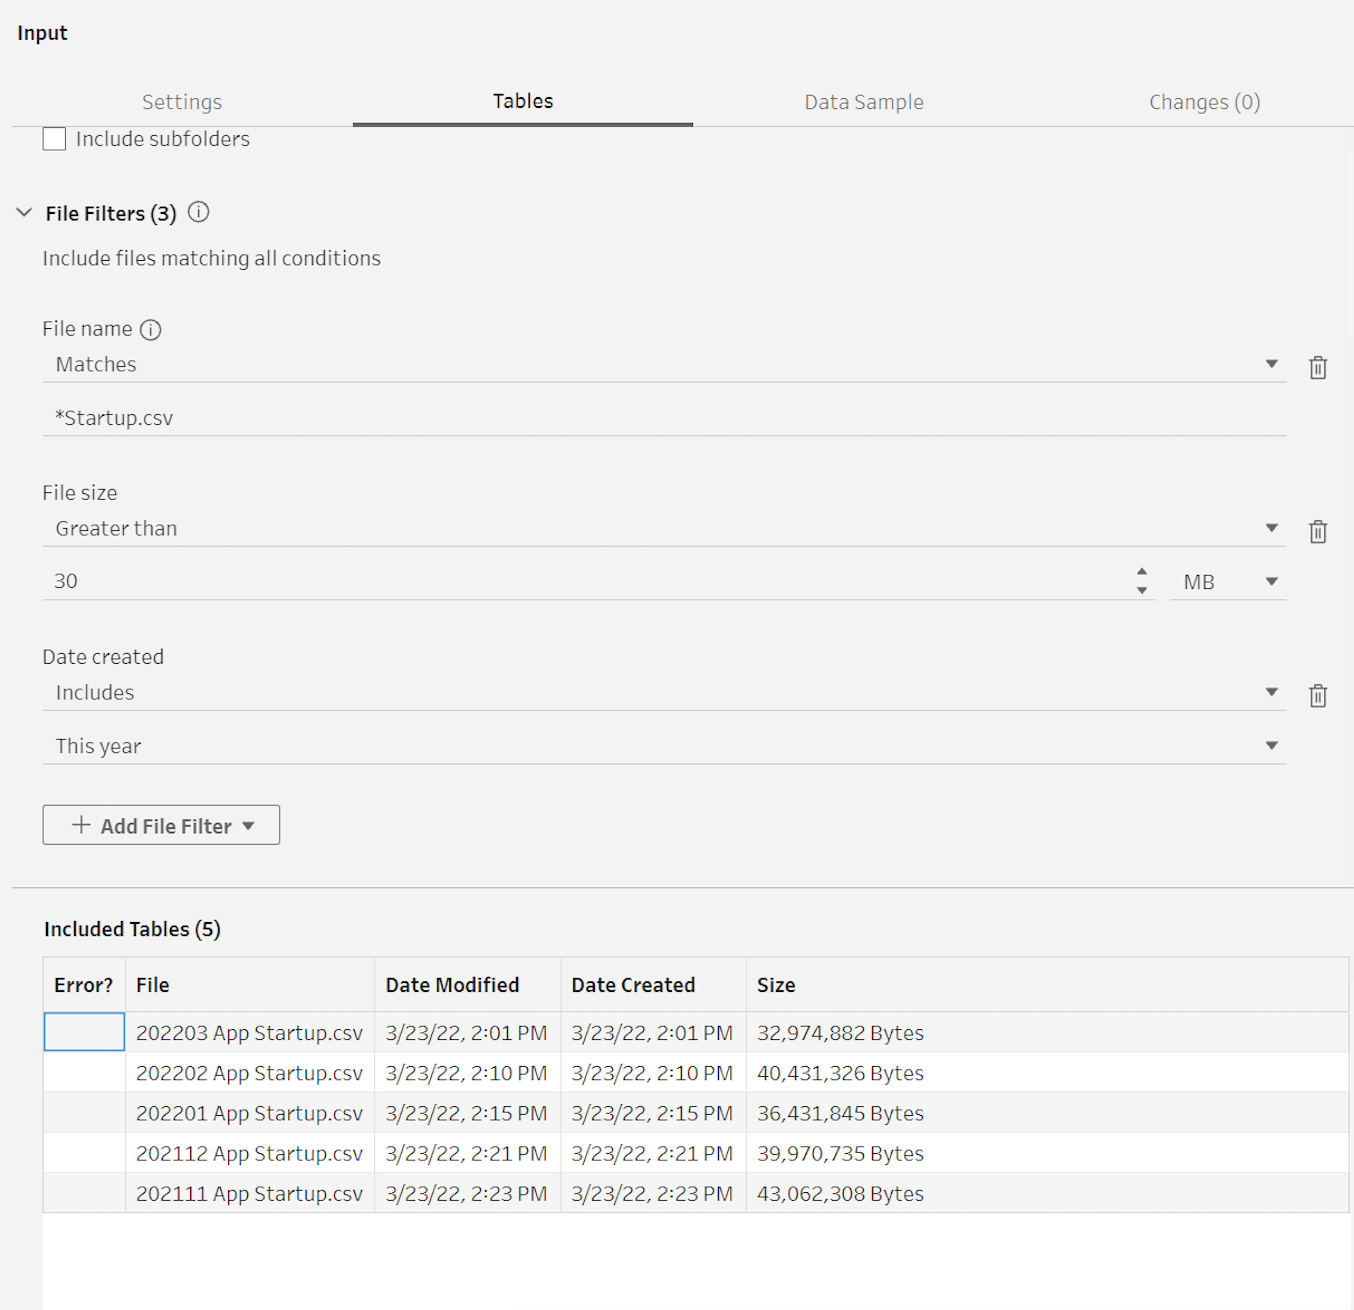
Wildcard Union enhancements in Prep
Select a subset of files from a directory based on a new set of attributes within Tableau Prep. These attributes include file name, creation time, last modified time, last access time and size.
Tableau 2022.1
Tableau 2022.1 is here with new capabilities to help you more efficiently analyze data and confidently manage the platform, while scaling Tableau across your organization so that everyone can make better business decisions and get more value from your data.
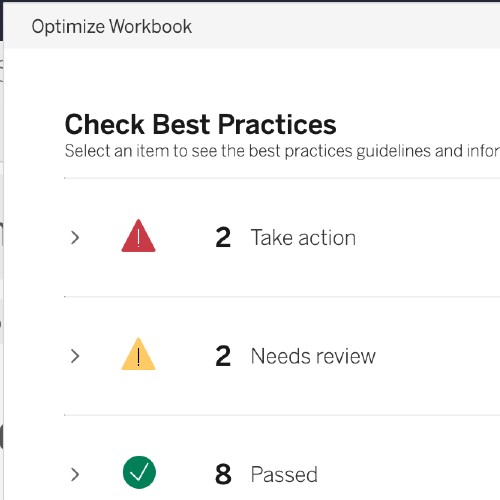
Workbook Optimizer
Optimize your workbook’s performance and understand what tradeoffs you are making without compromising your powerful insights. Workbook Optimizer emphasizes quick actions you can take without making functional changes, the actions that will require trading off functionality for performance, and the best practices you have implemented correctly in your workbook. With concrete guidance on implementing best practices, you can optimize the consumption experience and create dashboards that run smoothly in Tableau Online, Tableau Server, and Tableau Desktop.
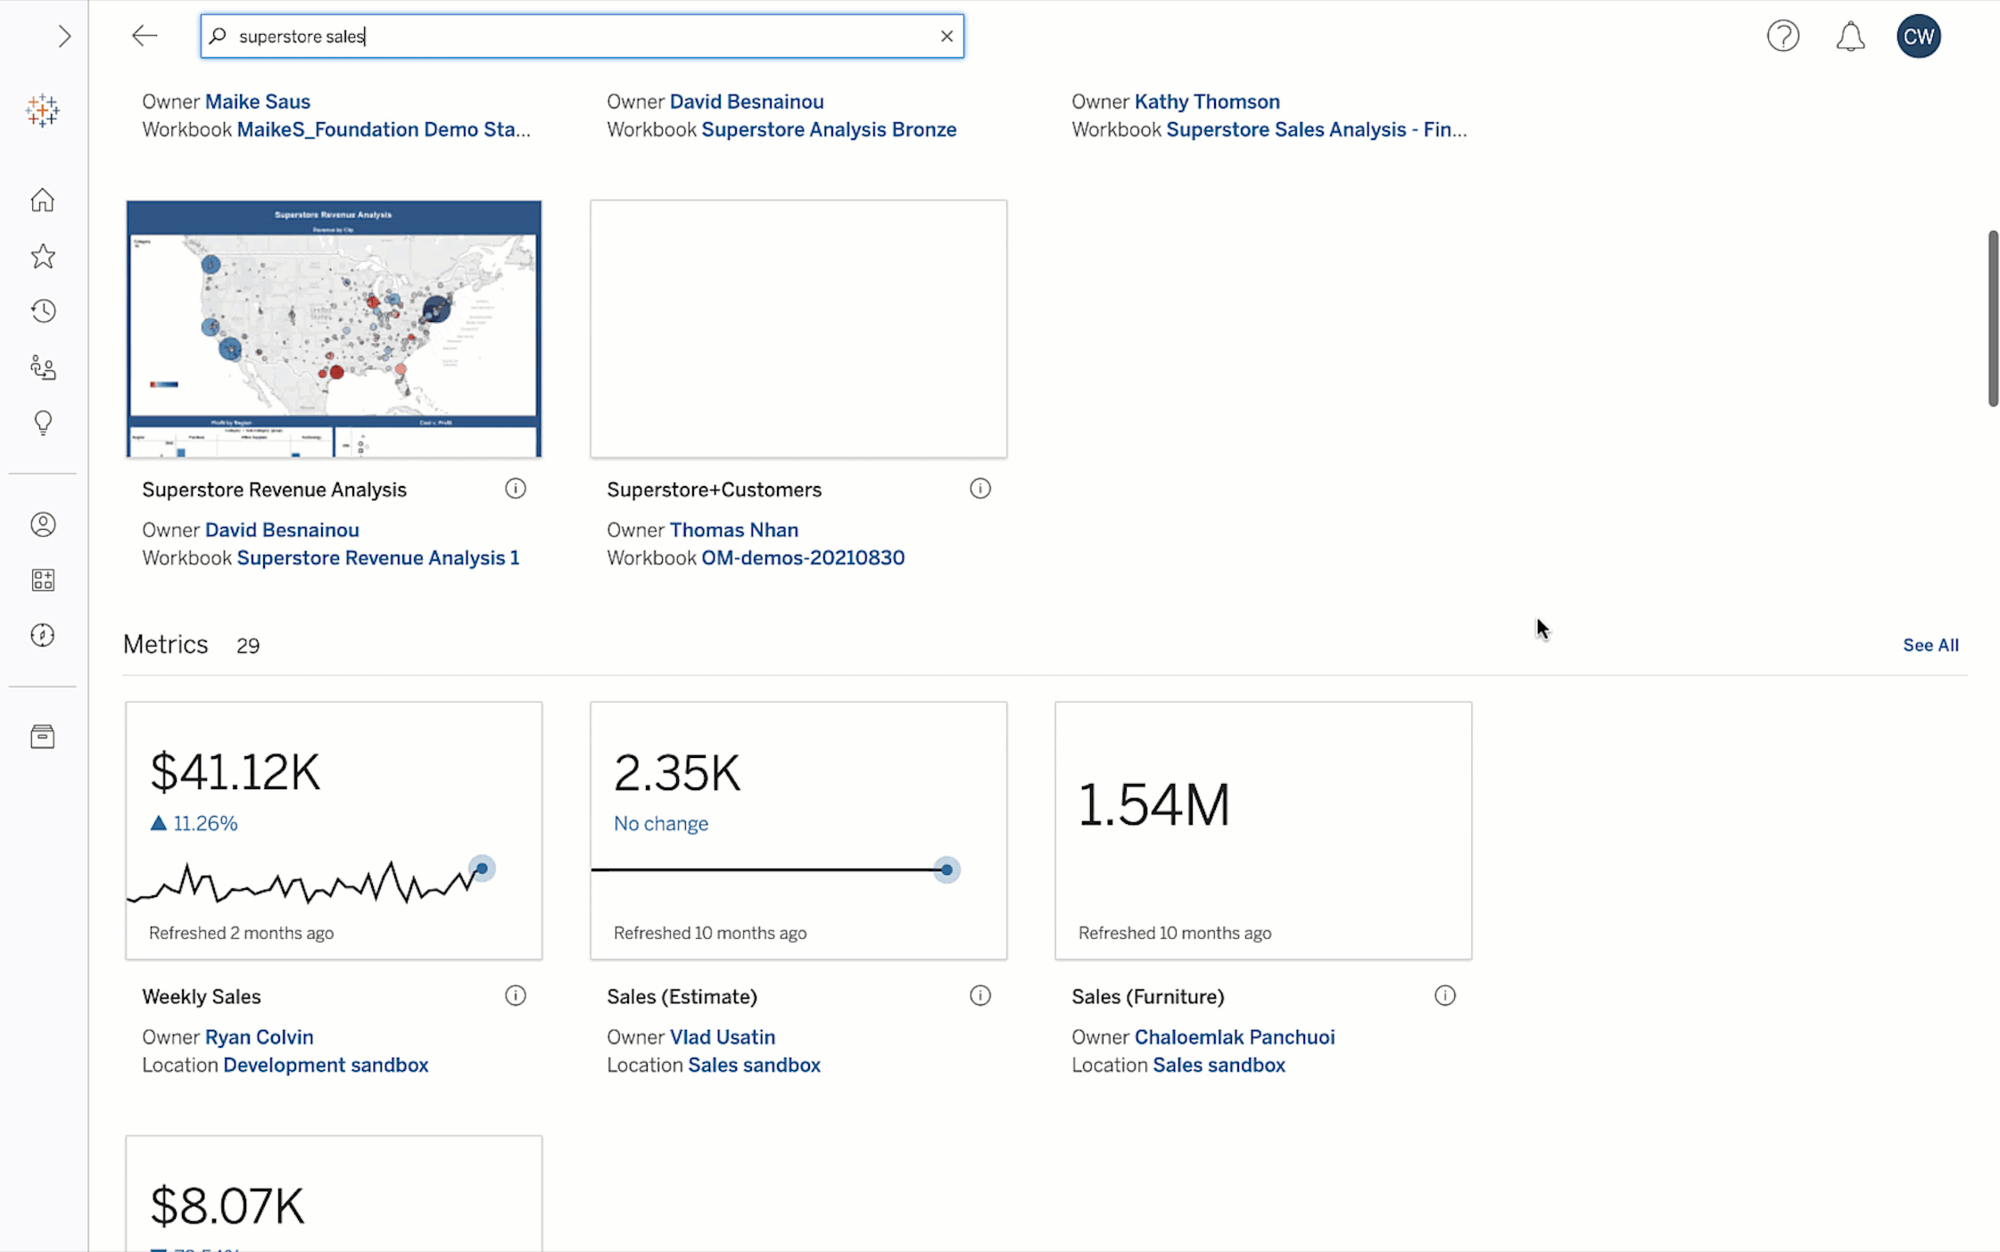
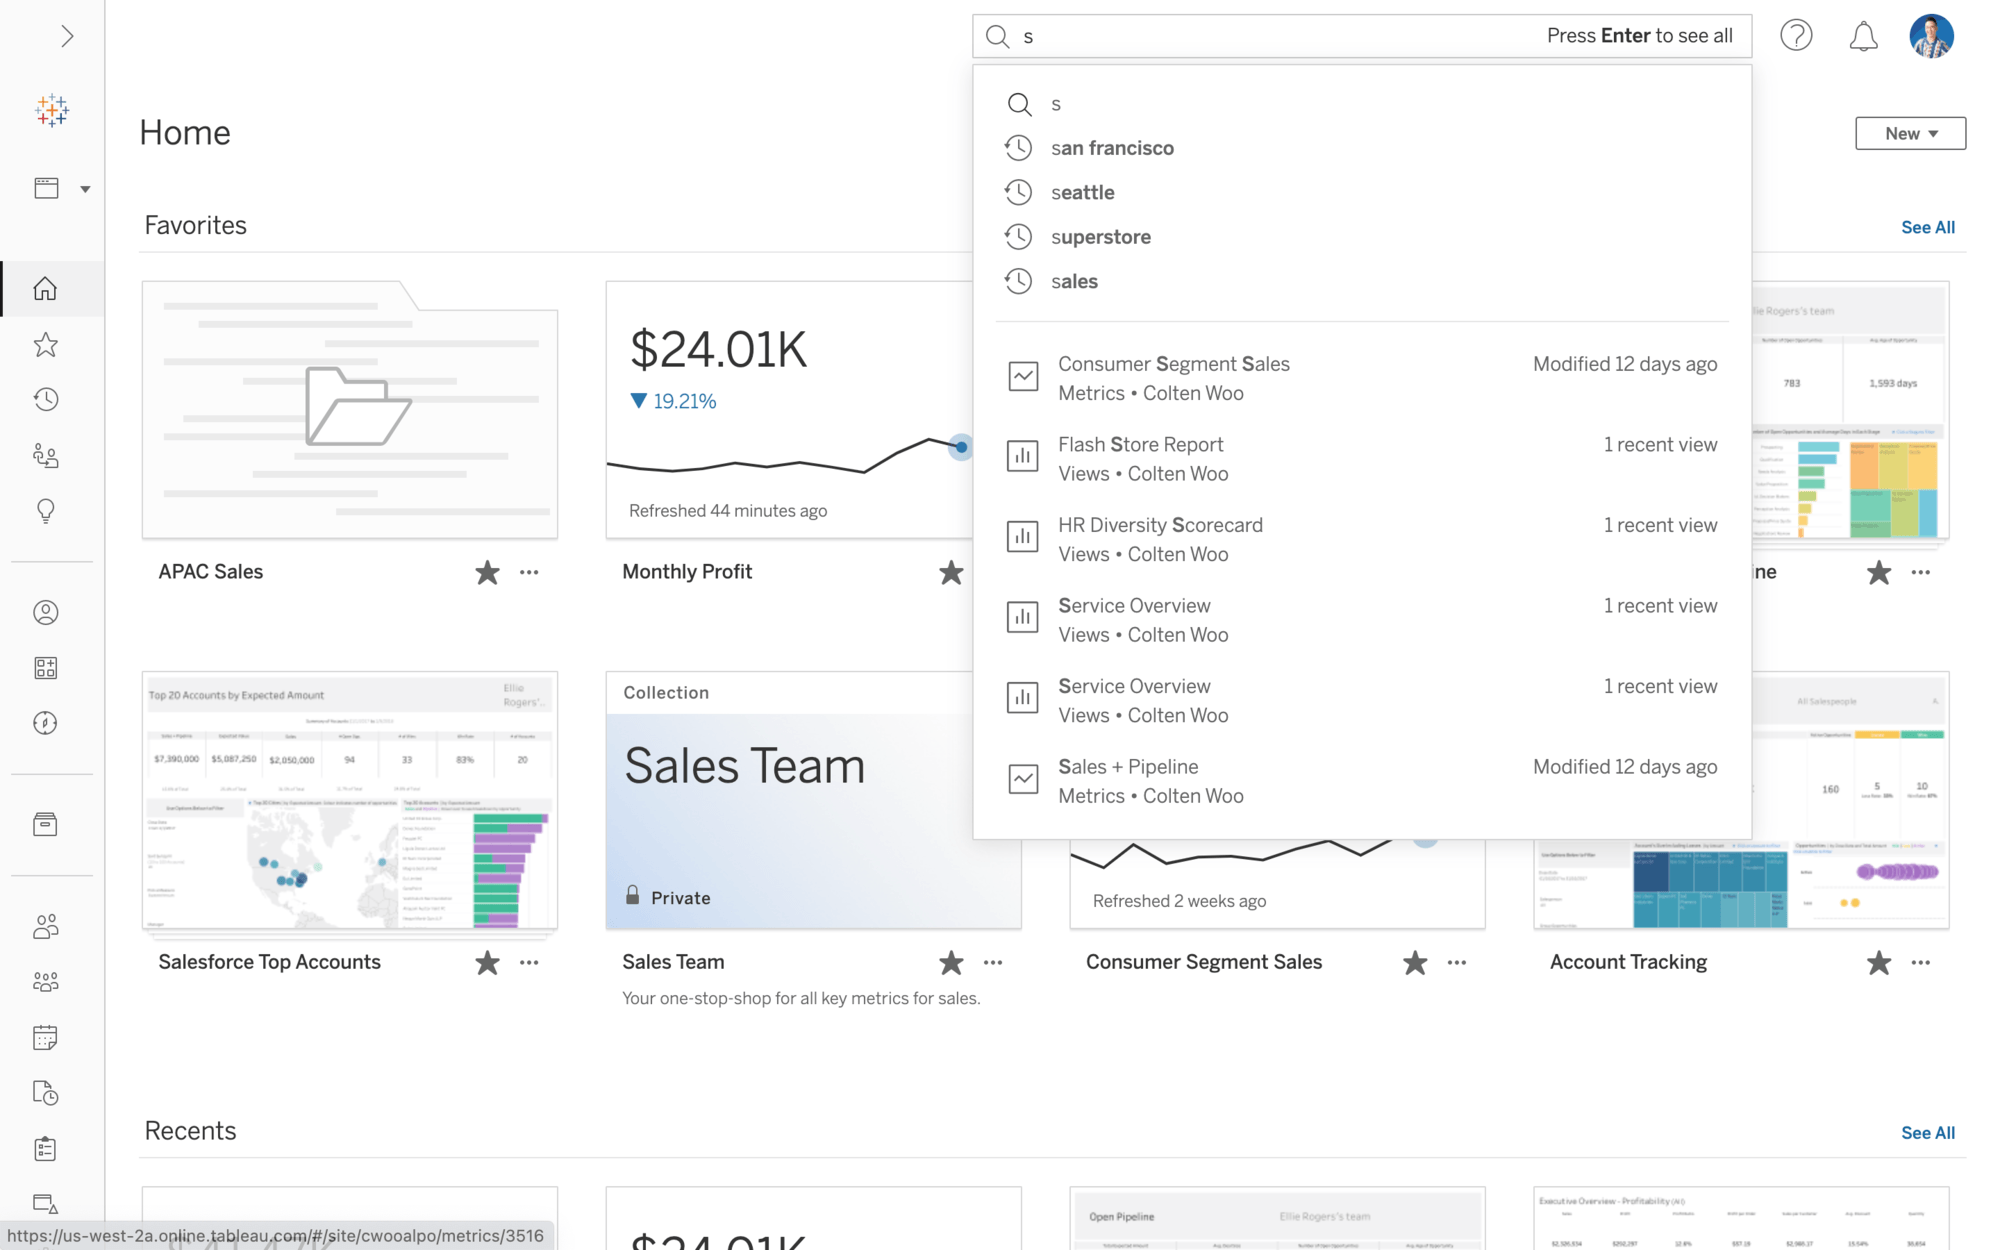
New Search Experience
Find content that matters faster. We reimagined Tableau search from the ground up to ensure the most useful content bubbles to the top when you search in Tableau. Results are ranked based on signals like text relevance, popularity, and recency to ensure everyone at your organization can find the data they need to make faster, smarter data-driven decisions.
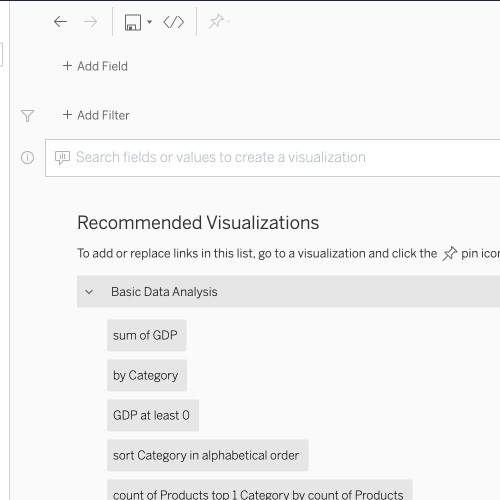
Ask Data Phrase Builder
Does typing a question feel like staring at a blank page when using Ask Data? Sometimes you might not know what to ask just yet, or you may want to familiarize yourself with the data a little more. Tableau has your back! The new Add Field and Add Filter buttons in Ask Data provide an intuitive click-through workflow to help you get the answers you need. The guided workflow provides visual prompts and suggested actions to build your queries (as phrases) with fields and filters relevant to you. The results of your questions or phrases come as rich data visualizations that enable you to get the insights you want from your data. Try Ask Data phrase builder in Tableau Server and Tableau Online.
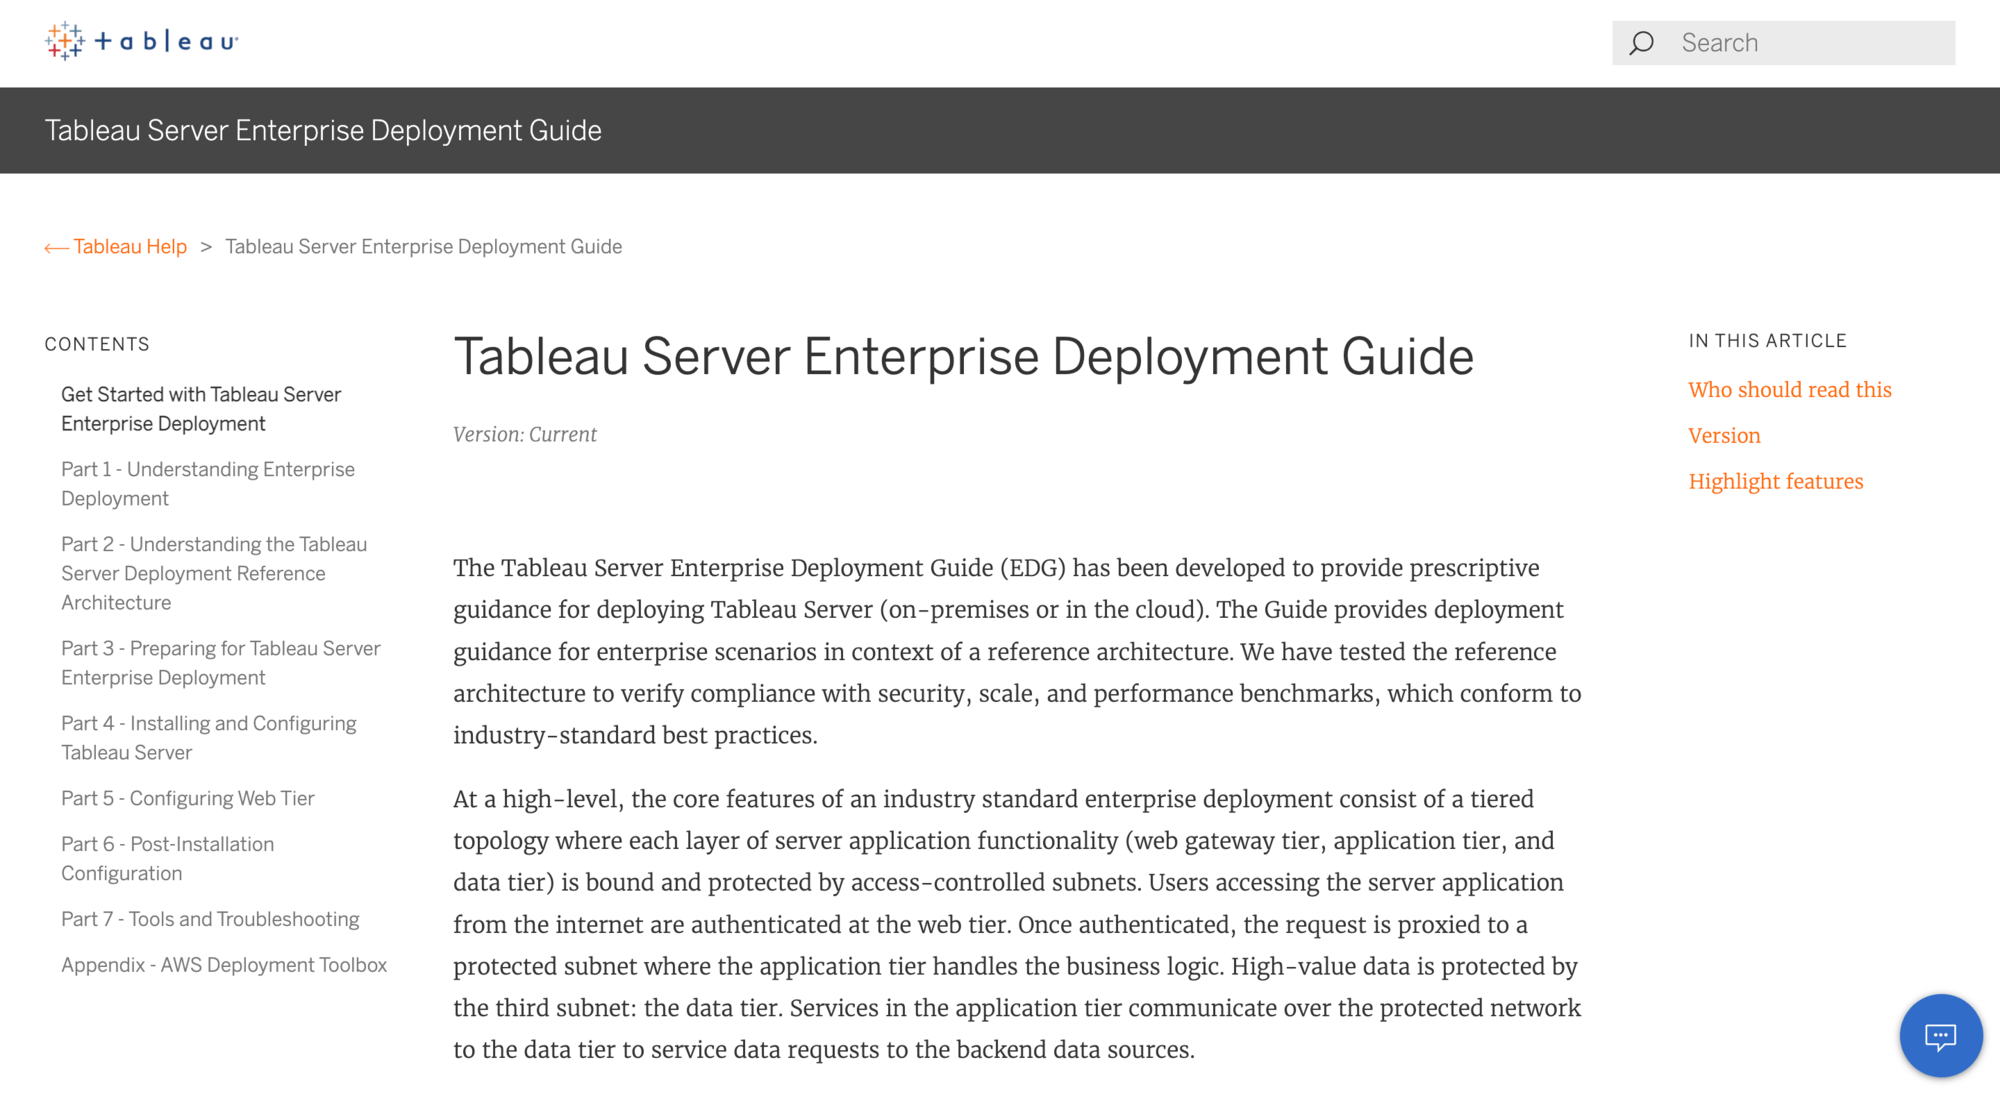
Enterprise Deployment Guidelines
Deploy Tableau Server using a reference architecture with optimal availability, scalability, security, and performance across web, data, and application layers, in compliance with enterprise data center best practices. This architecture is technology agnostic, supporting bare metal, VM or Container deployment, and platform independent, supporting on-premises or cloud.

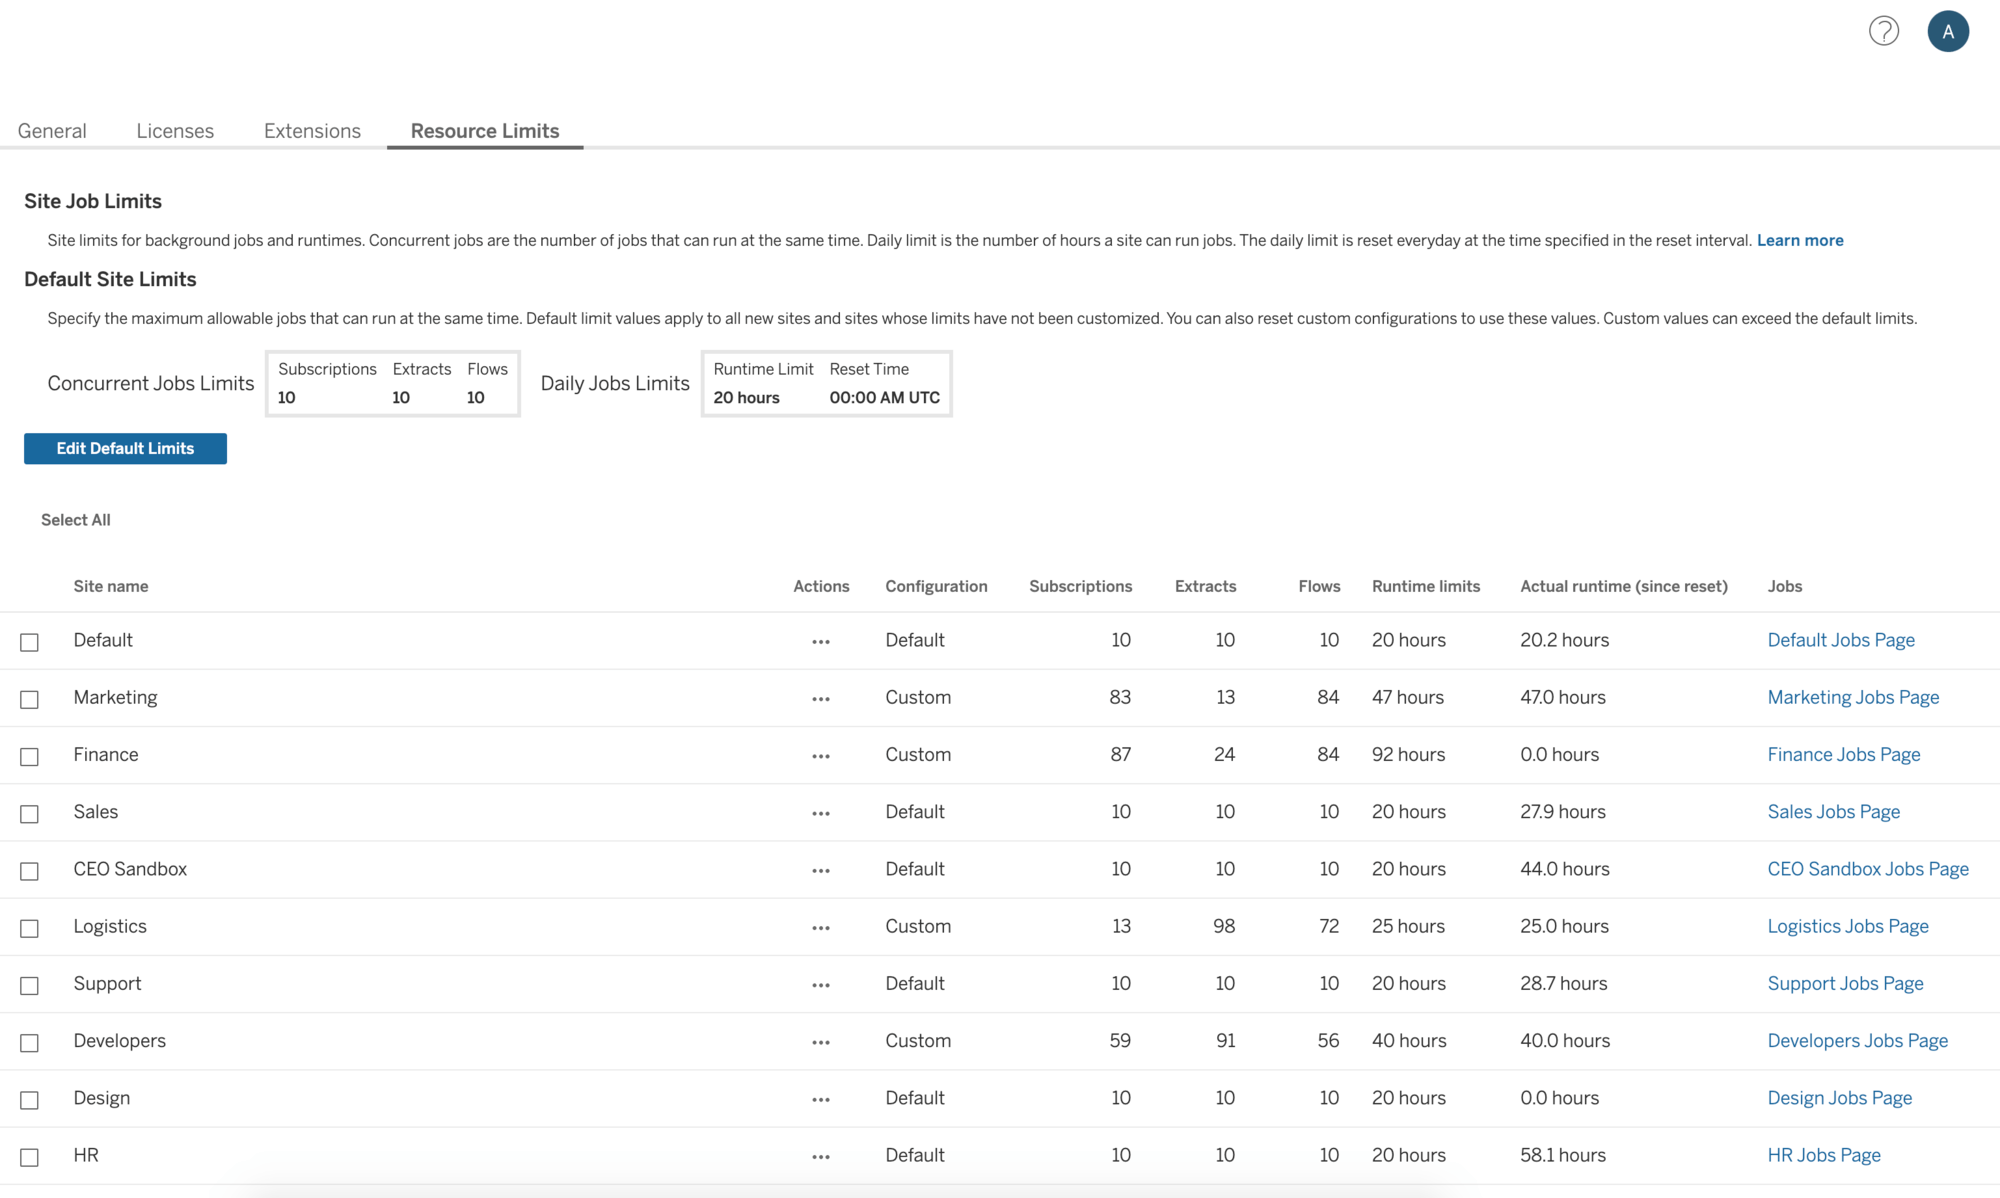
Backgrounder Resource Limits
With Advanced Management for Tableau Server, you can now guarantee that no single site in the deployment can monopolize and negatively impact the performance of the rest of the deployment. Manage Backgrounder resources and control how they are used by setting limits on the number of background jobs running at the same time on a site. In addition, specify the number of Backgrounder hours that a site can use to run jobs per day.
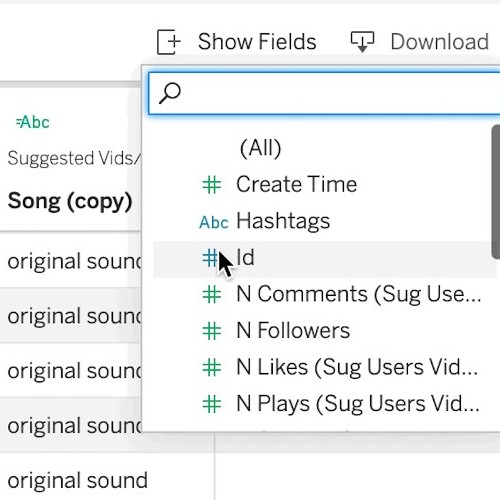
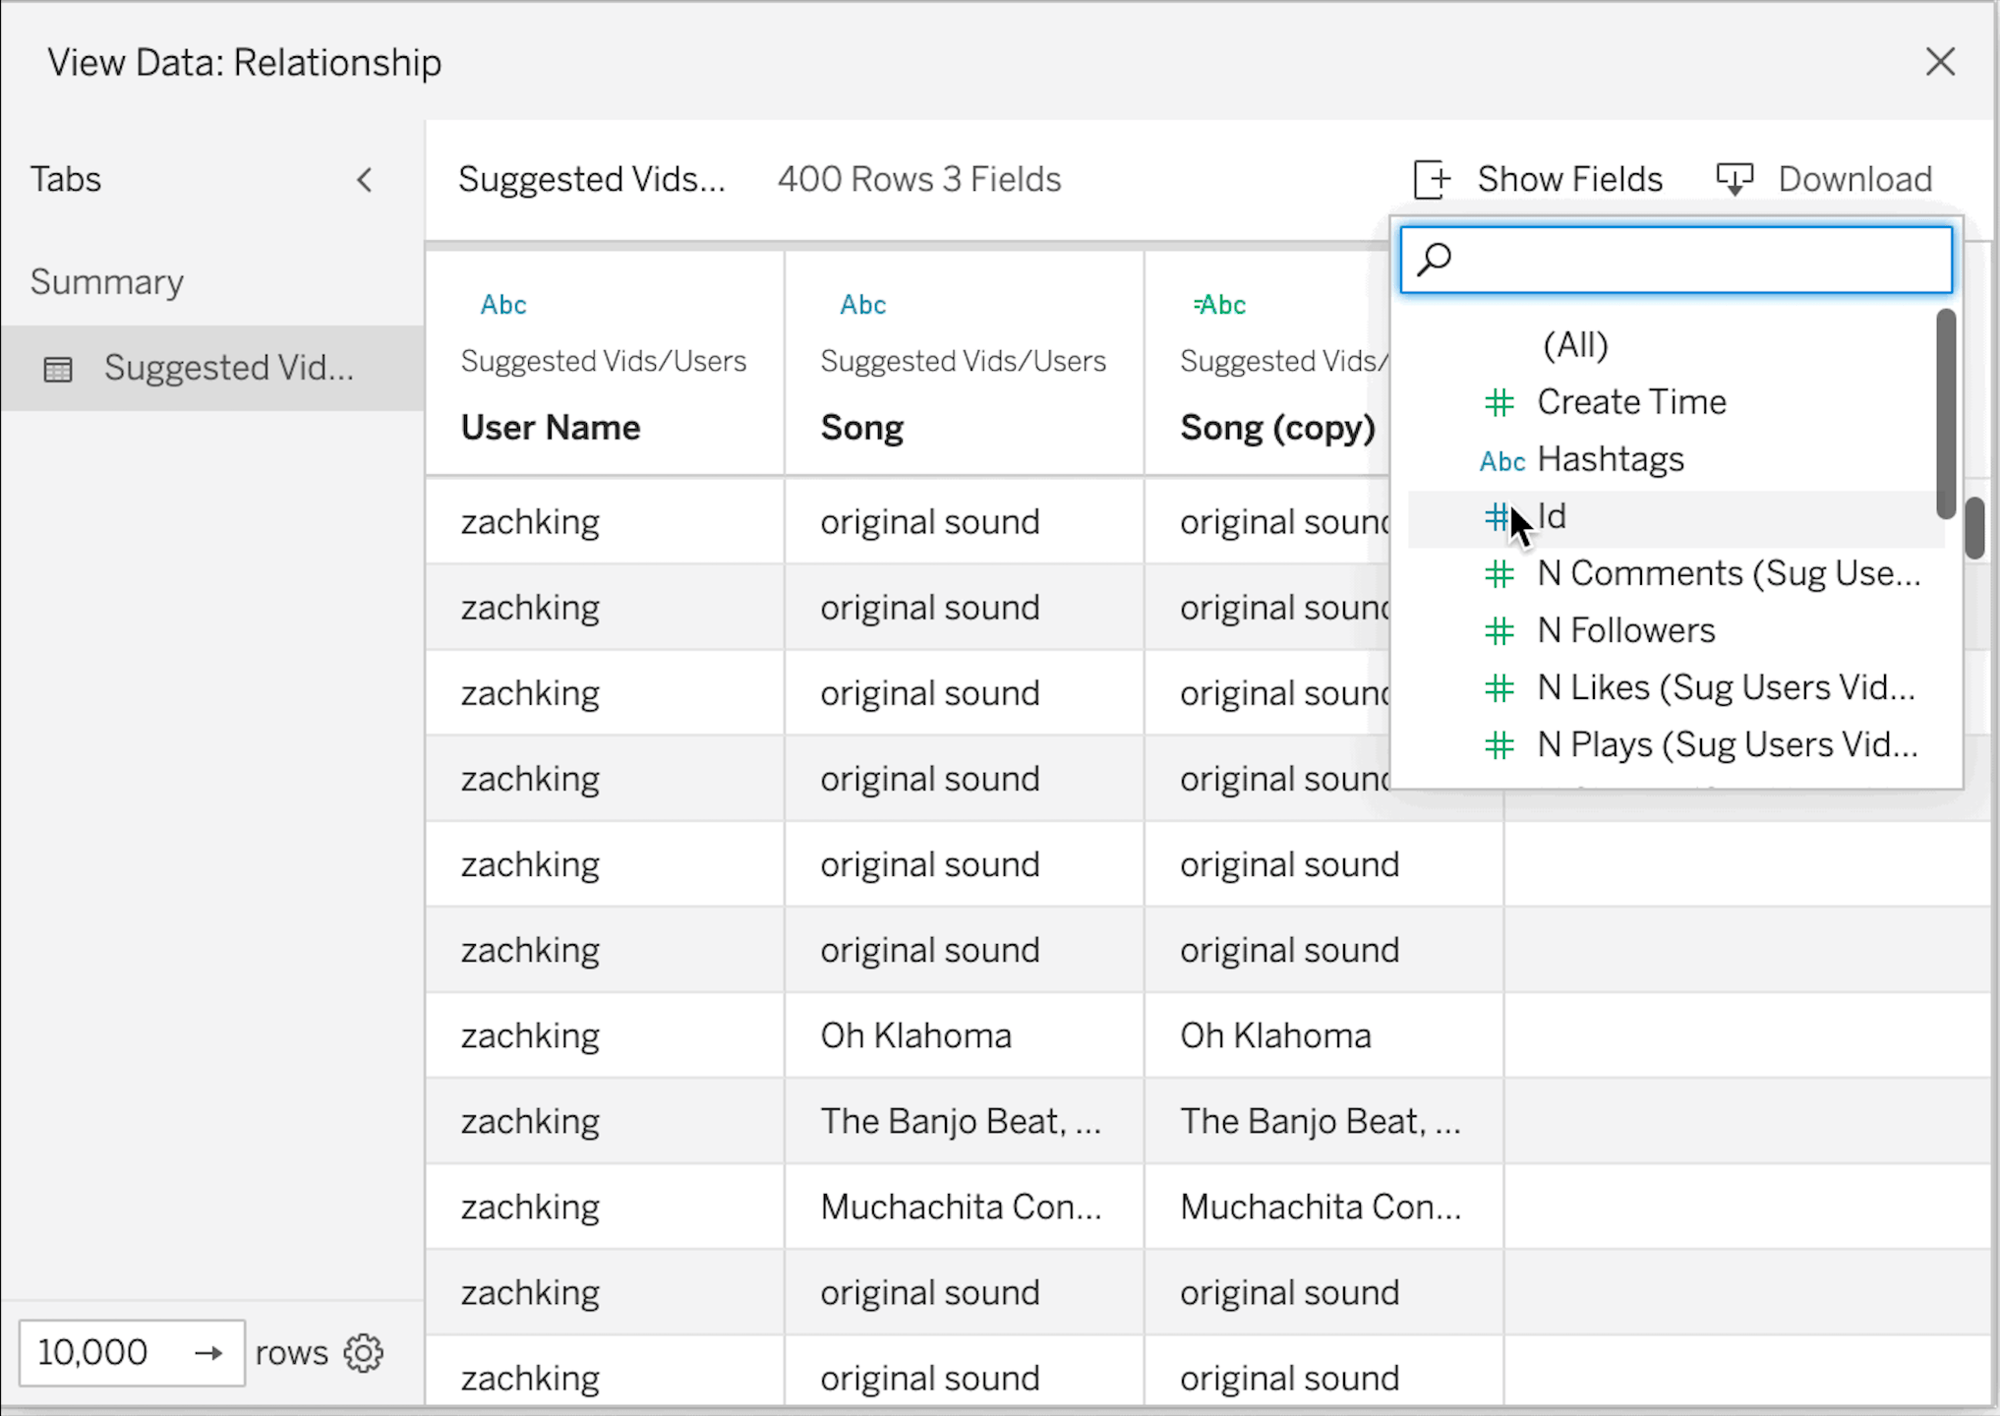
Customize View Data
Design exactly how you want to present the tabular data behind a visualization within the View Data interface. Remove columns from the default view, change their order, sort them, or add additional columns to provide deeper context. Additionally, you can download underlying data as a CSV file with all design changes applied to share with your team. Customize View Data is available in Tableau Online, Tableau Server, and Tableau Desktop.
Tableau 2021.4
Tableau 2021.4 is here with new capabilities to better support secure, connected analytics in the flow of your business—and of course, some delightful capabilities to help you work faster and get more value from your data.
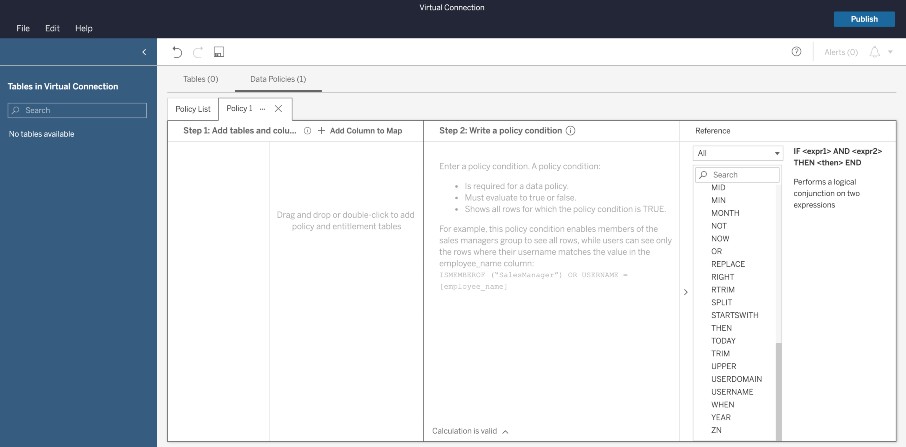
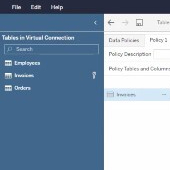
Virtual Connections
Virtual connections are a new content type in Tableau Server and Tableau Online that are used to create and share access to tables, securely embed service account credentials, define Data Policies, and extract data centrally.
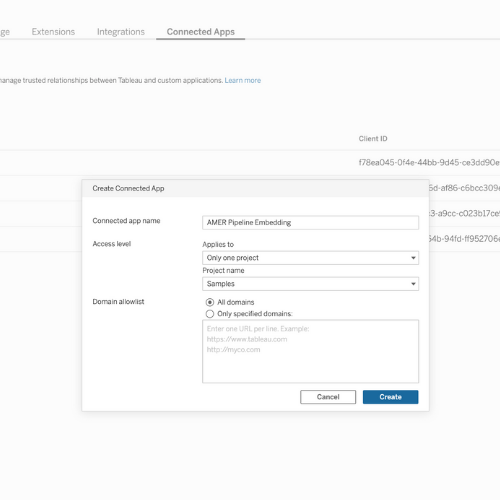
Connected Apps
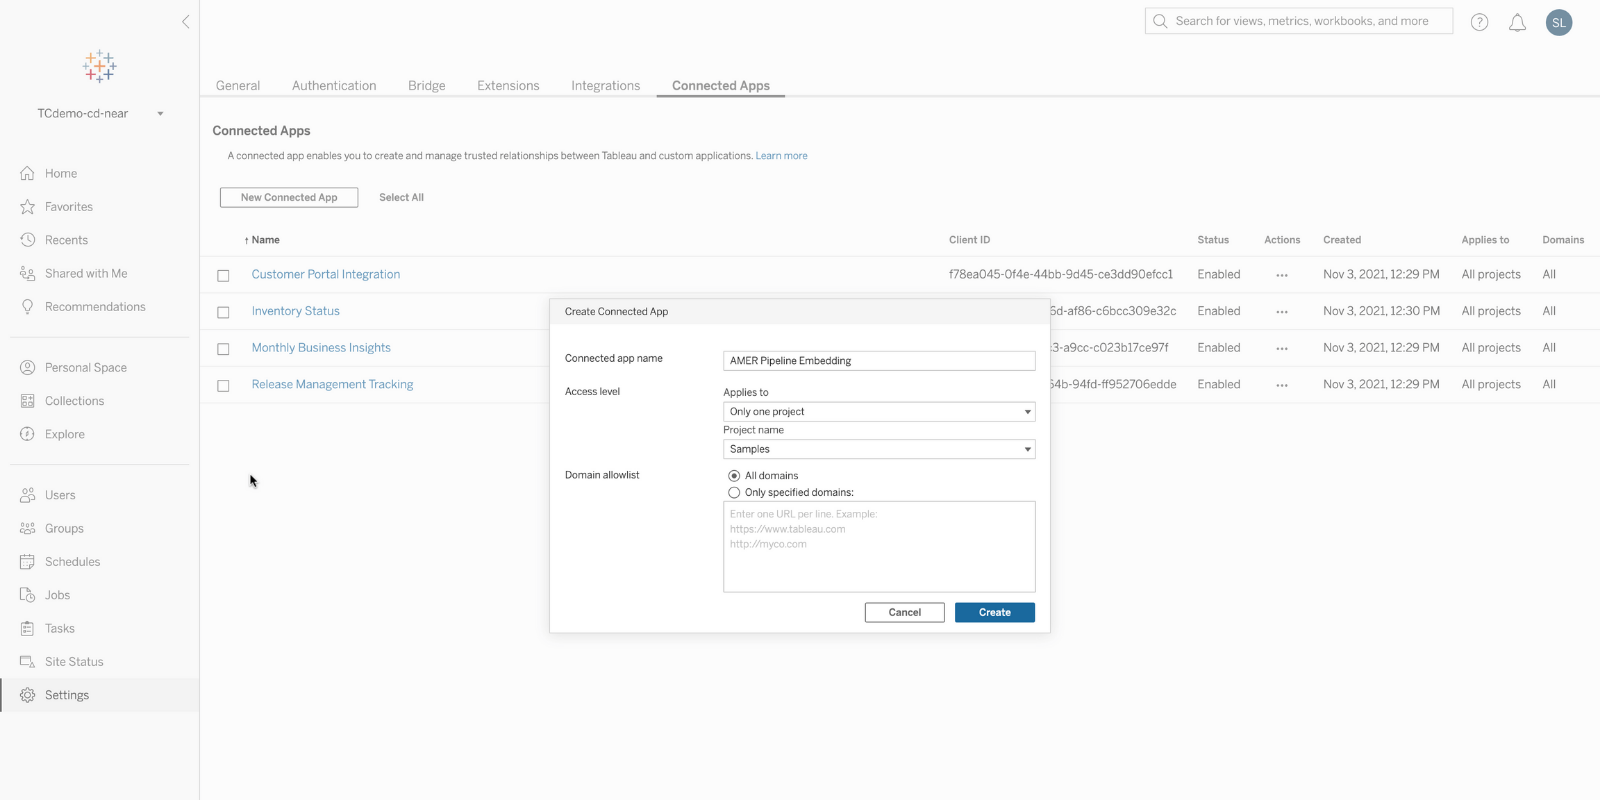
Enjoy a flexible way to integrate Tableau into your broader technology stack. Connected Apps create seamless and secure experiences with simple and trusted relationships between your applications and Tableau using modern, secure, easy-to-use authentication services.
With Connected Apps, Tableau admins have better control over security. You can set up a trusted relationship between Tableau and any external third-party application servers that use standards to embed a Tableau visualization without requiring users to log in to Tableau. Additionally, you can control user access to embedded content and restrict what content can be embedded.
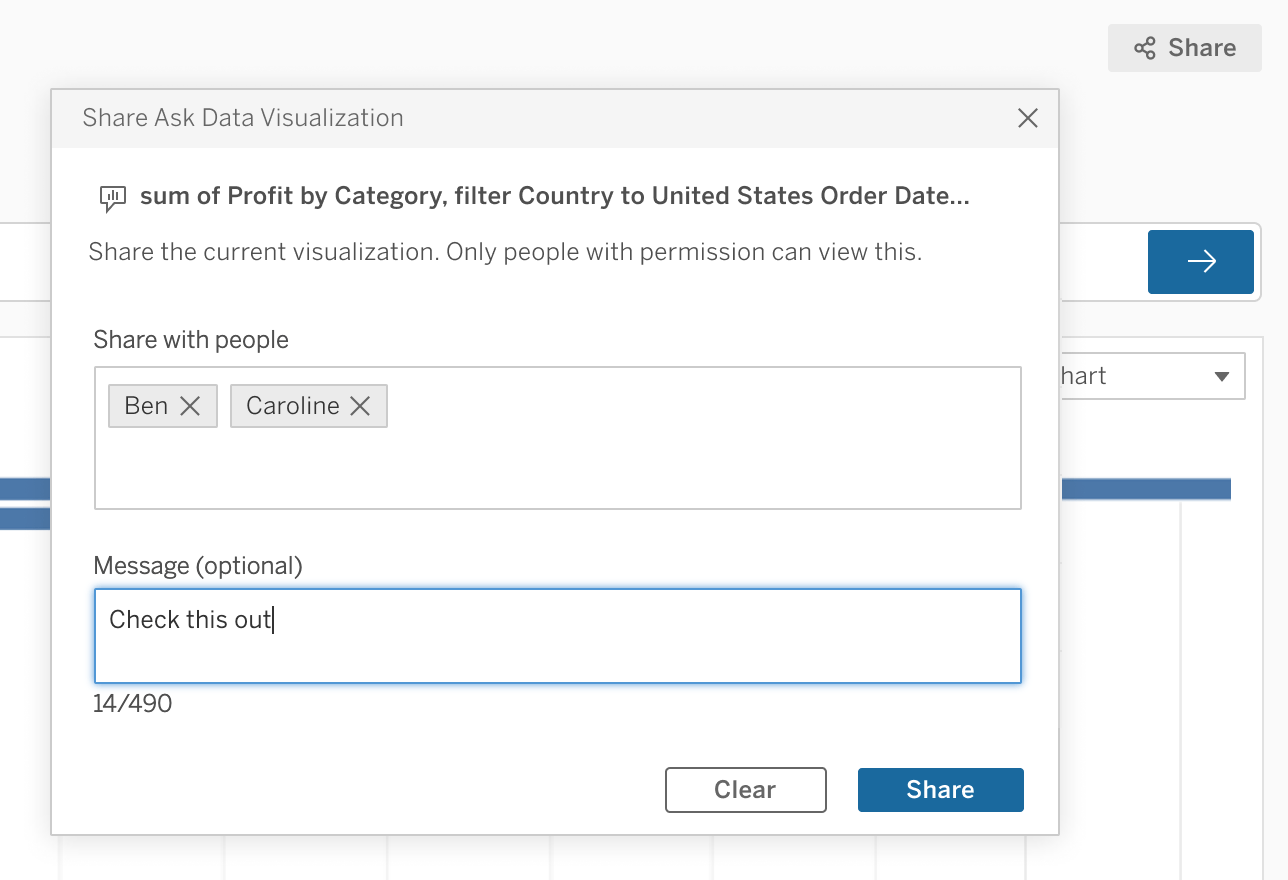
Ask Data and Slack integration
21.4 brings improved Slack integration to further broaden the reach of analytics across your business. You can now share a viz generated in Ask Data in Tableau directly to Slack, making it even easier to share insights with your team mates.
Centralized Row-Level Security
Centrally define and manage row-level security among Data Tables and have it consistently applied across all connected Tableau Flows, Data Sources, or Workbooks that depend on that data.
Edit published data sources
Managing data sources on the web just got easier. Say goodbye to downloading published data sources to Desktop to make your changes. You can now edit published data sources directly in Tableau Server and Tableau Online, test your changes, and publish—all without leaving the browser.
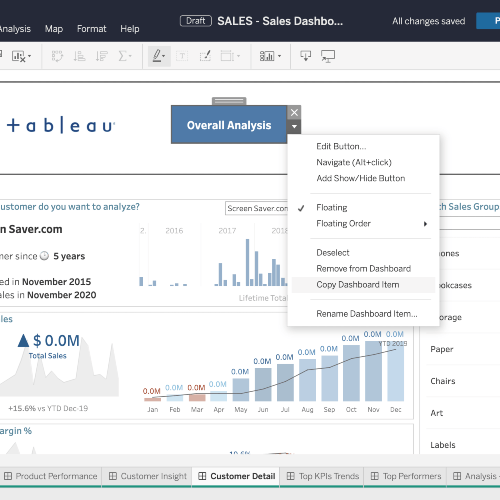
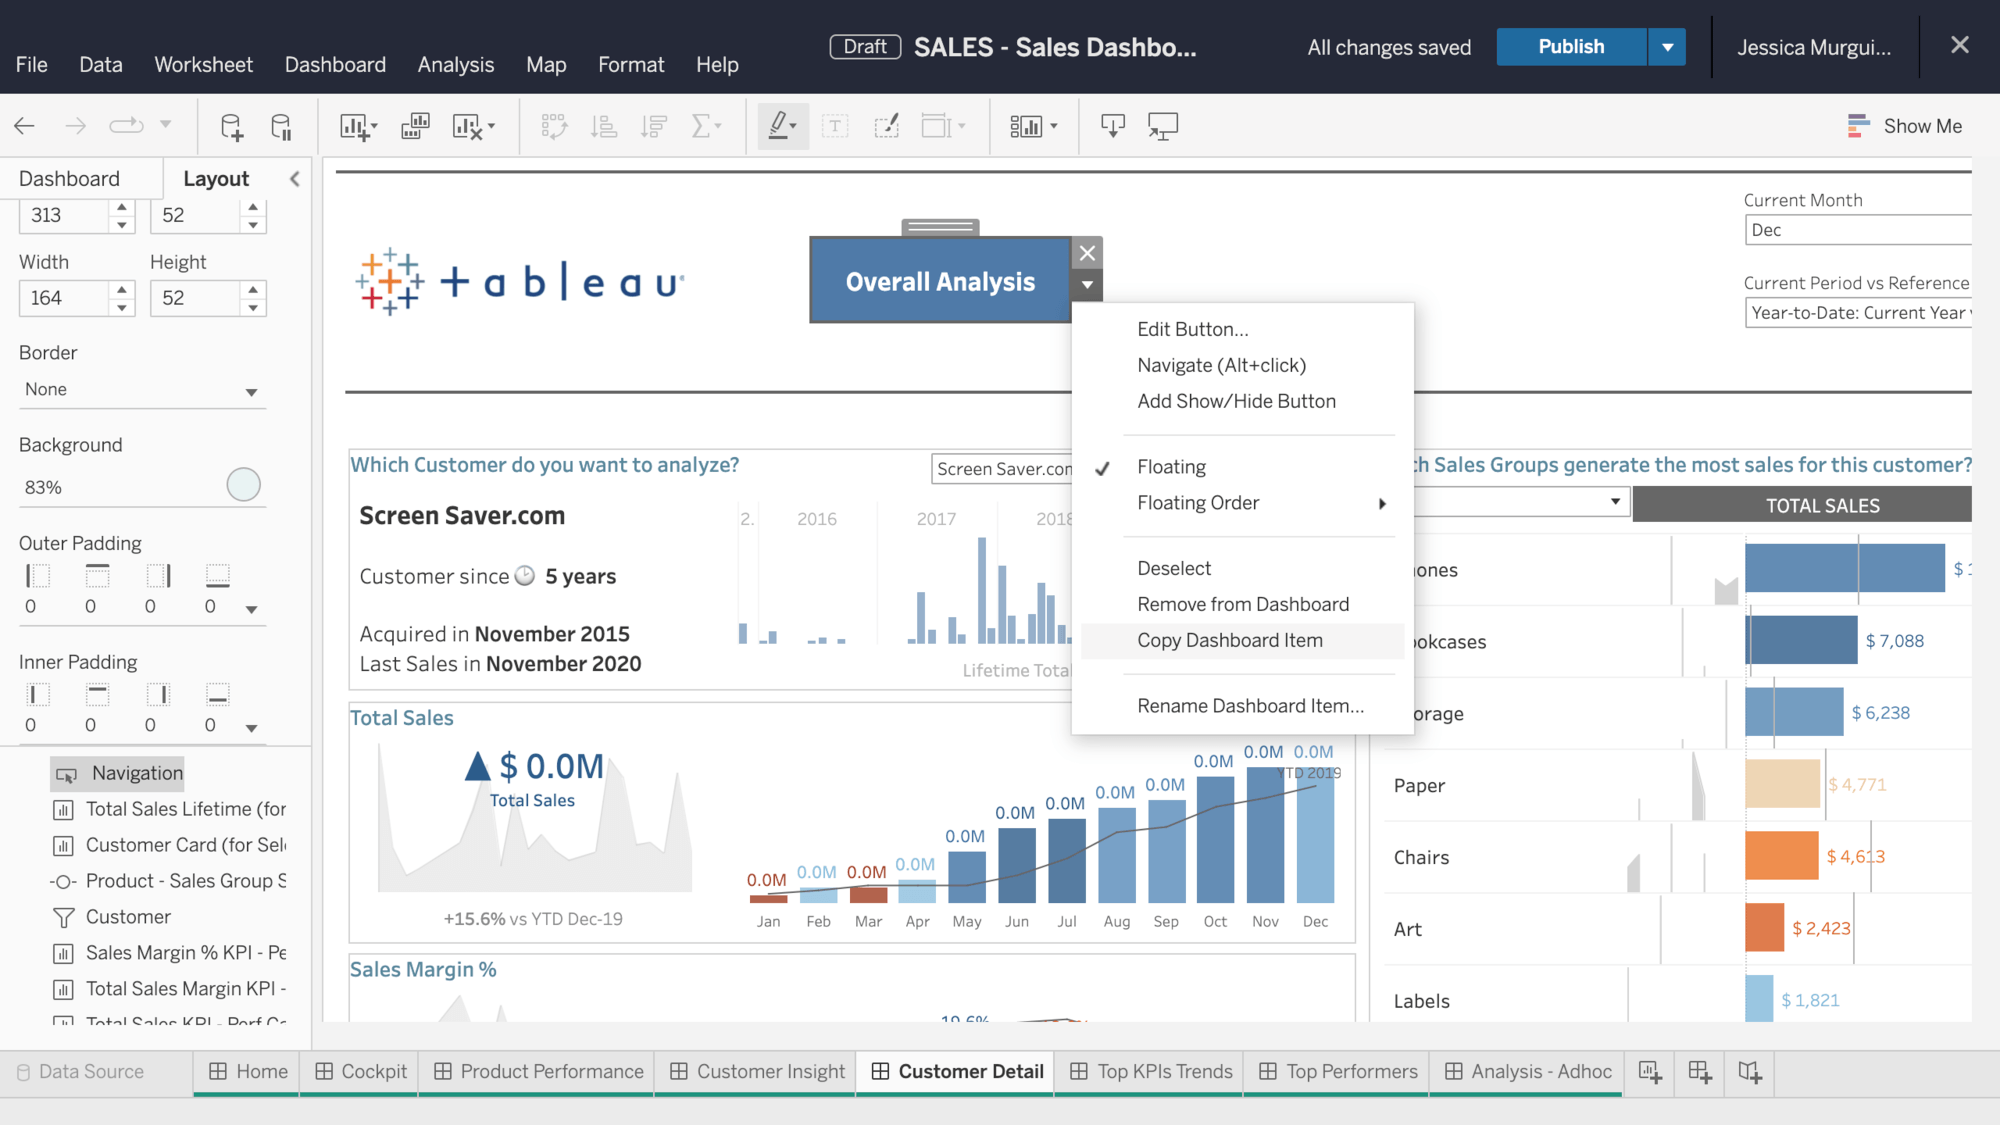
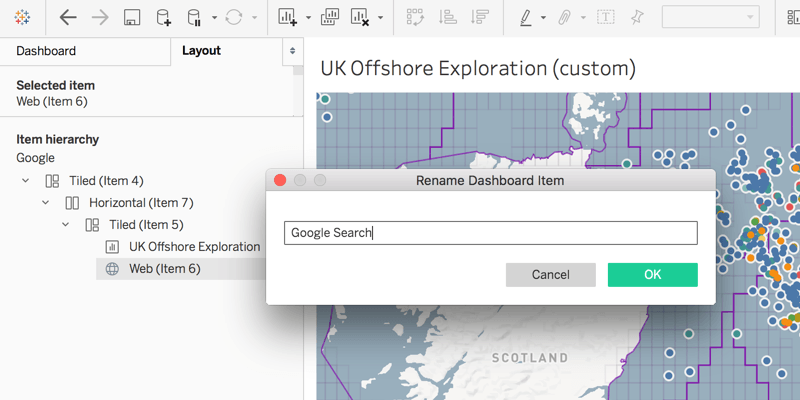
Copy and paste in dashboards
Easily copy and duplicate images, text boxes, and web page containers within the same and across different dashboards and workbooks in Tableau Online, Tableau Server, and Tableau Desktop. This new functionality allows you to build beautiful customized dashboards faster by maintaining and replicating the format, size, and details of already formatted items.
Tableau 2021.3
Tableau 2021.3 is here with new capabilities to bring efficiency to your workflows and organization at scale, so that you and your team can move faster and make more effective business decisions. Highlights include updates to Data management, Tableau notifications for Slack, and Personal Space on Tableau Server and Online.

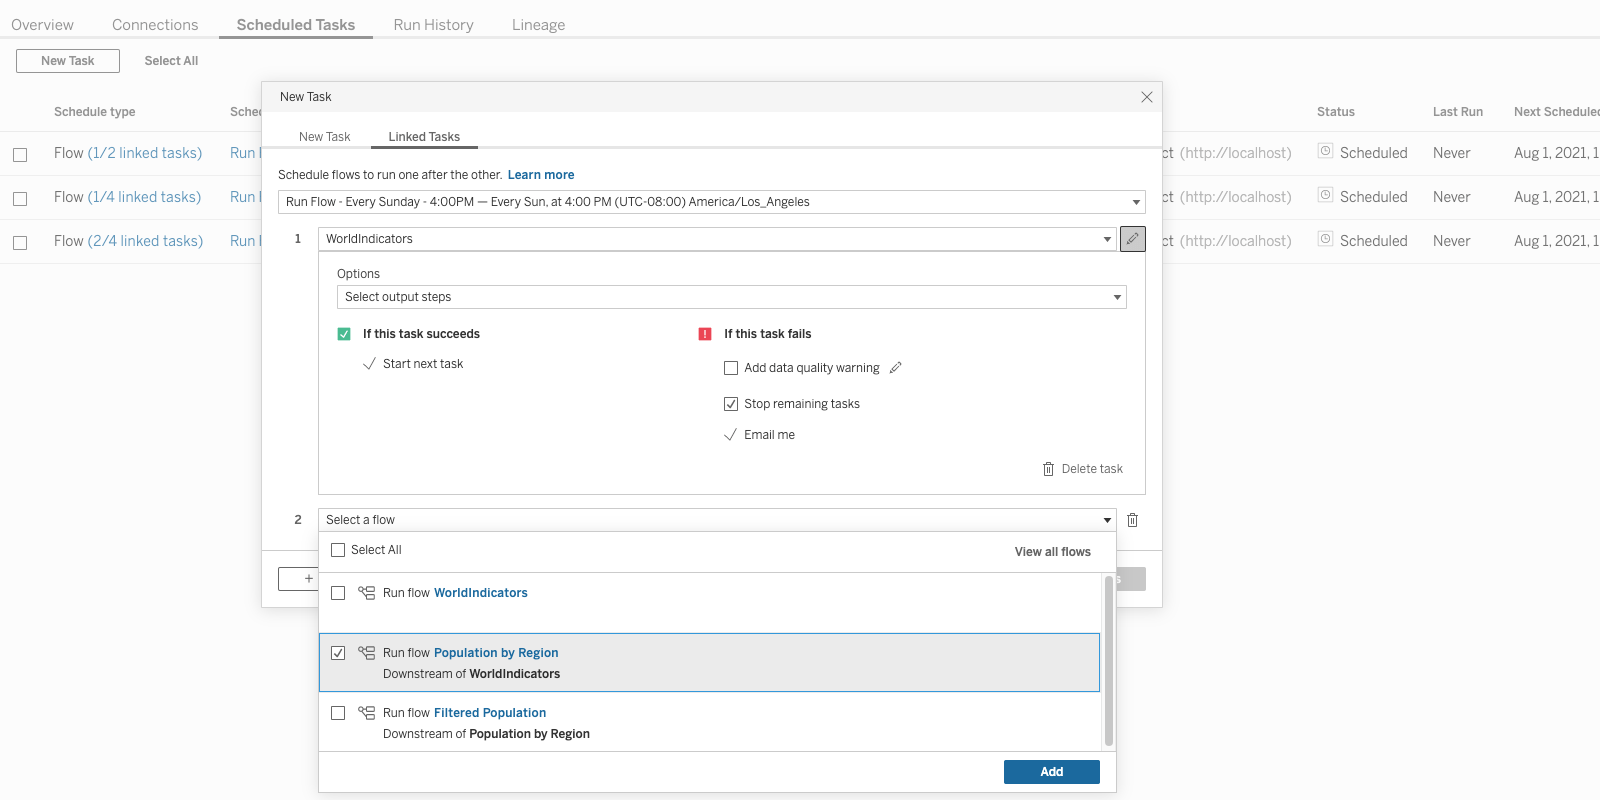
Linked tasks with Tableau Prep Conductor
With Linked tasks in Tableau Prep Conductor, you can now schedule flows to run after one another on Tableau Server. Easily automate the orchestration of multiple flow jobs, ensuring they happen in sequence after each task completes successfully.
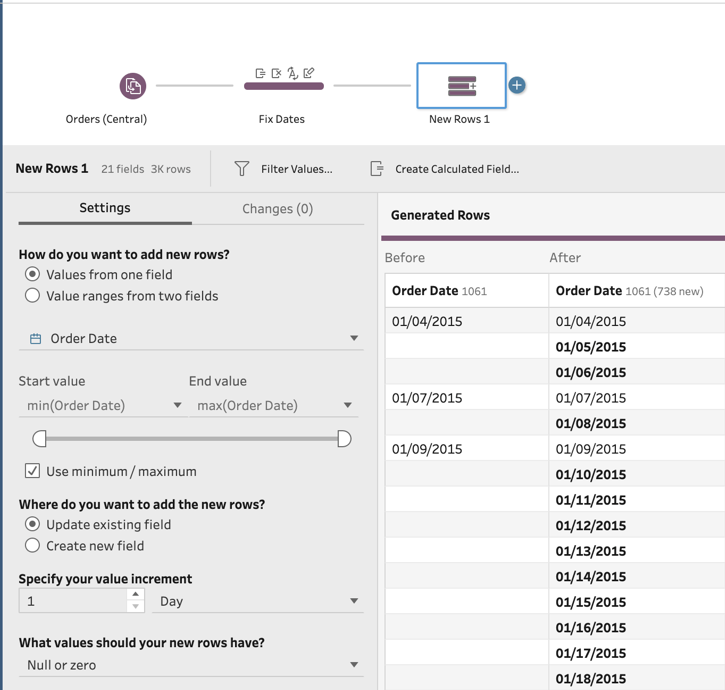
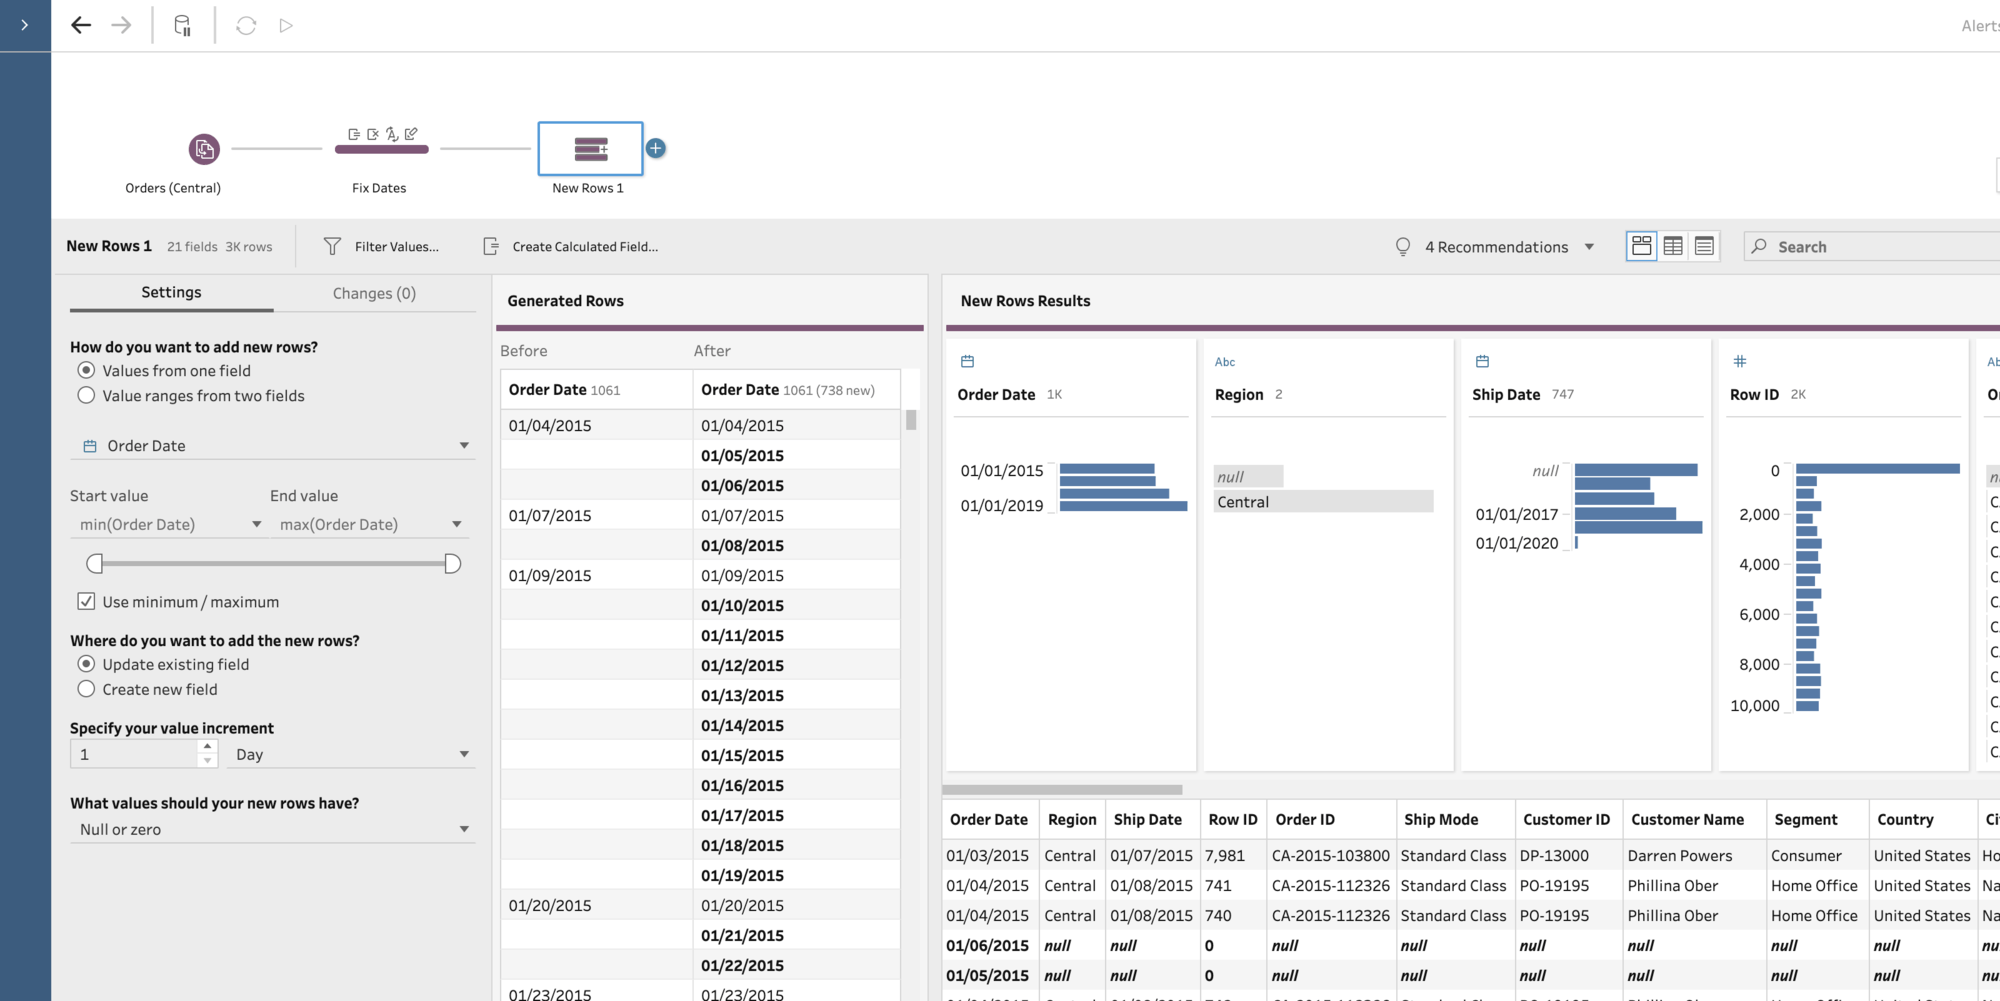
Generate rows with Tableau Prep
Generate a set of missing rows in a table with Tableau Prep based on dates, date times, or integers. Easily fill gaps in data to ensure downstream processes have full and complete datasets to work on, and build more accurate visualizations.
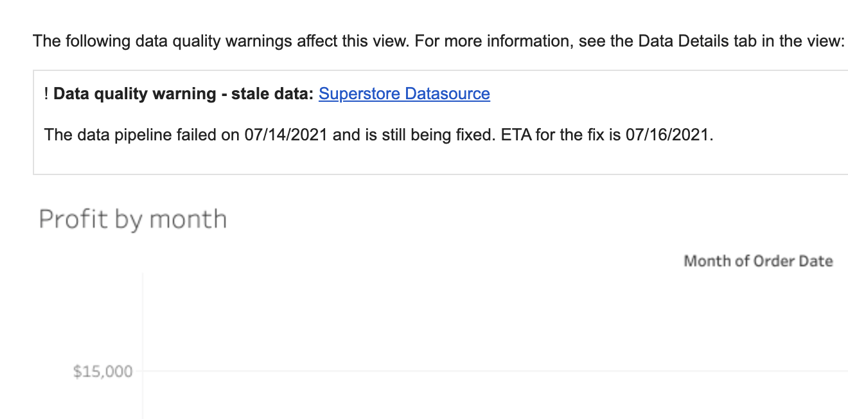
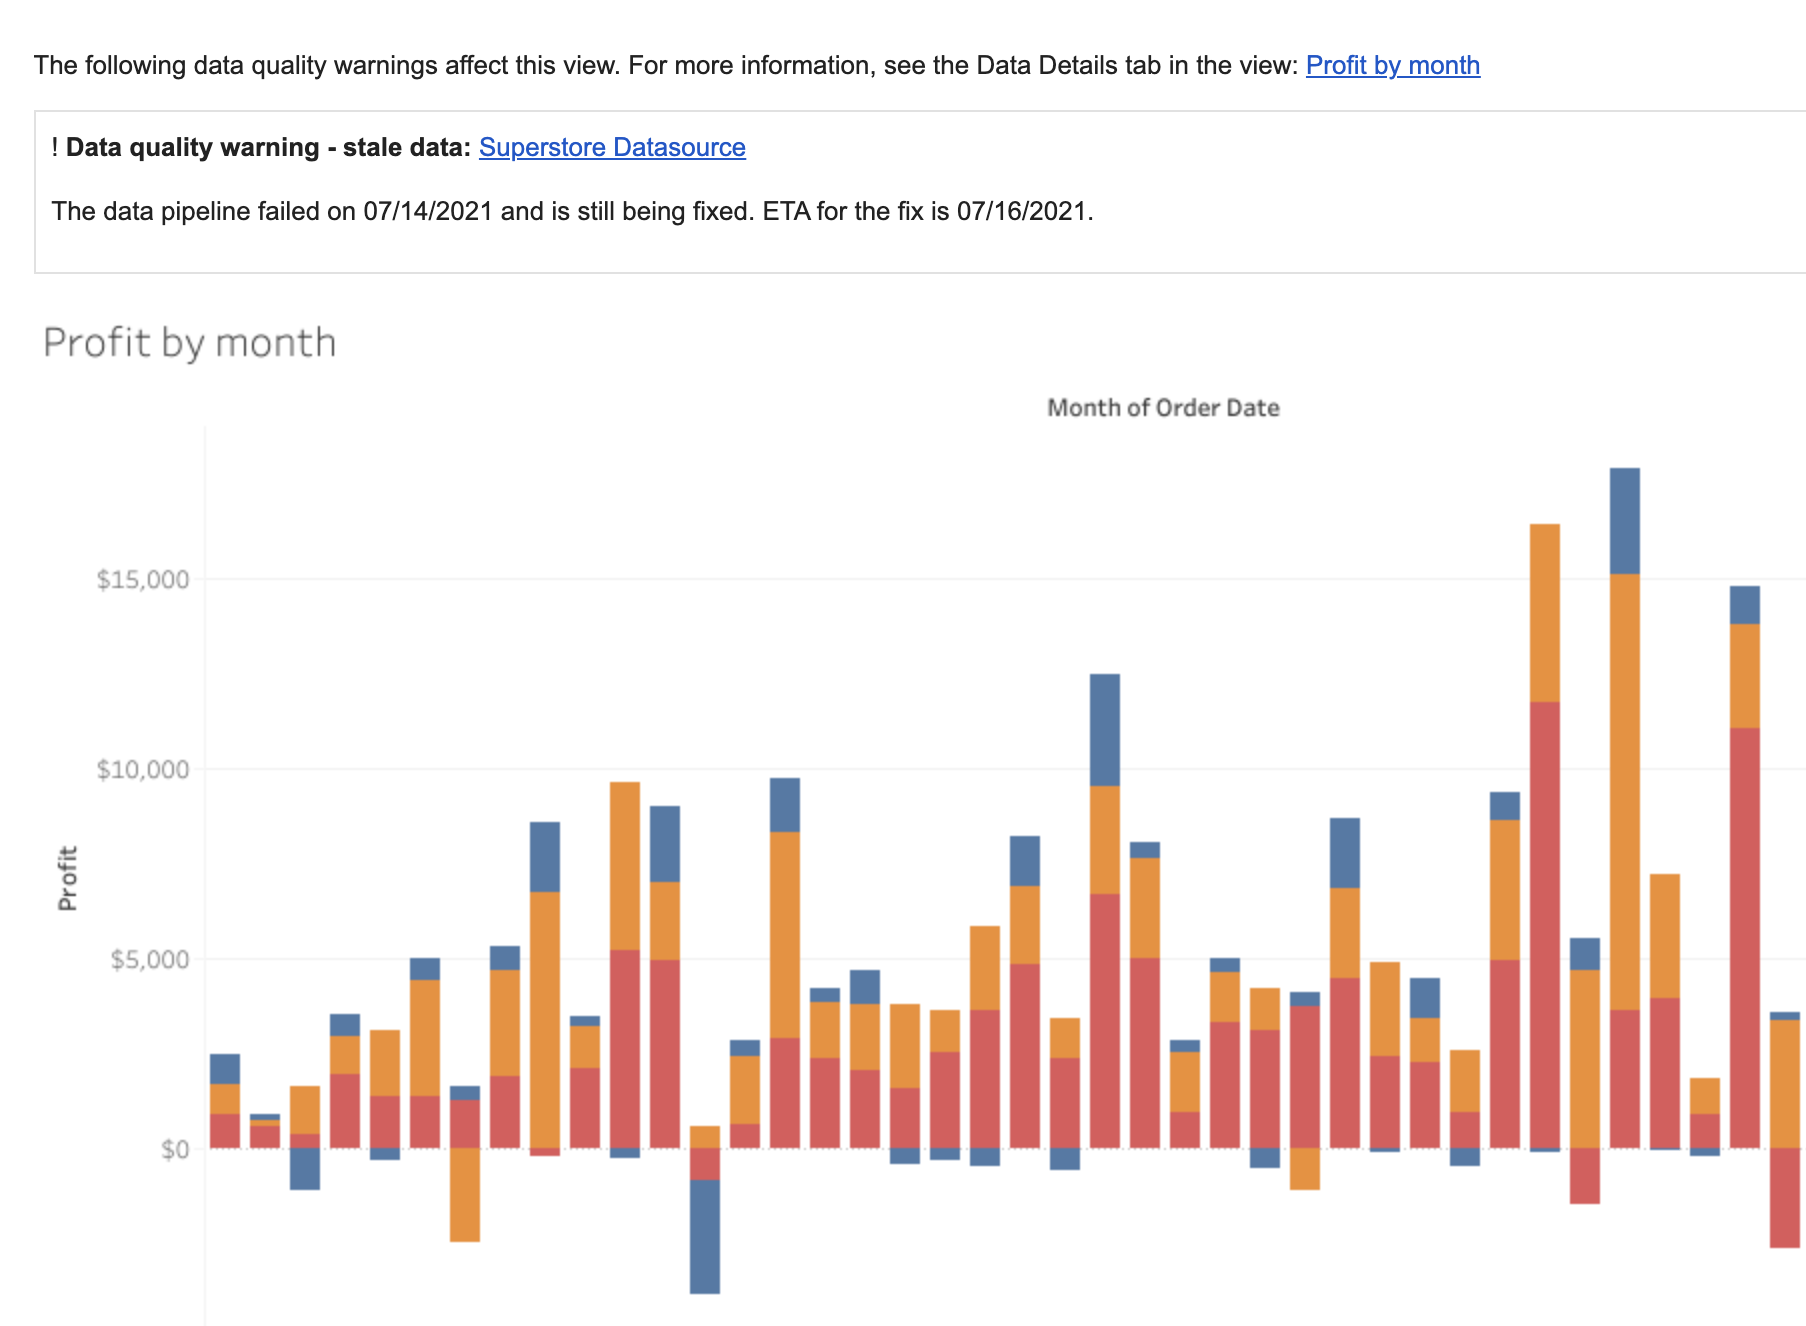
Data quality warnings in subscription emails
Get notified about potential issues with data through Data quality warnings (DQW) directly in email subscriptions. Simply click on the link in the email to go directly to the dashboard impacted by the warning, and see additional details right away within the Data Details panel.
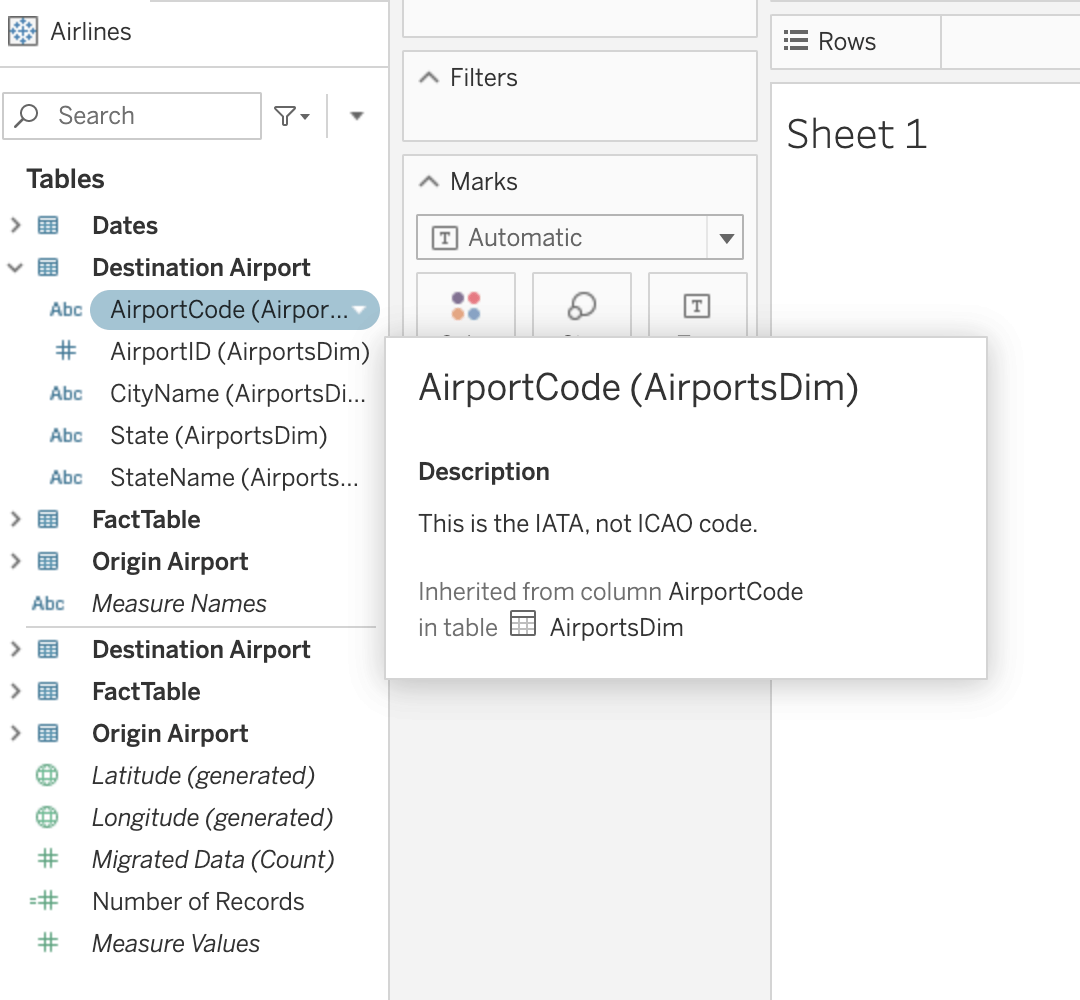
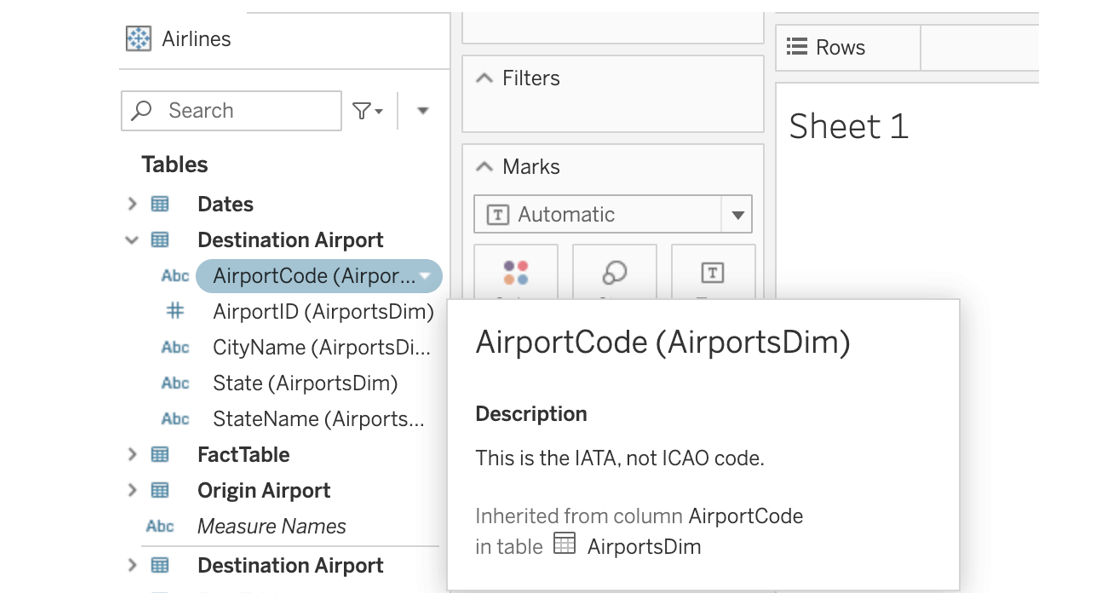
Inherited descriptions in web authoring
With Tableau Catalog, you can now see inherited descriptions right within your web authoring flow. If a description for a field or a column exists upstream from that field or column in a data source or a workbook, you'll be able to see information about where the description is inherited from.
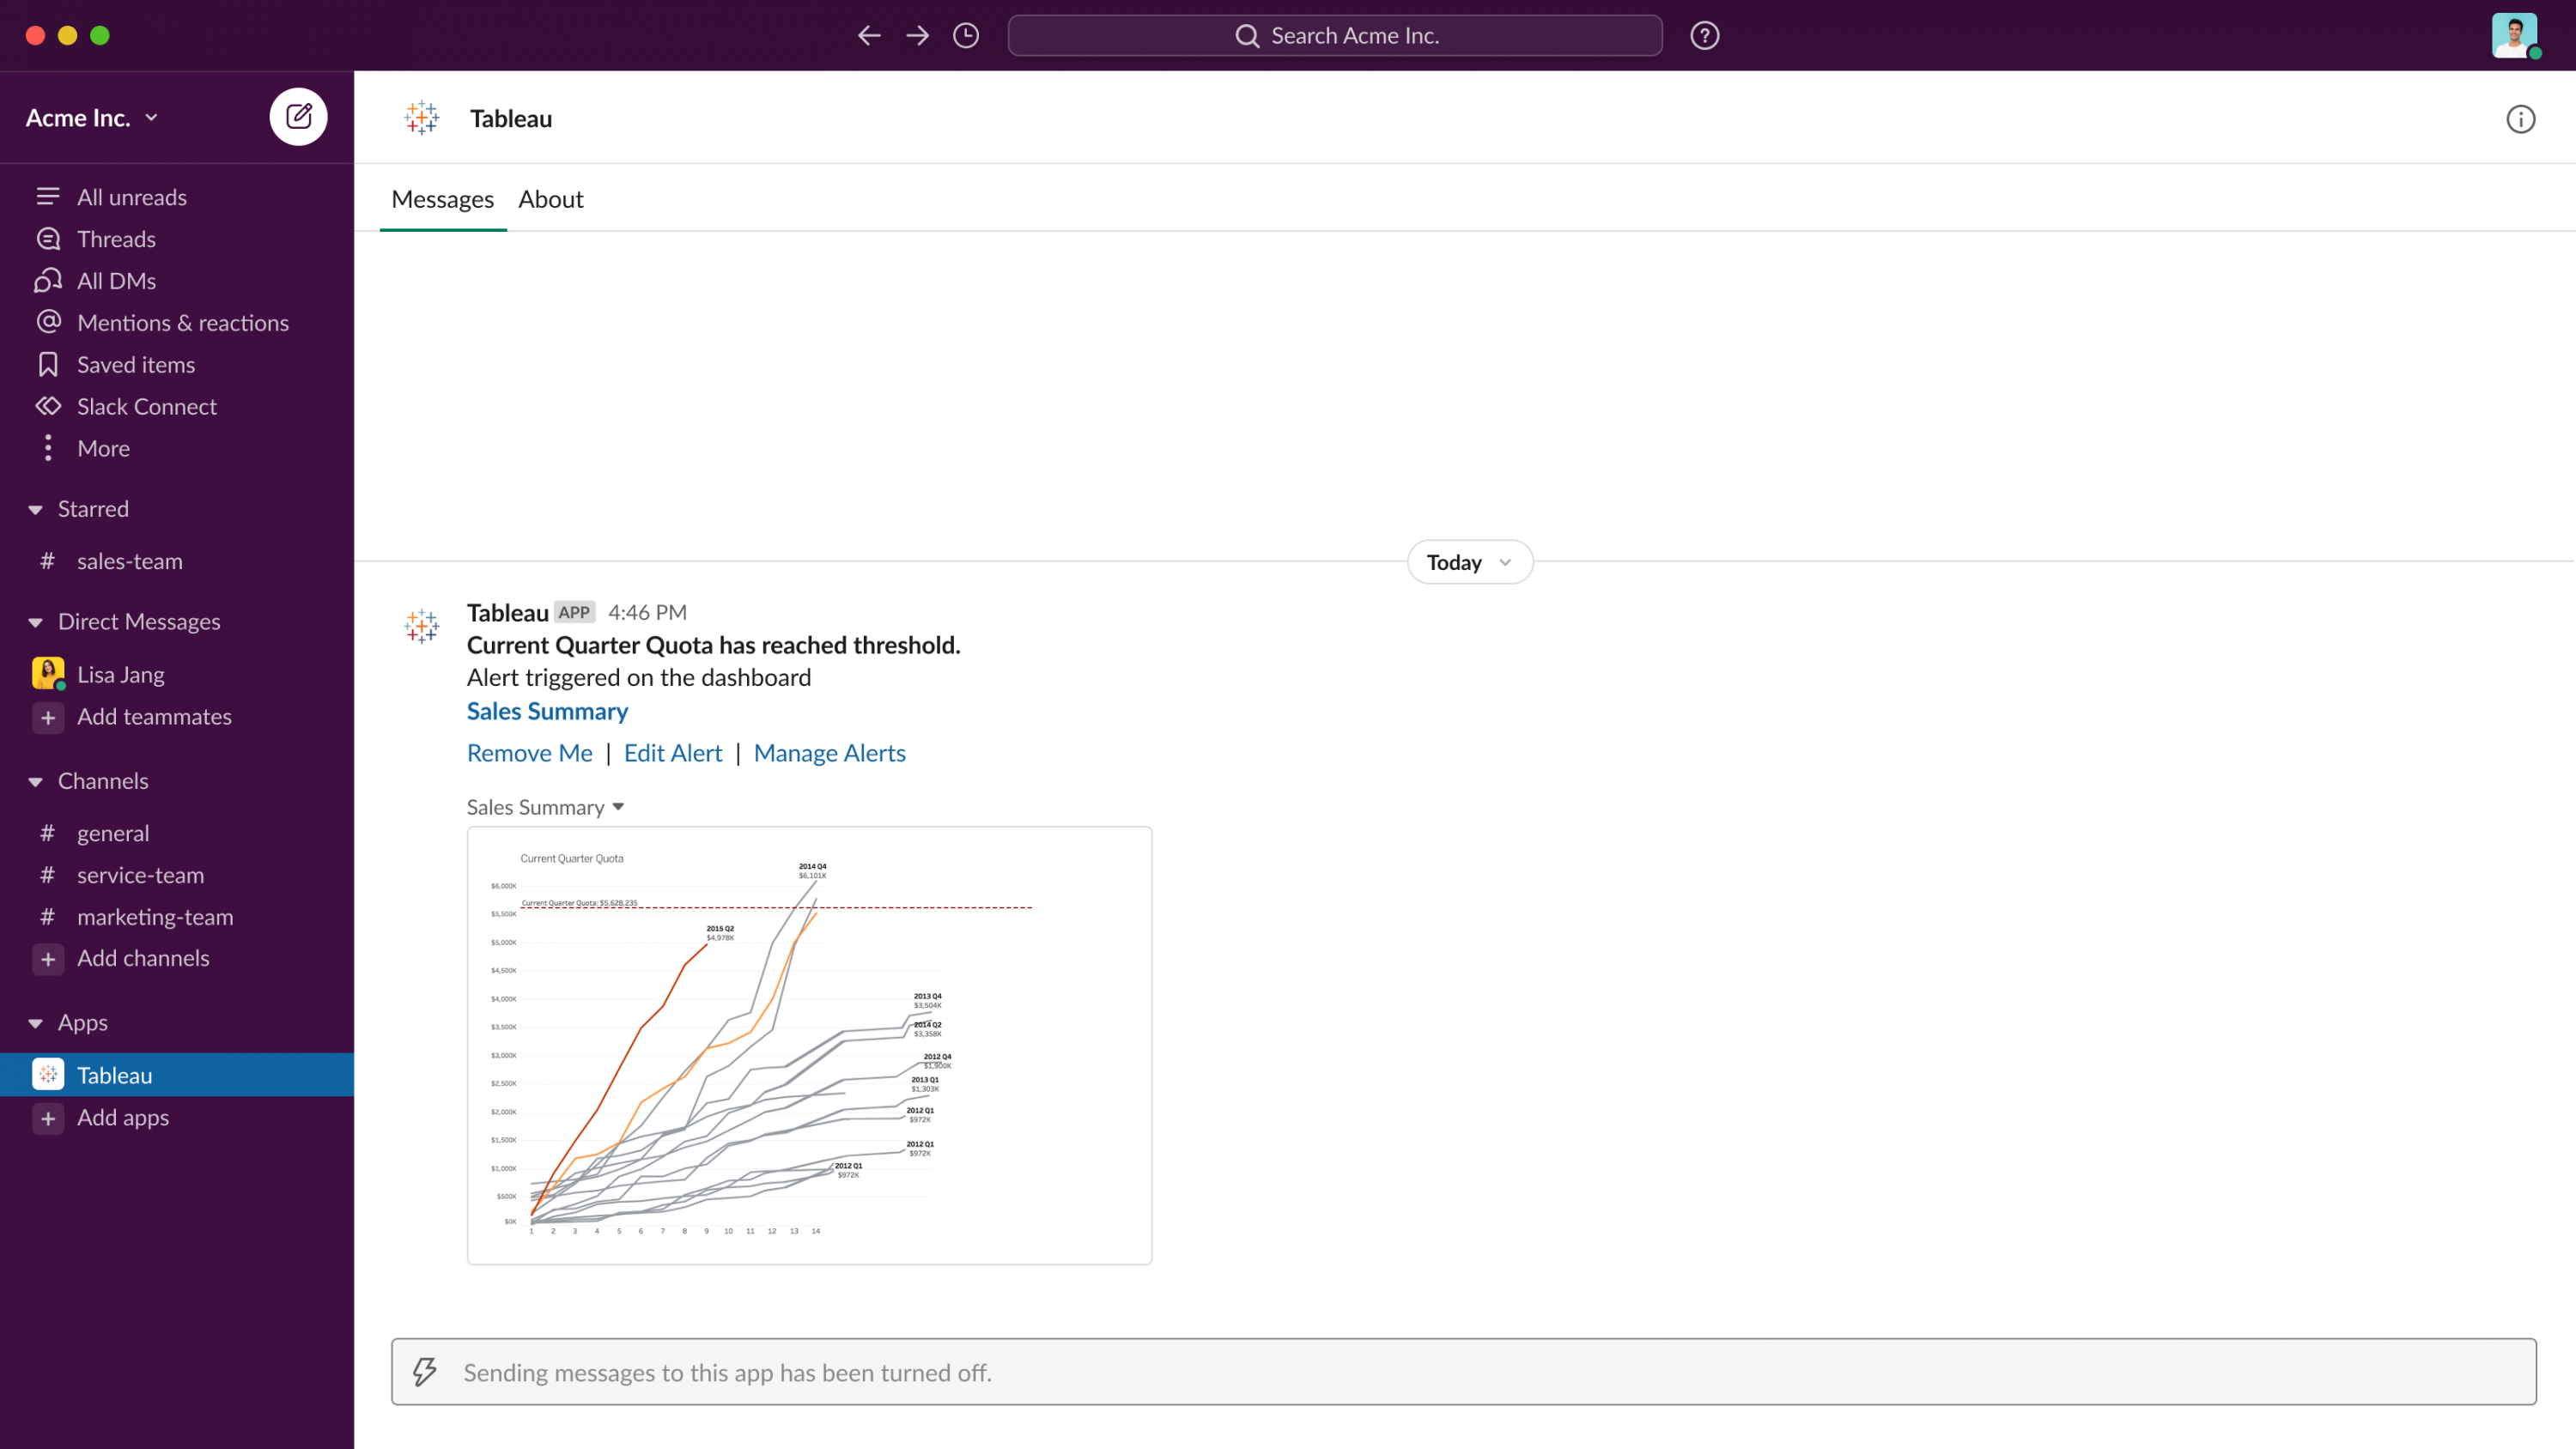
Tableau Notifications in Slack
With Tableau for Slack, you can stay up to date on all of your data from anywhere. With our new product integrations, you can now get notified directly in Slack for data-driven alerts, when you are @mentioned in a comment, or when someone shares content with you in Tableau.
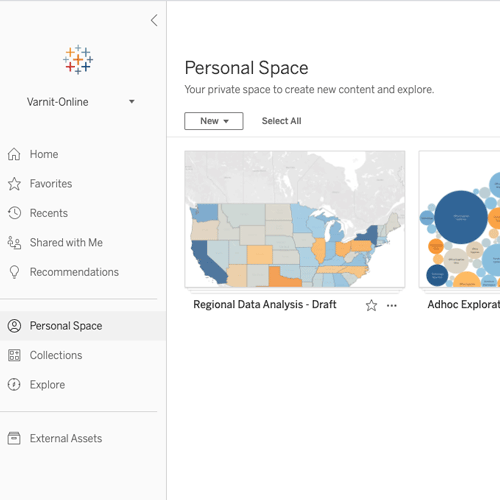
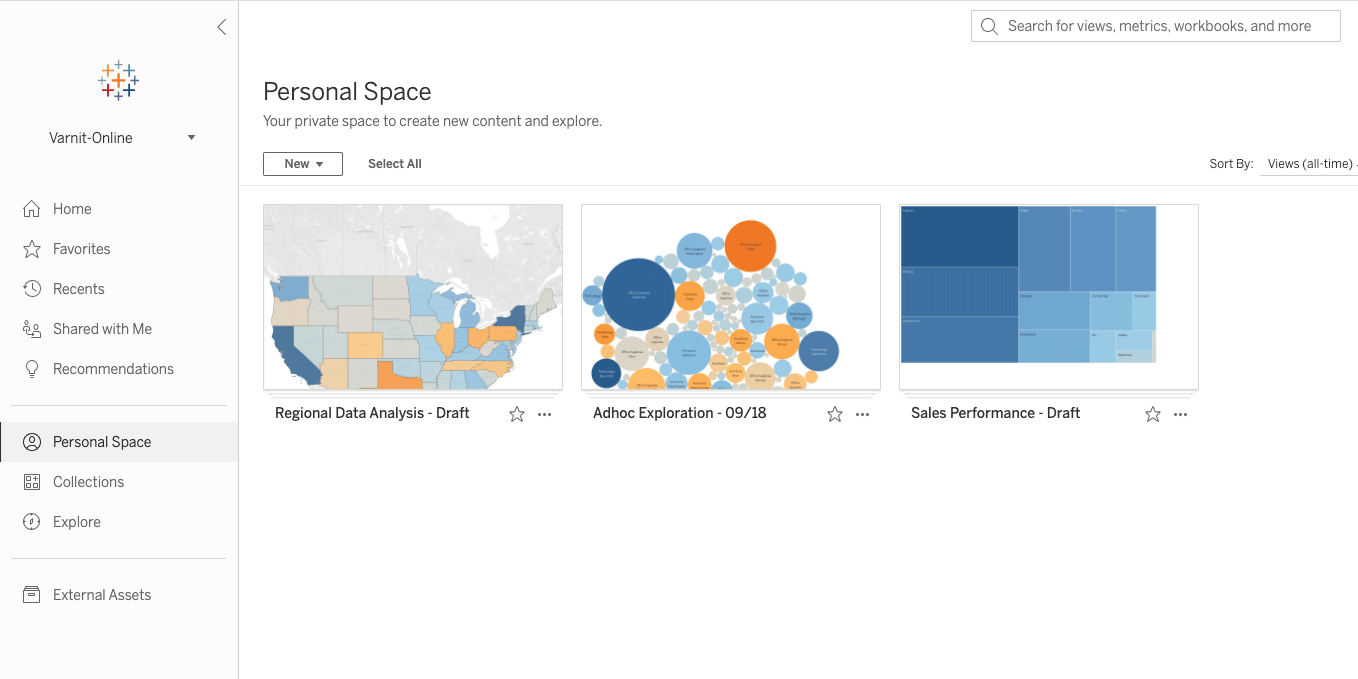
Personal Space
Personal Space is a new, private location on Tableau Server and Online where users can save content before it’s ready to be shared with others. Users can feel comfortable exploring data and staging workbooks in their own dedicated space, and admins no longer need to create private projects for every individual to achieve this on their site. Personal Space is available to any user with an Explorer or above license.
Tableau 2021.2
Tableau 2021.2 brings the power of data to everyone across your organization so that anyone can ask questions and get answers from their data. Highlights include new experiences for Ask Data and Explain Data, Collections, and a connected Tableau Desktop experience for web authoring.
Ask Data for Viewers
We’ve broadened the reach of Ask Data by making it available to Viewers. Everyone with a Tableau license can now use Ask Data! We have a completely redefined natural language experience for business users, including seamless integration into dashboards with a new dashboard button. Additionally, a new content type, Ask Data Lenses, makes it easy to curate data with definition of column and value synonyms and suggested questions so you can better leverage existing published data sources.

Explain Data for Viewers
We’ve broadened the reach for Explain Data with a reimagined user interface optimized for deeper exploration and a wider business audience. Now available for Viewers, Explain Data makes it easier for anyone to explore and interact with data. When you select a mark and run Explain Data, Tableau proposes possible explanations for that mark based on statistical models. Explain Data gives you a jumping-off point to help you explore data more deeply and ask better questions.
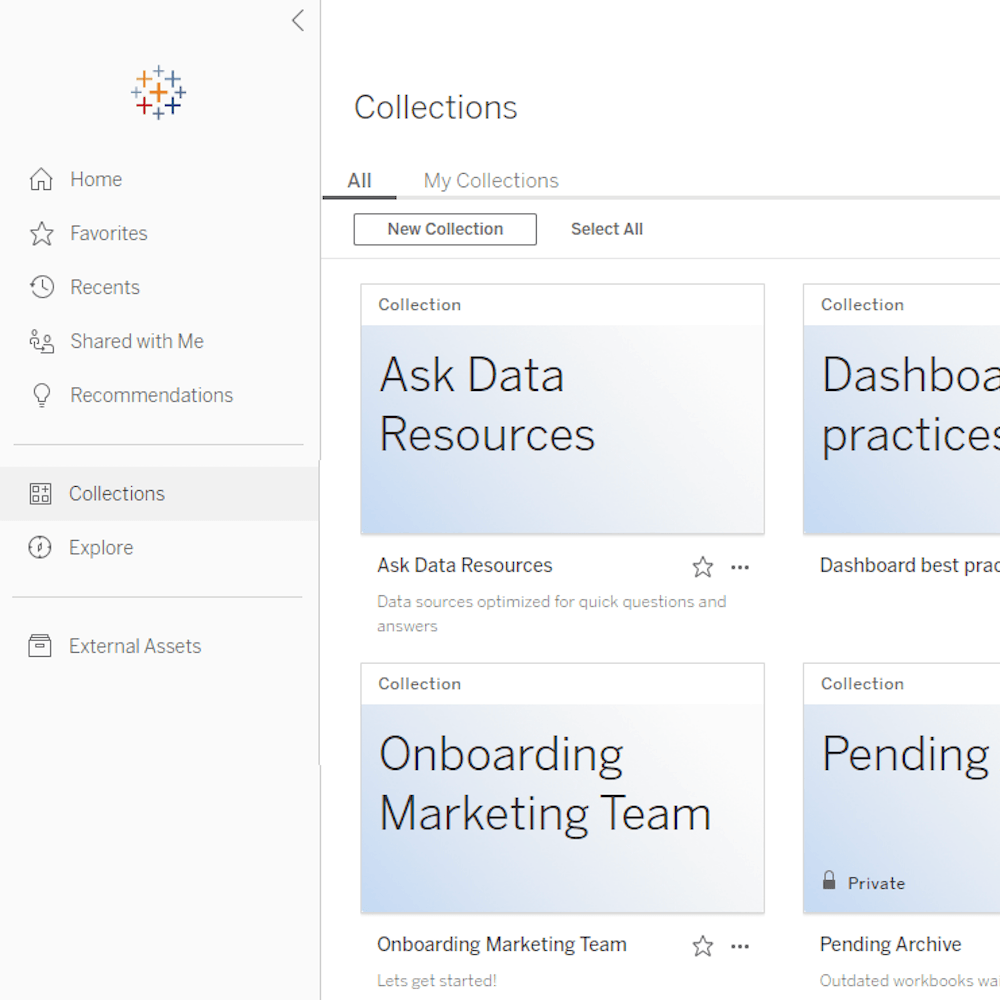
Collections
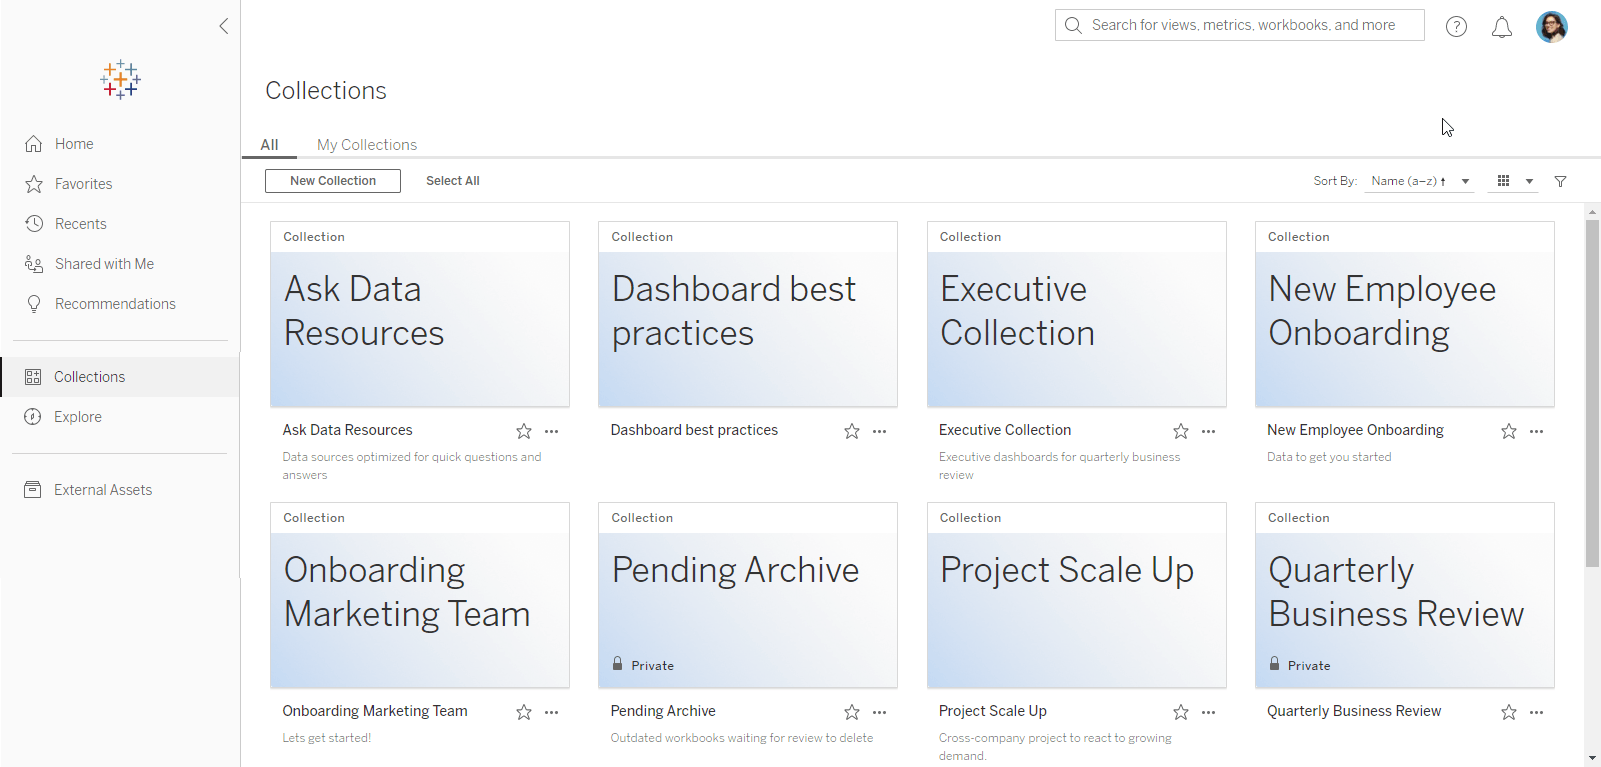
Finding the data you need for your analysis has never been easier. Collections are a new way to gather the content from across your site on Tableau Online or Server and organize it to fit how you use it. Collections can contain items that span different projects and workbooks, allowing you to reuse content in multiple contexts without additional storage or resources. And, it’s easy to organize and share content around key topics such as curated resources for new users for onboarding or a center of excellence collection that includes dashboards showcasing best practices.
Connected Desktop for web authoring
Enjoy a more cohesive and flexible web authoring experience. Creators can now transition seamlessly from web authoring to Tableau Desktop with a click of a button. Start your workflow in web authoring and choose to transition to Desktop at any point in your analysis—without having to download the workbook. When you’re finished, simply save to Tableau Online or Server so your content reflects the latest changes for others in your organization.
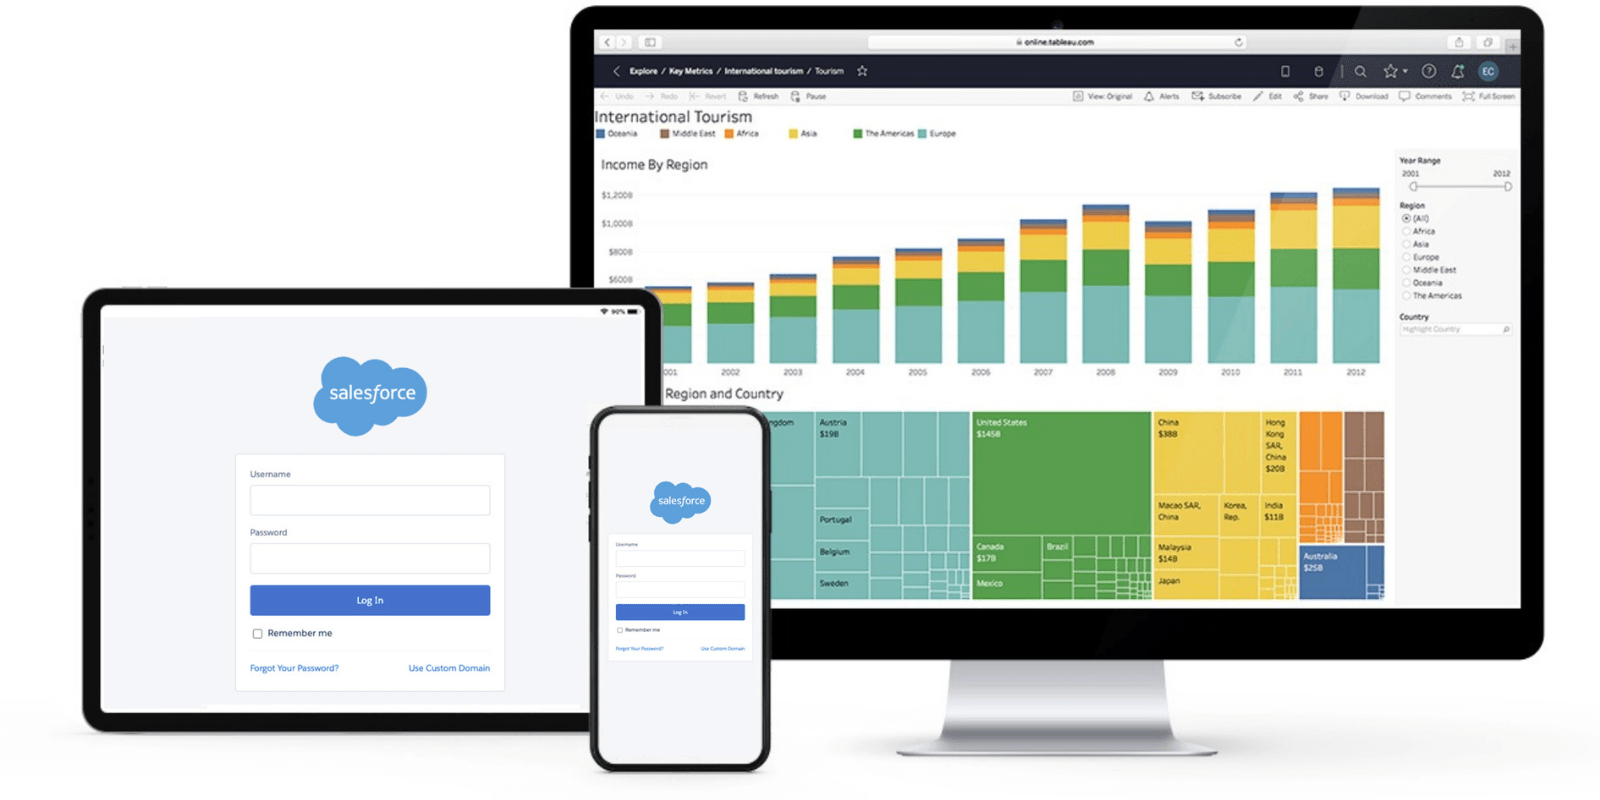
Jumpstart your Salesforce Connection
You can now log into your Tableau Online account using Salesforce login credentials, and a newly enabled Integrations Tab makes it simple to tap into and analyze your Sales Cloud and Service Cloud data—all via a ready-to-go workbook that keeps your data fresh.

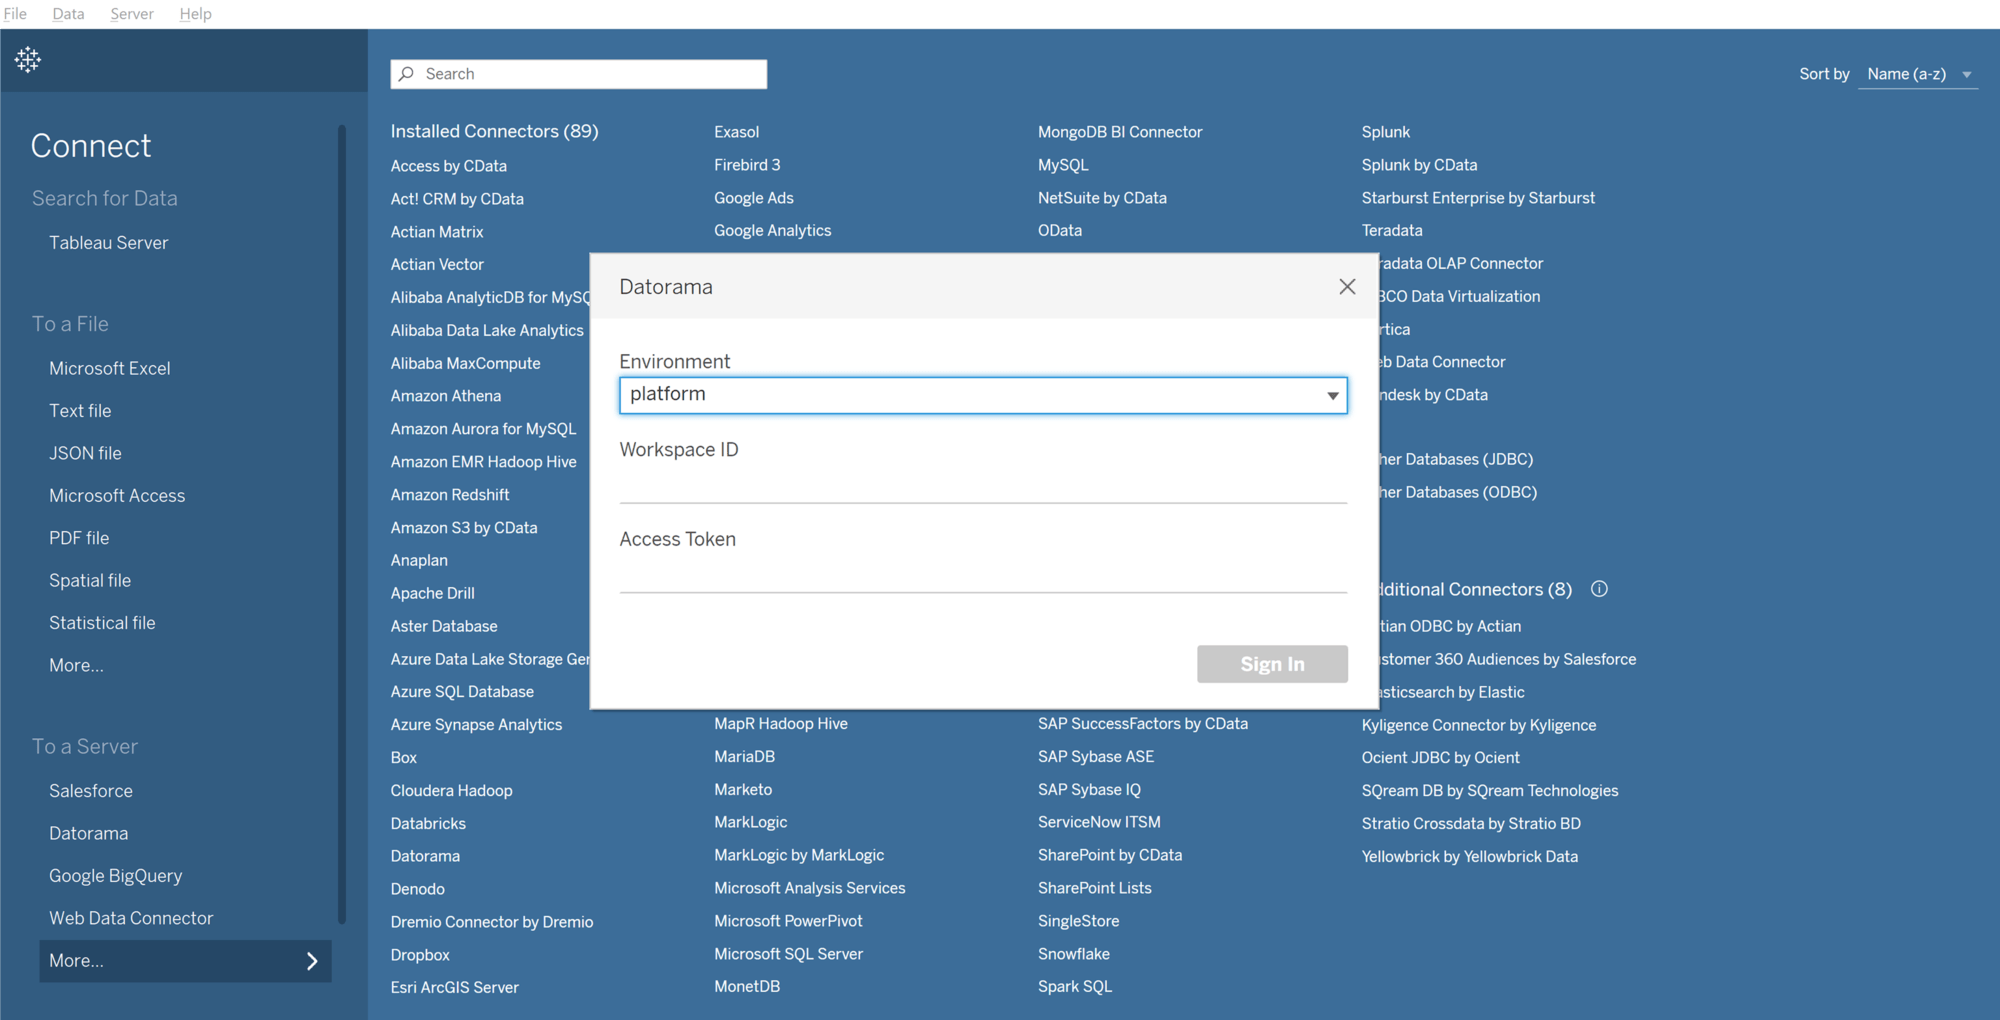
Native Intelligence Connector
The Intelligence Connector is now available natively out of the box in Tableau Desktop, Prep, Server, and Online. The Intelligence Integration connects Tableau to Intelligence, creating an easy way for customers to consume harmonized Intelligence reports in Tableau.
Tableau 2021.1
Tableau 2021.1 brings exciting functionality to help your people make smarter, faster, business decisions. Highlights include Einstein Discovery in Tableau, quick LODs, and new unified notification experience.
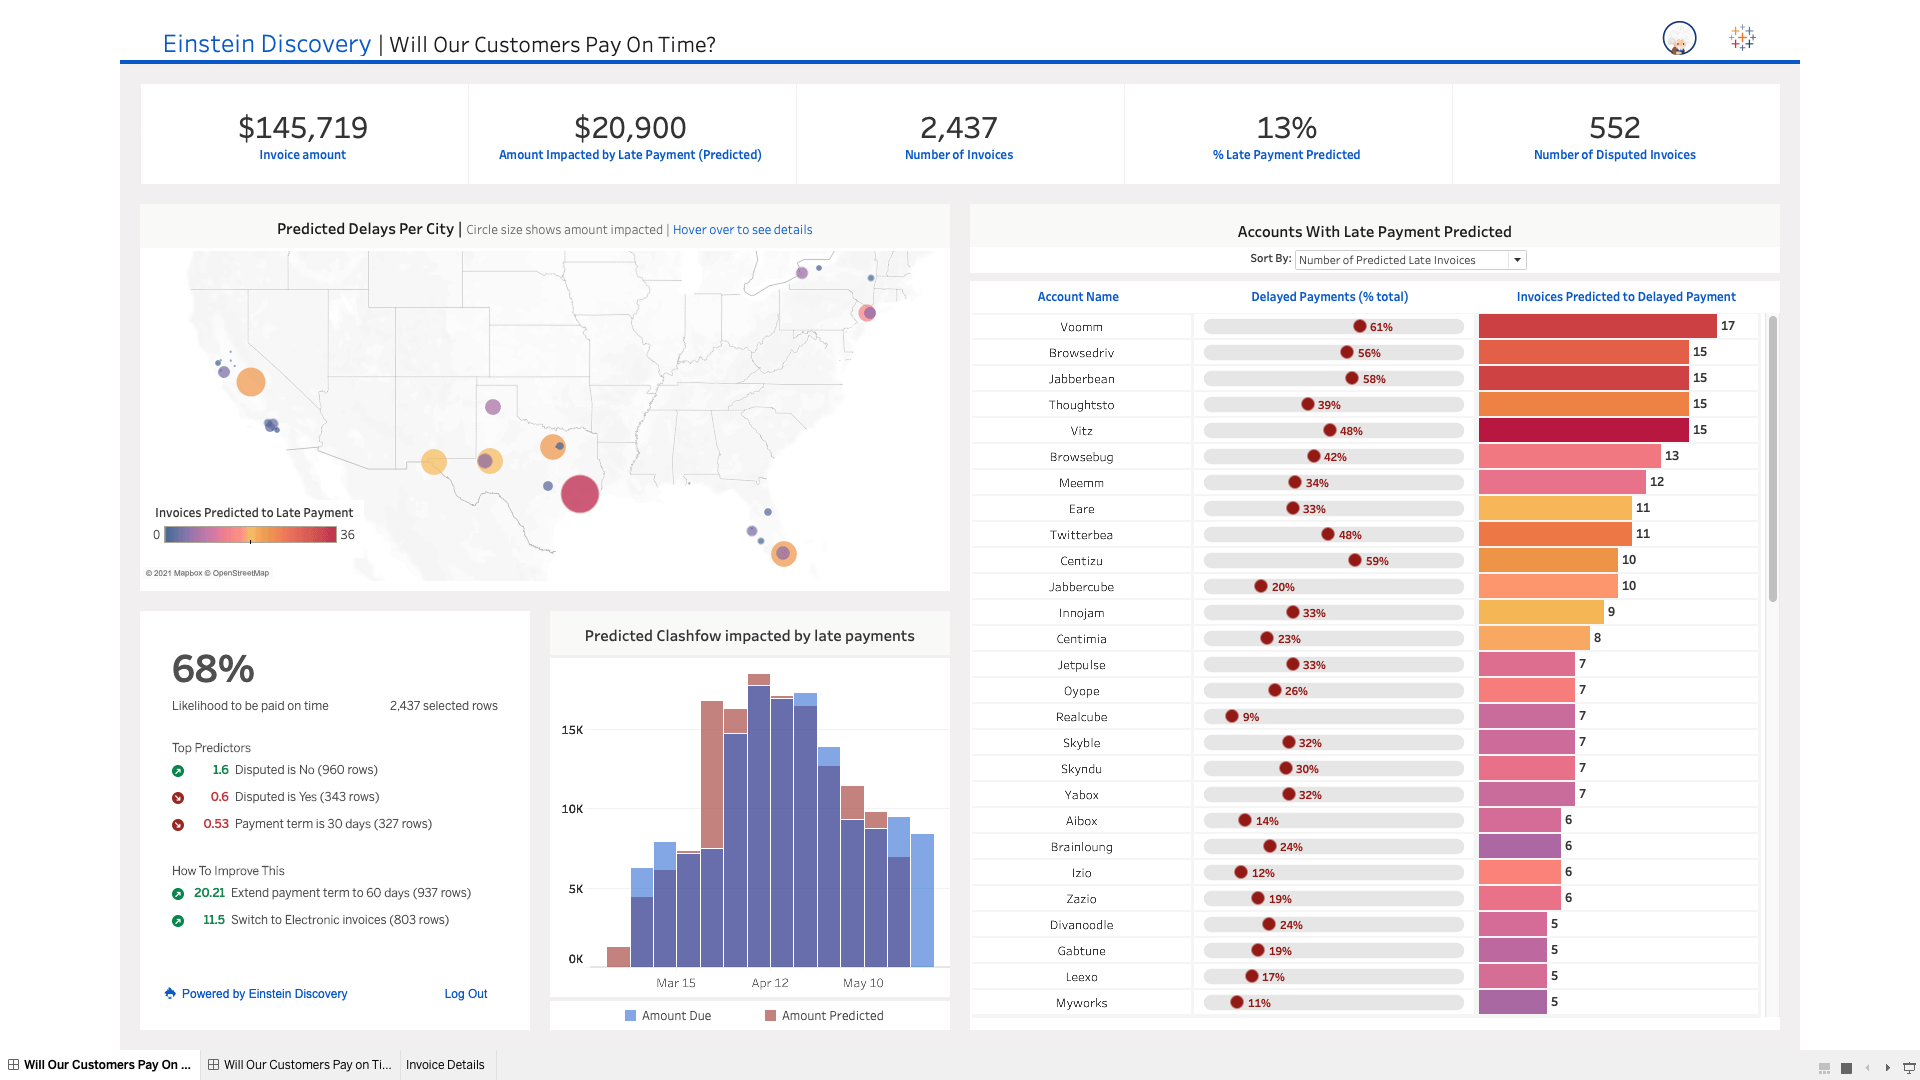
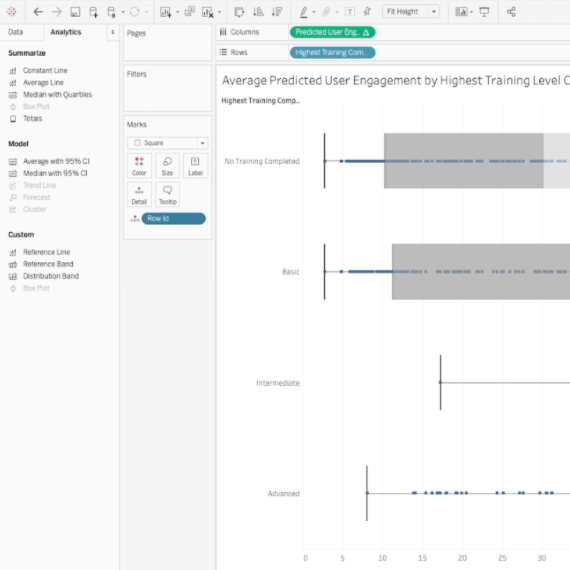
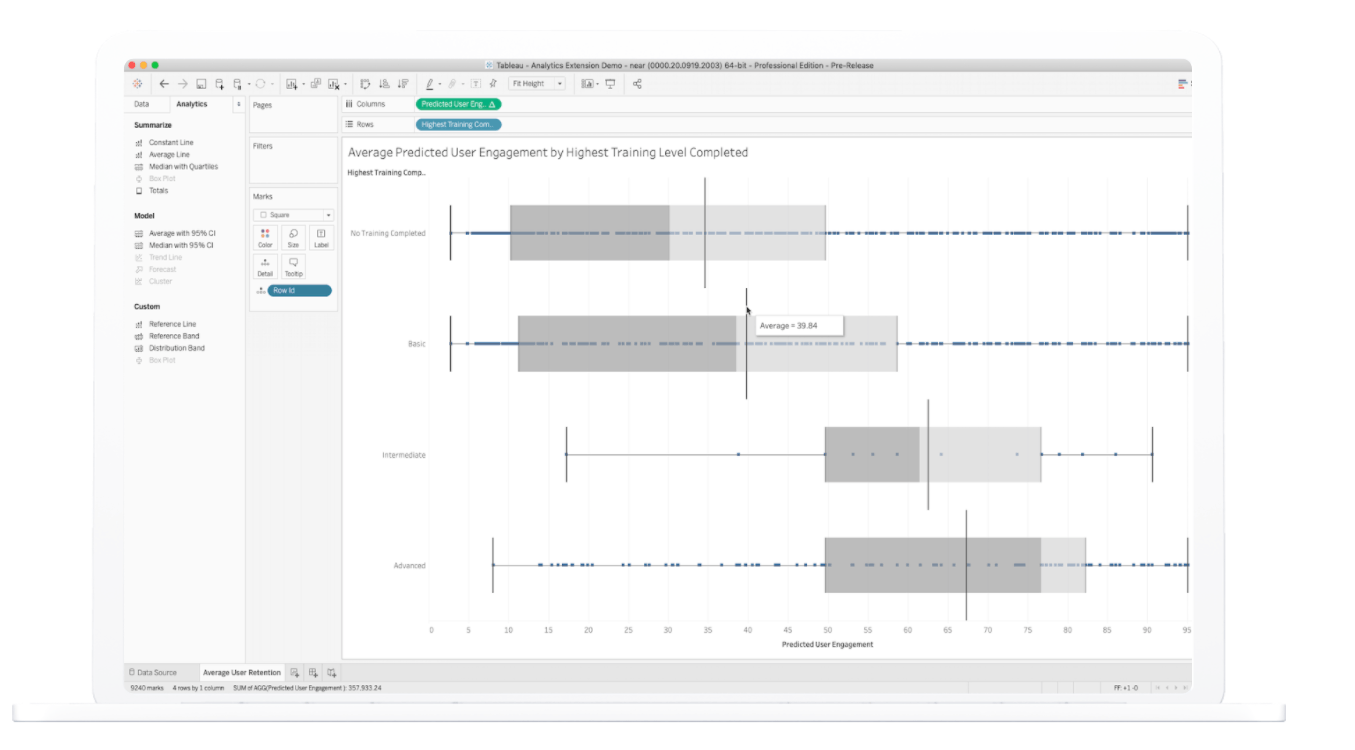
Einstein Discovery in Tableau
Einstein Discovery in Tableau brings trusted, intuitive predictions and recommendations from Einstein Discovery to every Tableau user across your organization. Get smarter, guided decisions for every team with cutting-edge, augmented analytics in a no-code required, rapid iteration environment.
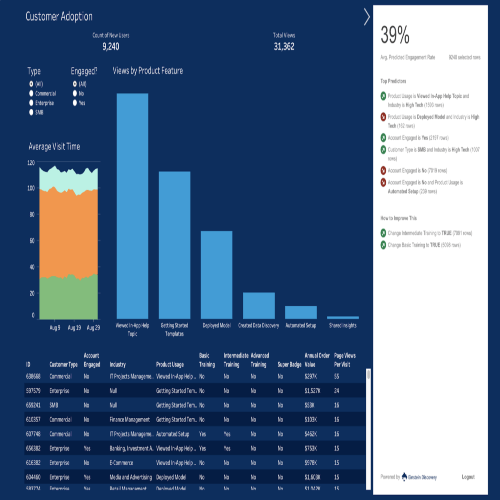
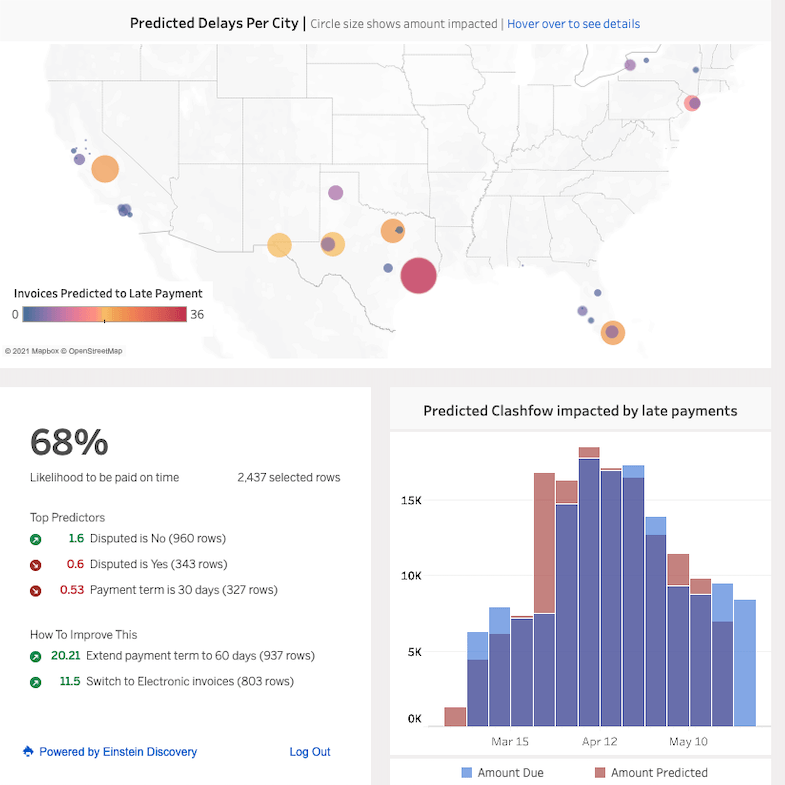
Einstein Discovery dashboard extension
Enjoy on-demand, interpretable ML predictions from Einstein Discovery natively integrated in Tableau dashboards. Users can click on one or more rows of data from a Tableau visualization to get dynamic predictions, see key drivers of predictions, and learn ways to improve predictions based on the model.
Einstein in Tableau Calcs
Feed Tableau analytics with dynamic predictive intelligence and connect Einstein predictions directly into Tableau calculated fields. Construct, share, and scale interactive visualizations and dashboards incorporating dynamic predictions using existing Tableau infrastructure, and test new scenarios using Tableau parameters. Note: Available in Tableau Desktop and Tableau Server.
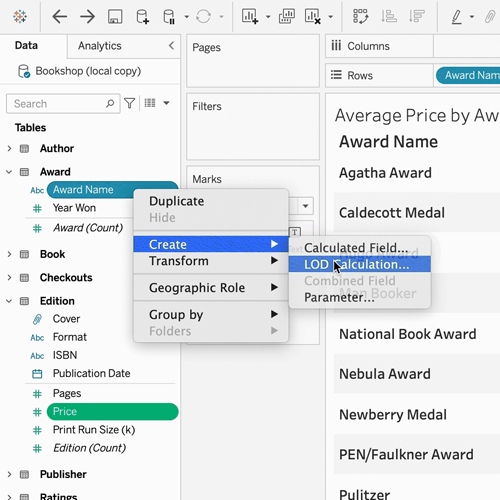
Quick LODs
Create Level of Detail expressions more easily. Use context menus or drag-and-drop a measure onto a dimension to automatically create a Level of Detail expression with the default aggregation.
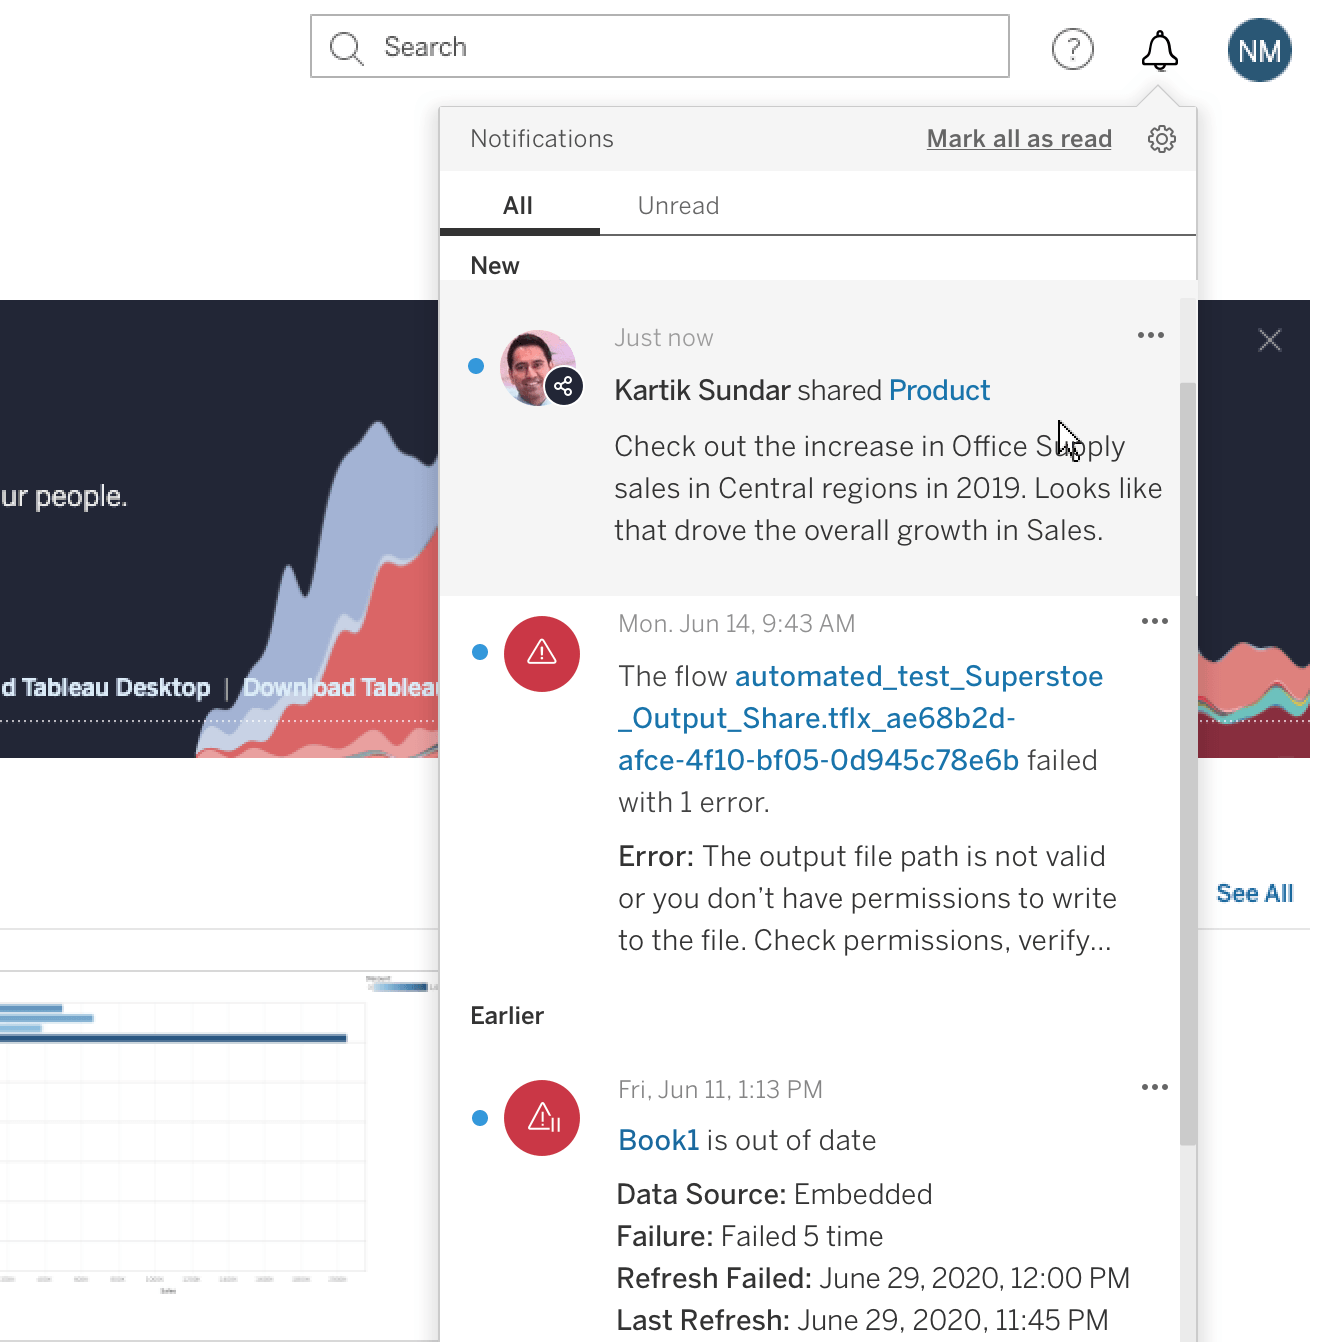
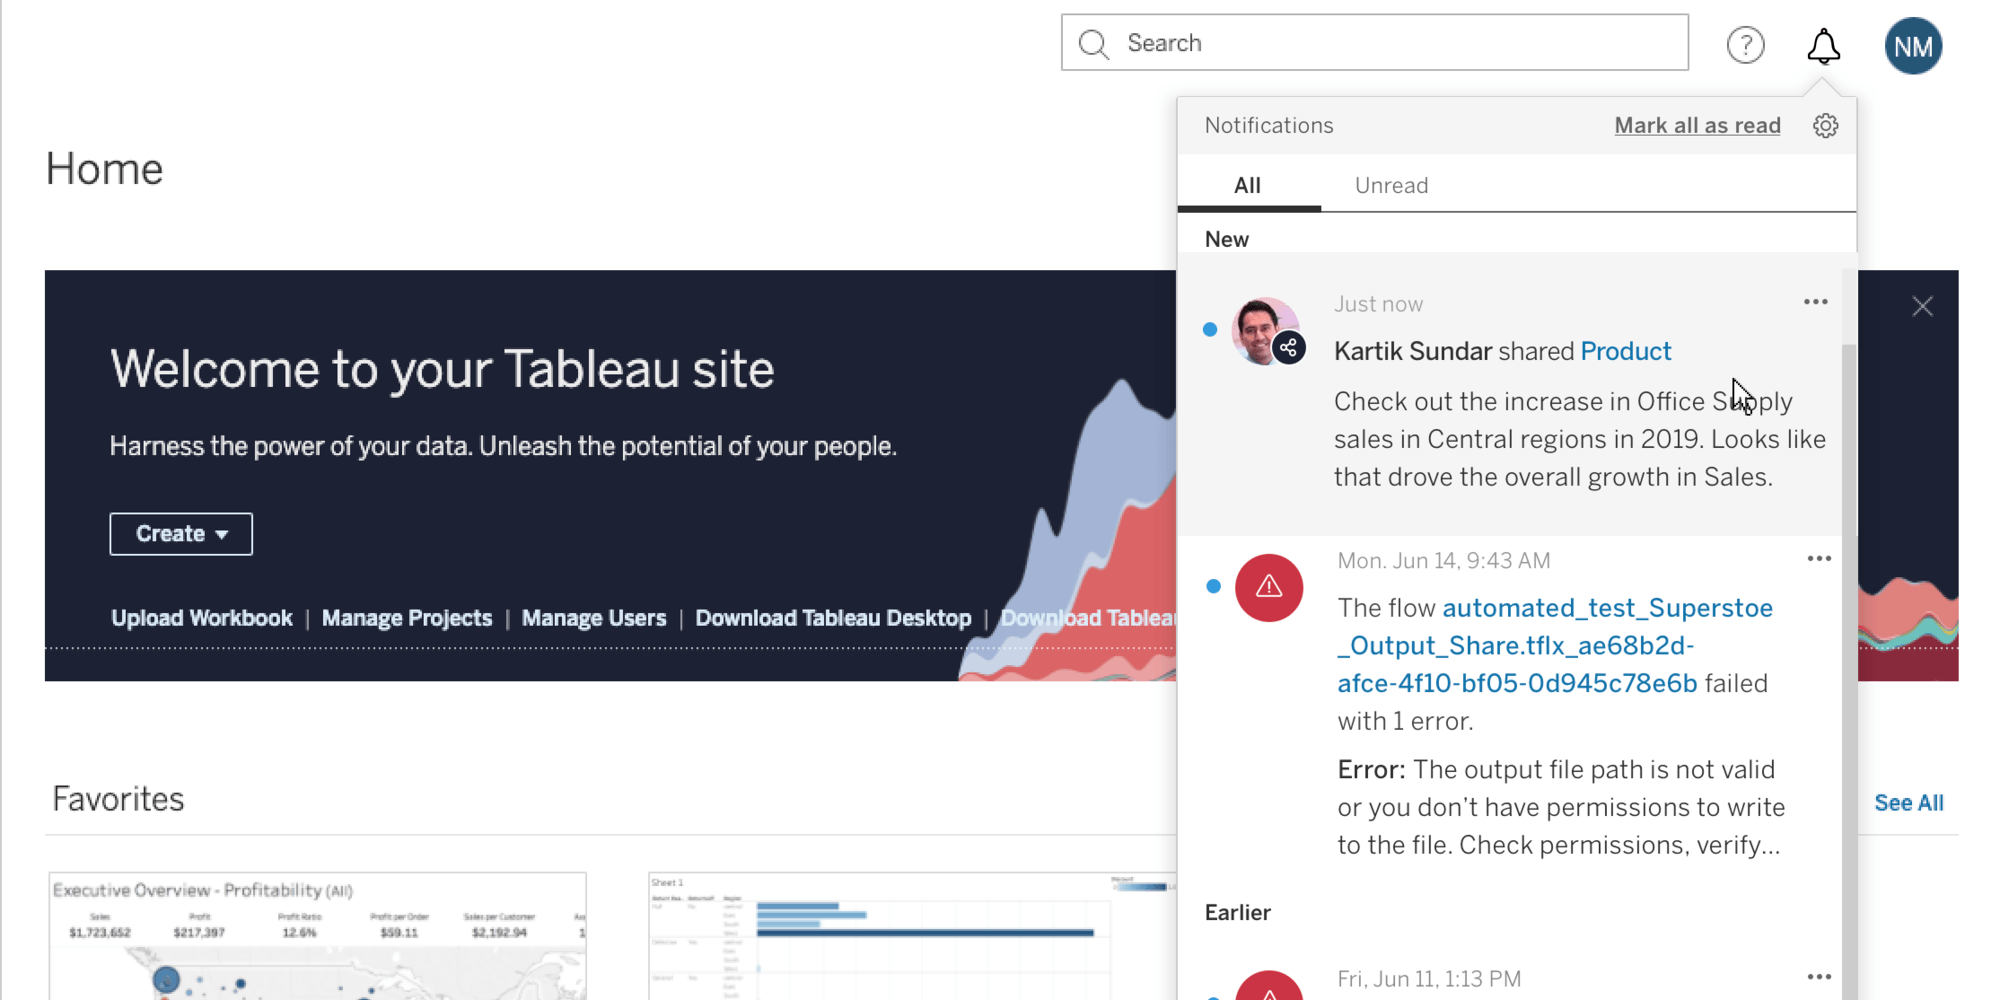
Unified notification experience
Manage all of your notifications in the newly redesigned notification center within Tableau Server and Online. This dedicated space shows your shares, comments, extracts, and prep flows all in one place, consolidating all of the important changes across your organization. You can also control where you receive these notifications via preferences—directly in Tableau, email notifications, or both—helping you to never miss an important alert to take action.


Microsoft Azure connectivity improvements
You can now connect to your data in Azure SQL Database (with Azure Active Directory) and Azure Data Lake Gen 2. In addition, we now have support for Azure Active Directory in two of our existing connectors in Azure Synapse and Azure Databricks. For guidance and best practices around optimizing Tableau and Azure together for analytics, read our updated Tableau Server on Microsoft Azure Whitepaper.
Read our WhitepaperTableau 2020.4
Tableau 2020.4 brings practical enhancements to make analytics in your organization more seamless and scalable. Highlights include Tableau Prep Builder in the browser, spatial improvements, and Resource Monitoring Tool for Tableau Server on Linux.
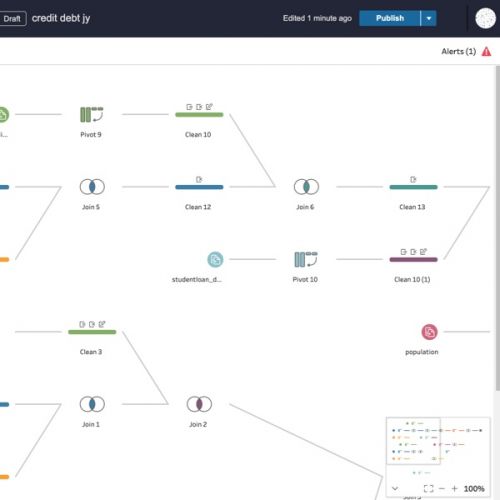
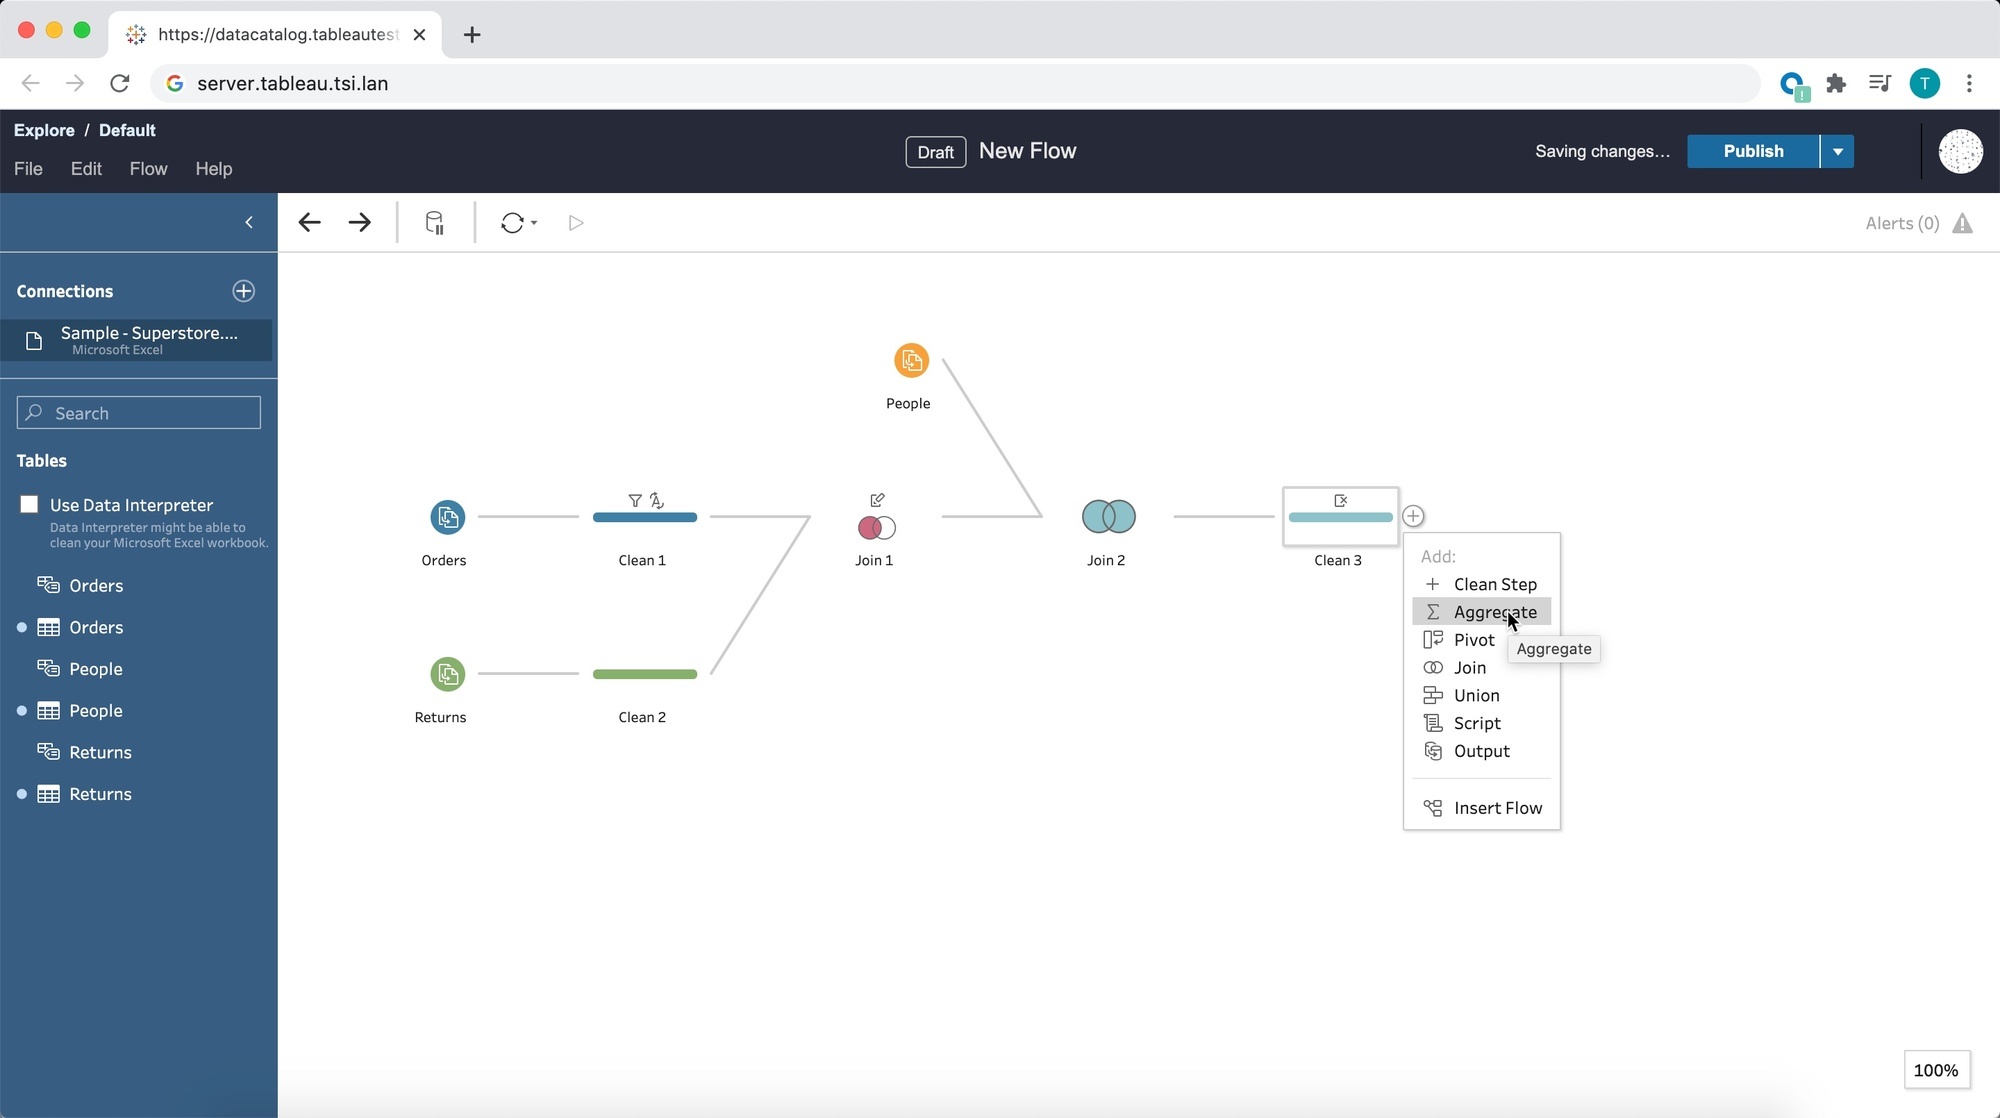
Tableau Prep Builder in the browser
Tableau Prep Builder in the browser allows you to prep your data from wherever you have access to a browser, bringing the data prep process into one integrated platform on the web. No need to manage individual desktops, IT admins can now upgrade the server to get everyone in the organization on the latest version.
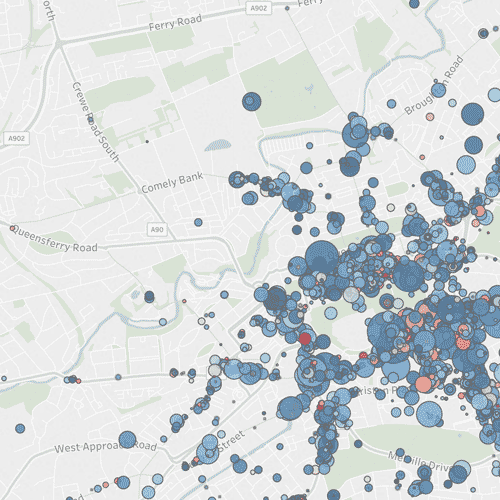
Multiple marks layer support for maps
Enhance your geospatial analysis with multiple marks layer support for maps. You can now add unlimited marks layers from a single data source to your map visualizations, bringing multiple spatial layers and context together for better understanding and analysis.

Redshift spatial support
We’re expanding Tableau’s spatial database connections to make solving location-based questions easier than ever. You can now connect directly to tables in Redshift that contain spatial data, and instantly visualize that data in Tableau.
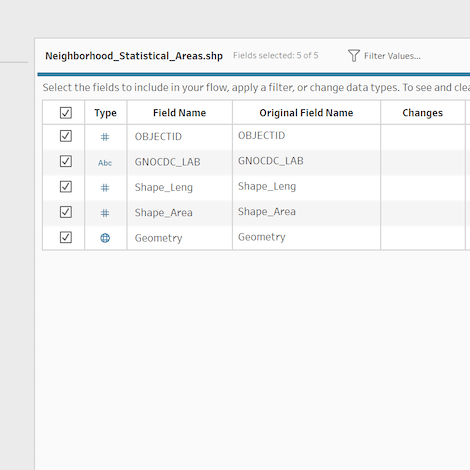
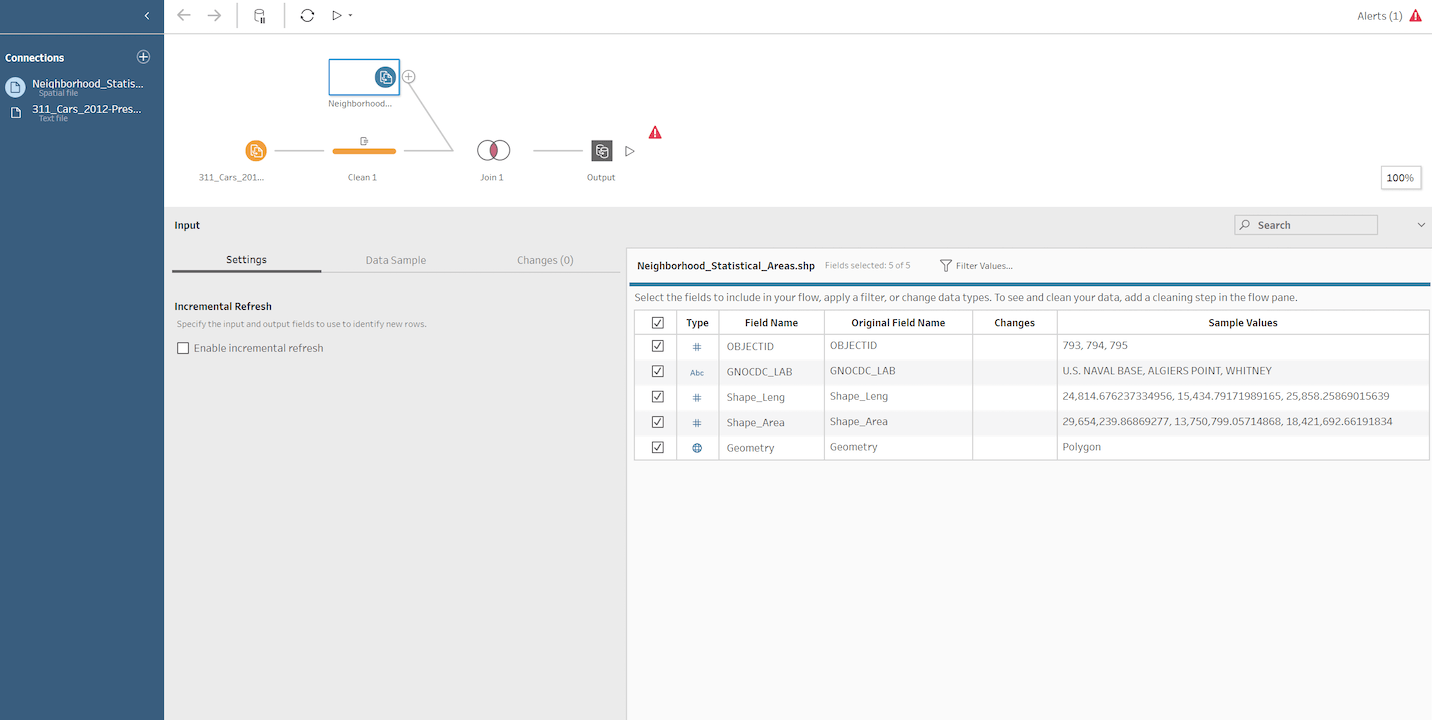
Spatial support in Tableau Prep
Tableau Prep Builder can now import, recognize, and export spatial data to extracts and published data sources, bringing spatial context into the data preparation flow for better analysis.
Offline map support for Tableau Server
We’re making it easier to access and analyze spatial data on Tableau Server with offline map support. You can now create maps using the offline map style in web authoring, ensuring that maps remain accessible to all users—especially in organizations with strict internet access requirements.
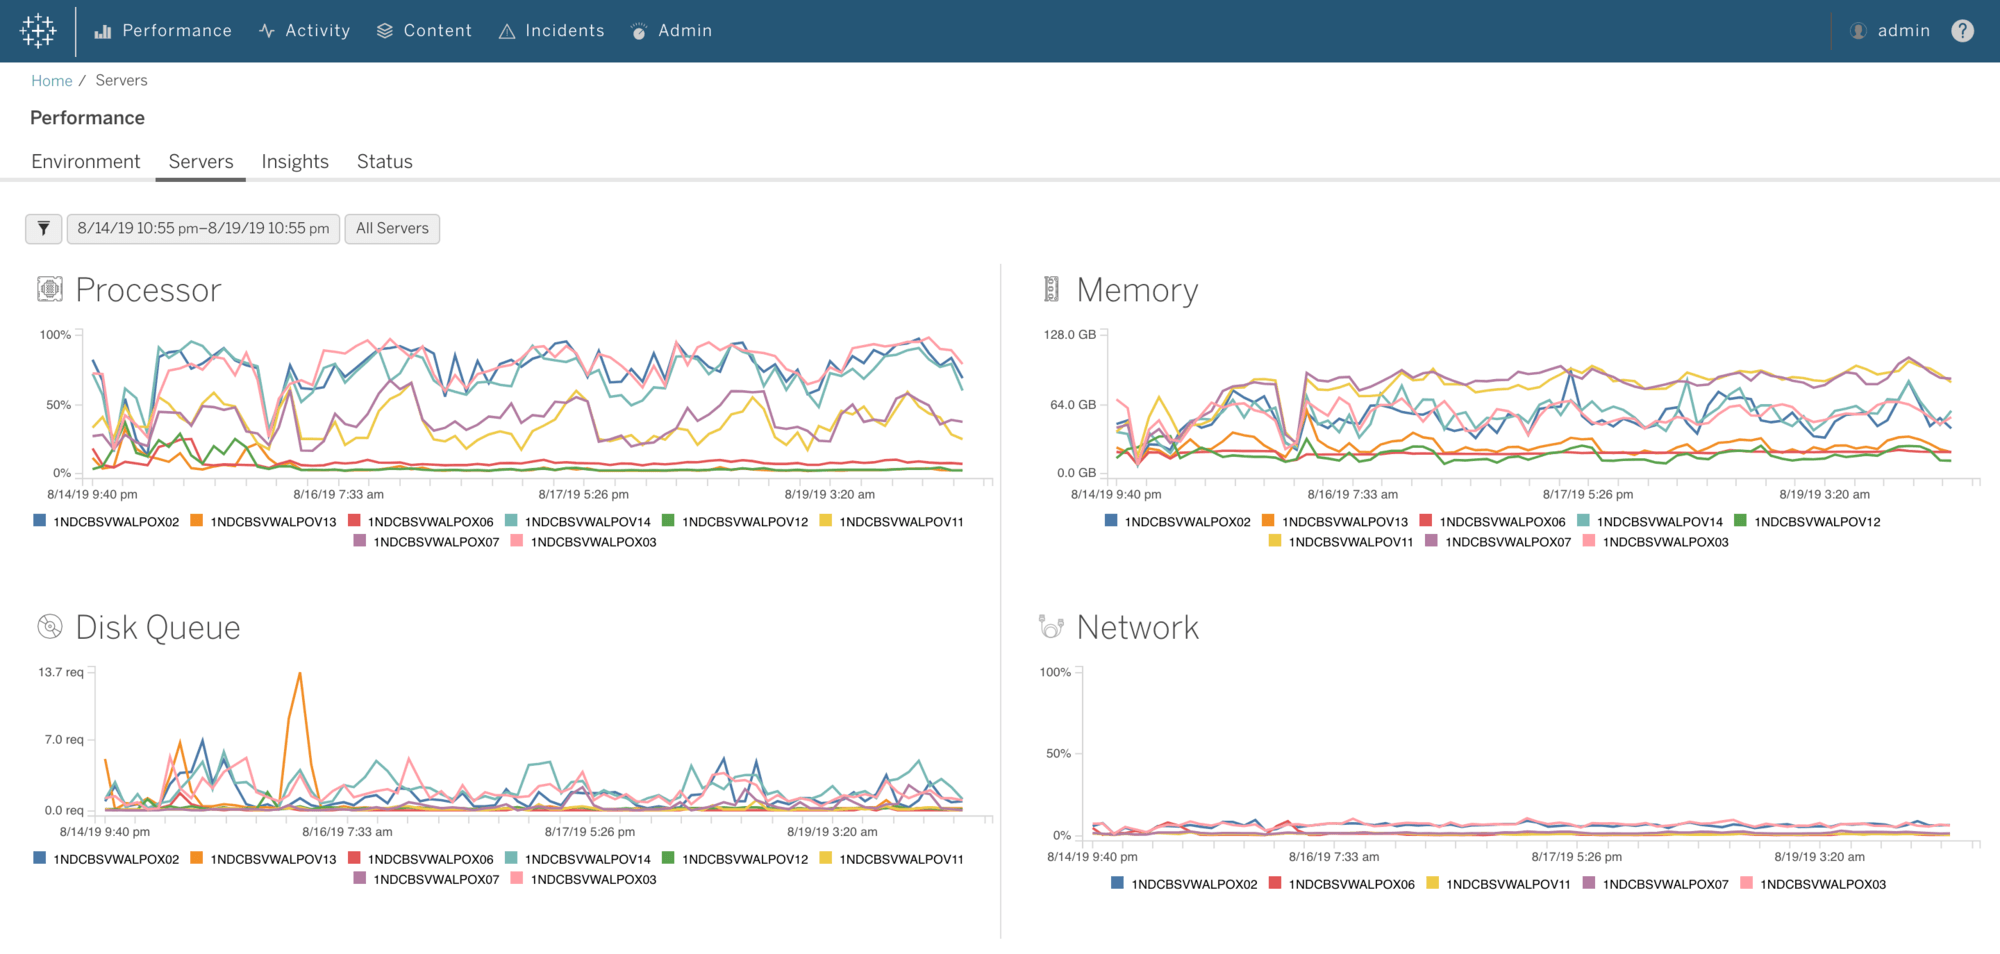
Resource Monitoring Tool for Tableau Server on Linux
Previously available for Windows only, Resource Monitoring Tool now provides agent-based monitoring of your Tableau Server on Linux deployment as part of Advanced Management for Tableau Server. Proactively monitor and troubleshoot server health with improved visibility into hardware and software performance.
Tableau 2020.3
Tableau 2020.3 brings powerful functionality to help scale your analytics, making trusted data more accessible to everyone. Highlights include write to external databases in Tableau Prep, grant license on sign in, and deeper integration with SAP.
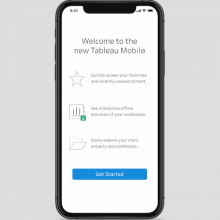
Tableau Mobile for Workspace One (iOS)
Tableau Mobile for Workspace ONE is an update to the existing app that provides a quick and secure way to view, analyze and leverage the data in your organization. The new app, compatible with iOS13, includes a newer design that is faster and more intuitive, an improved search and browsing experience consistent with Tableau Server and Tableau Online, as well as enhanced offline capabilities that are quick to load and offer richness and interactivity for visualizations.
Support for Google BigQuery NUMERIC types
Take advantage of using Google BigQuery's NUMERIC data type without having to use CustomSQL, instead convert your NUMERIC type to DOUBLE.
Dashboard extension images
When you generate a .png or .pdf of a dashboard that you are viewing in Tableau Desktop, it will now render the Extension zone's image.
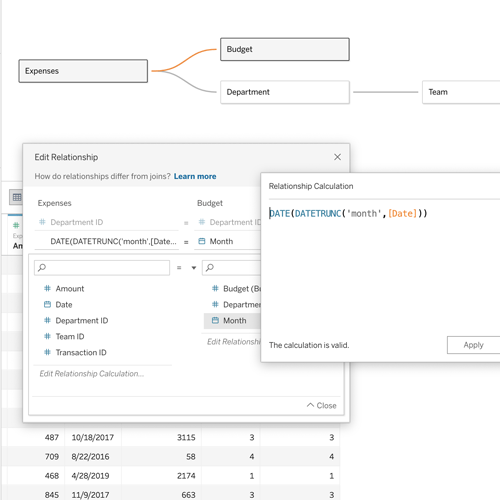
Relationship improvements
Create relationships between tables in your data source with more flexibility. You can now relate tables based on custom calculated fields, like concatenated fields or date truncation, and inequality operators. Additionally, we've improved the drag-and-drop experience in the data model.
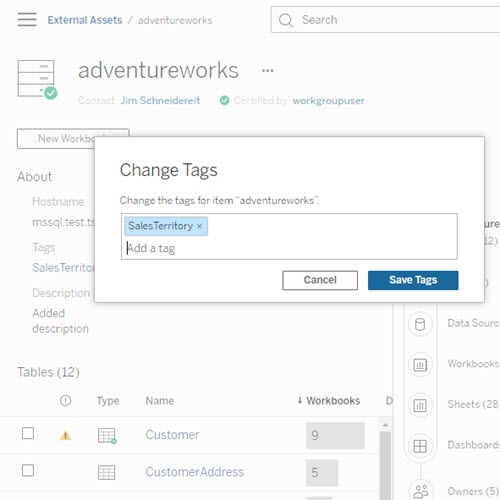
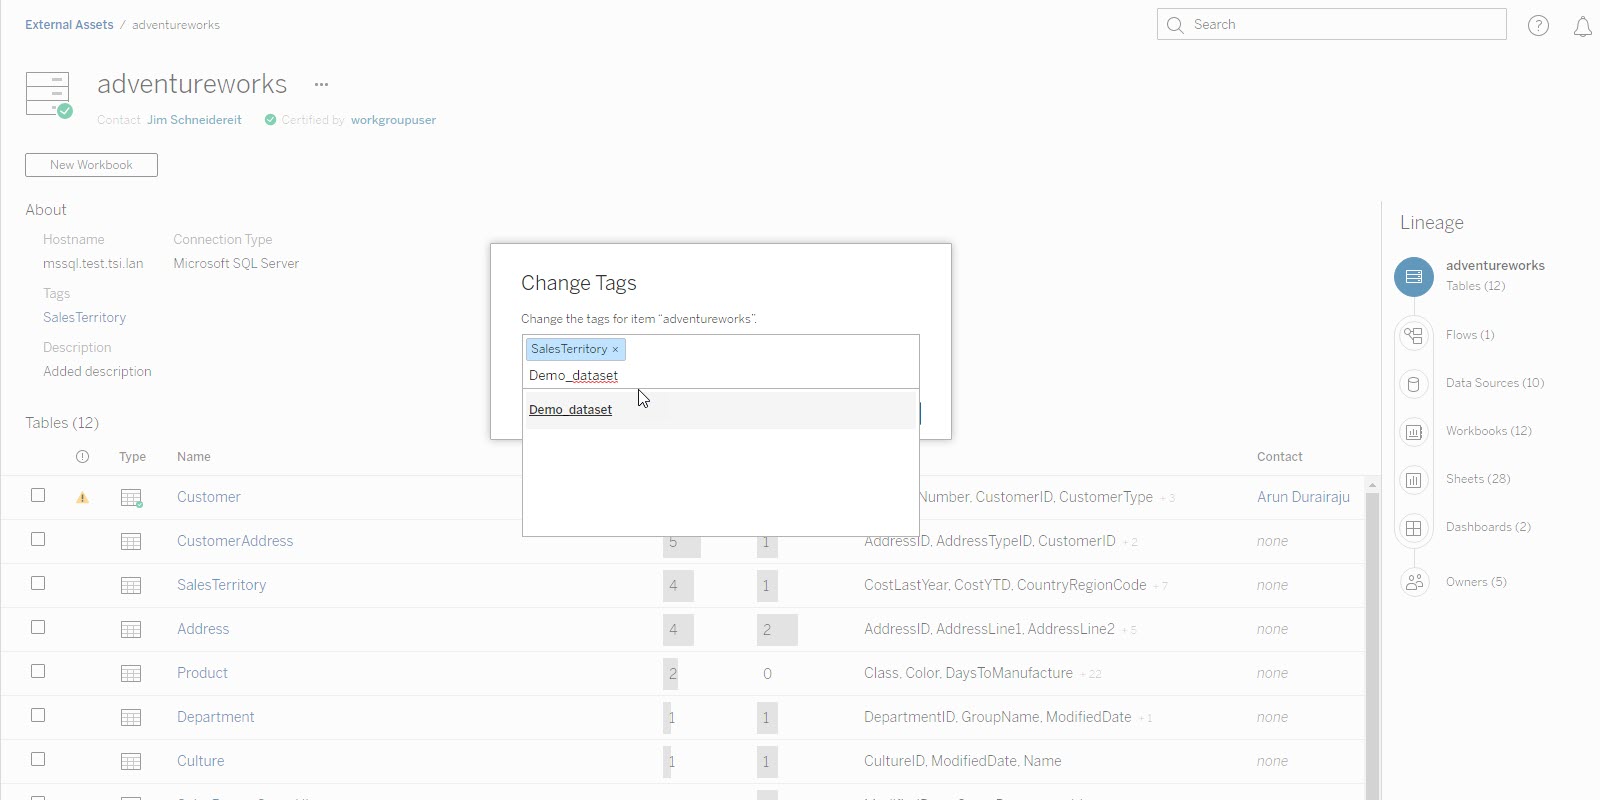
Tag External Assets in Tableau Catalog
Make it even easier to find the right data by tagging external assets, including databases, tables, and columns.
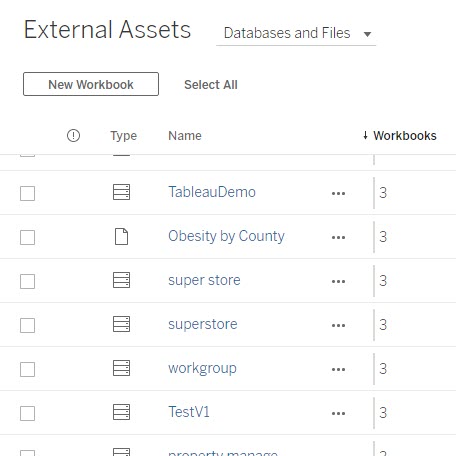
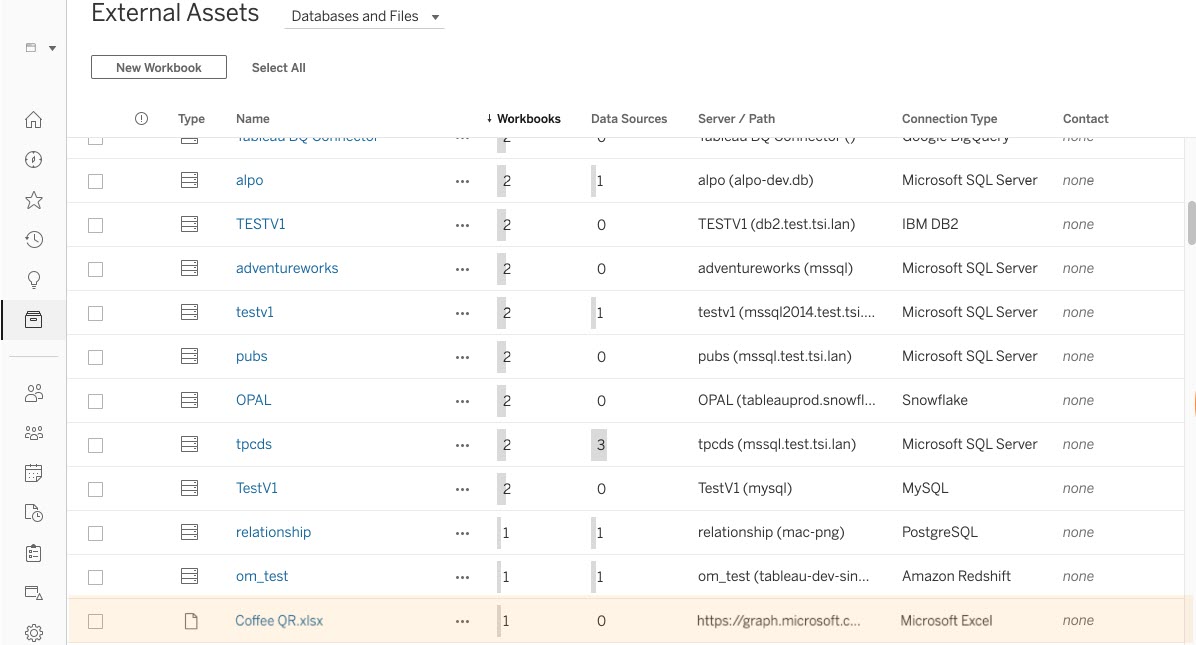
Include embedded files in External Assets list
See every asset in your environment via External Assets, including files and tables that are embedded in workbooks. This provides a holistic view of what data users are leveraging outside of published data or content.
Tableau 2020.2
Tableau 2020.2 brings significant enhancements to help organizations through their analytics journey. Highlights include Metrics, set control, and enhancements to Tableau's data model with relationships to help you elevate your relationship with data.
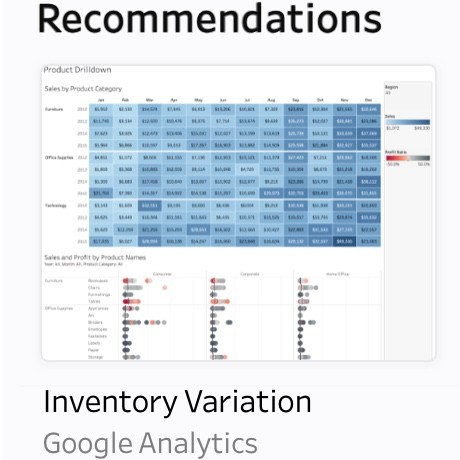
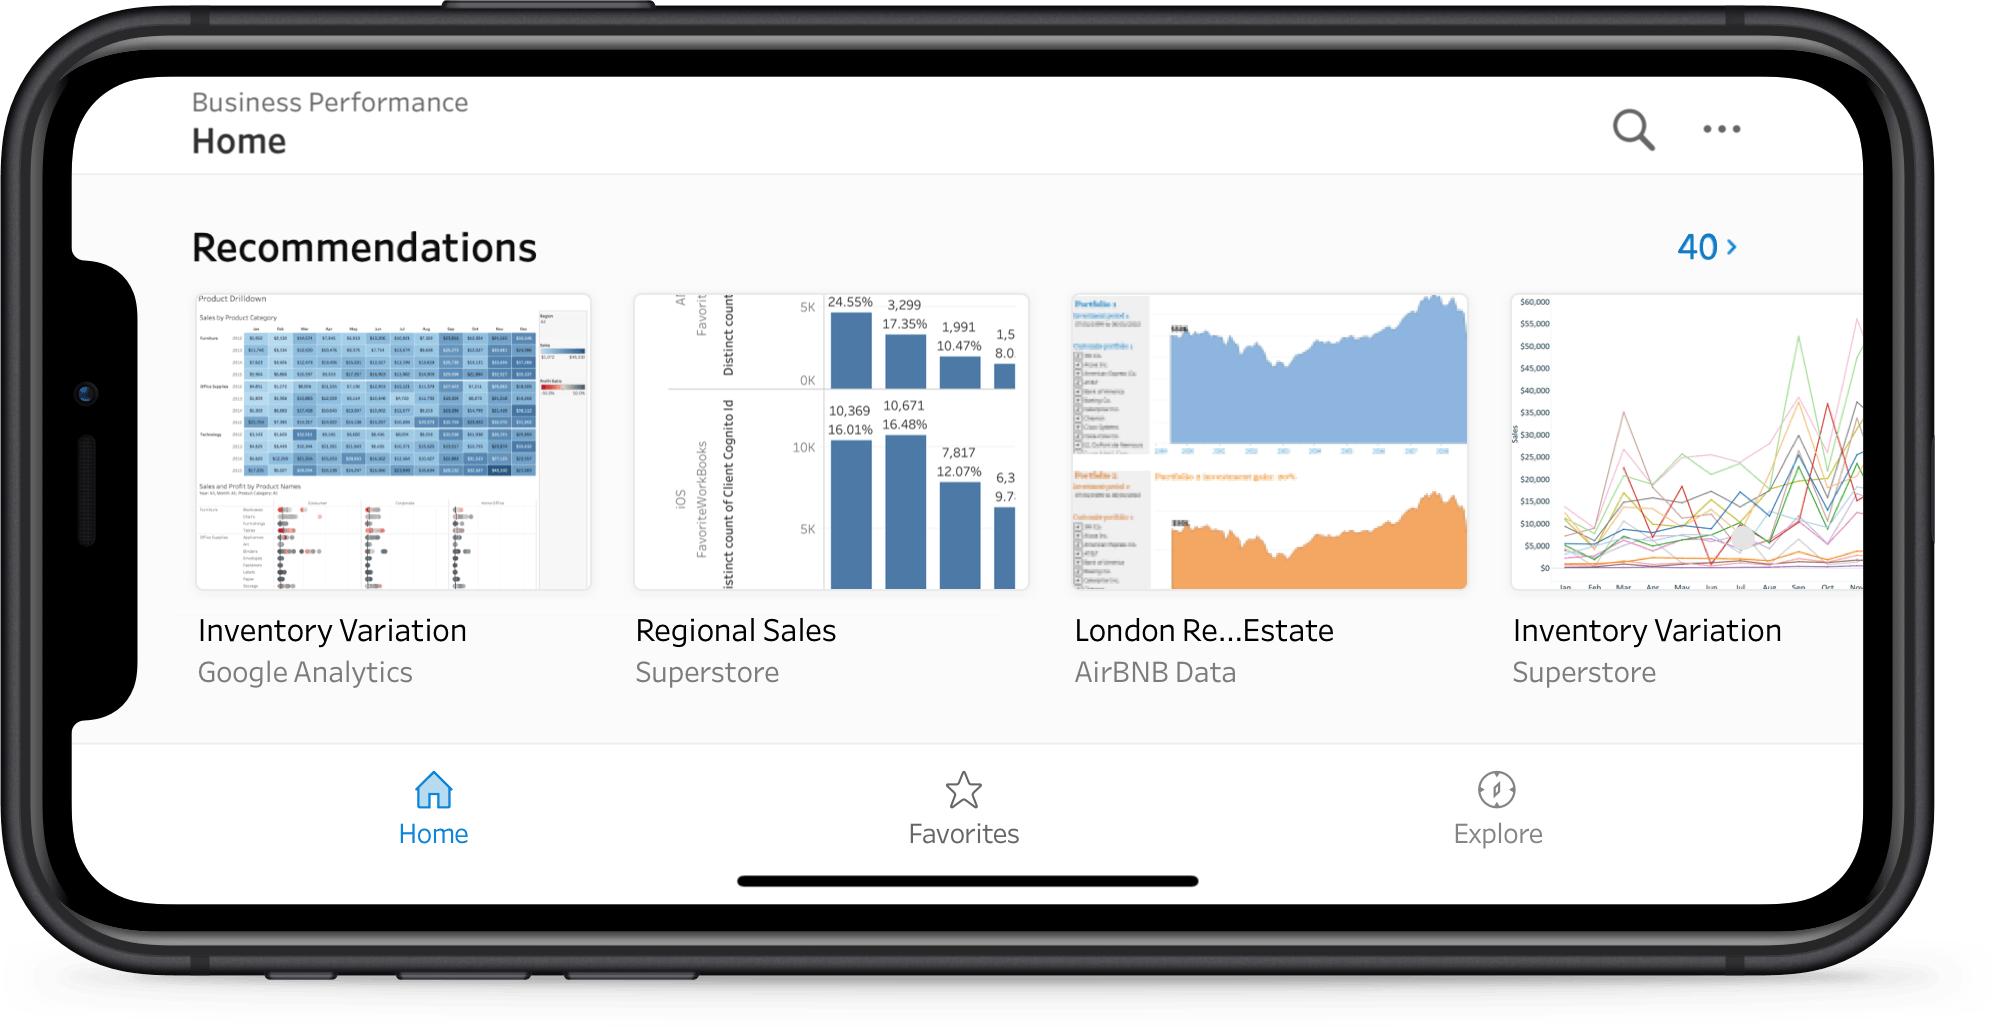
View recommendations on Tableau Mobile
View recommendations are now on Tableau Mobile. Get personalized suggestions that instantly connect you to relevant vizzes on the go. Powered by machine learning, these recommendations leverage users' preferences and surface vizzes that others with similar viewing habits found interesting, and that are popular on your site. With the home tab, you can find recommendations in a dedicated channel on your Tableau Mobile App.
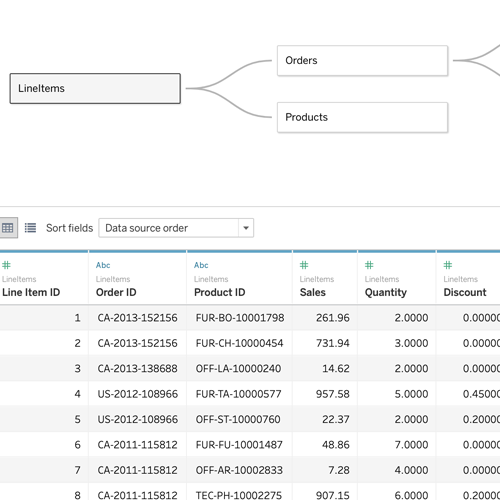
Relationships
Combining data just got easier and more powerful. By visually creating logical relationships between tables, Tableau will only query the data relevant to your analysis at the right level of detail. Analyze complex data faster and with more confidence.
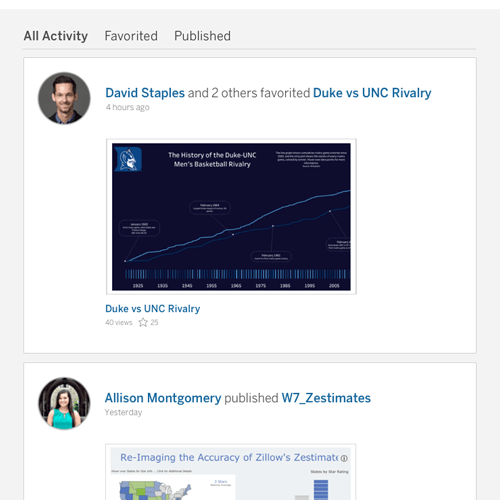
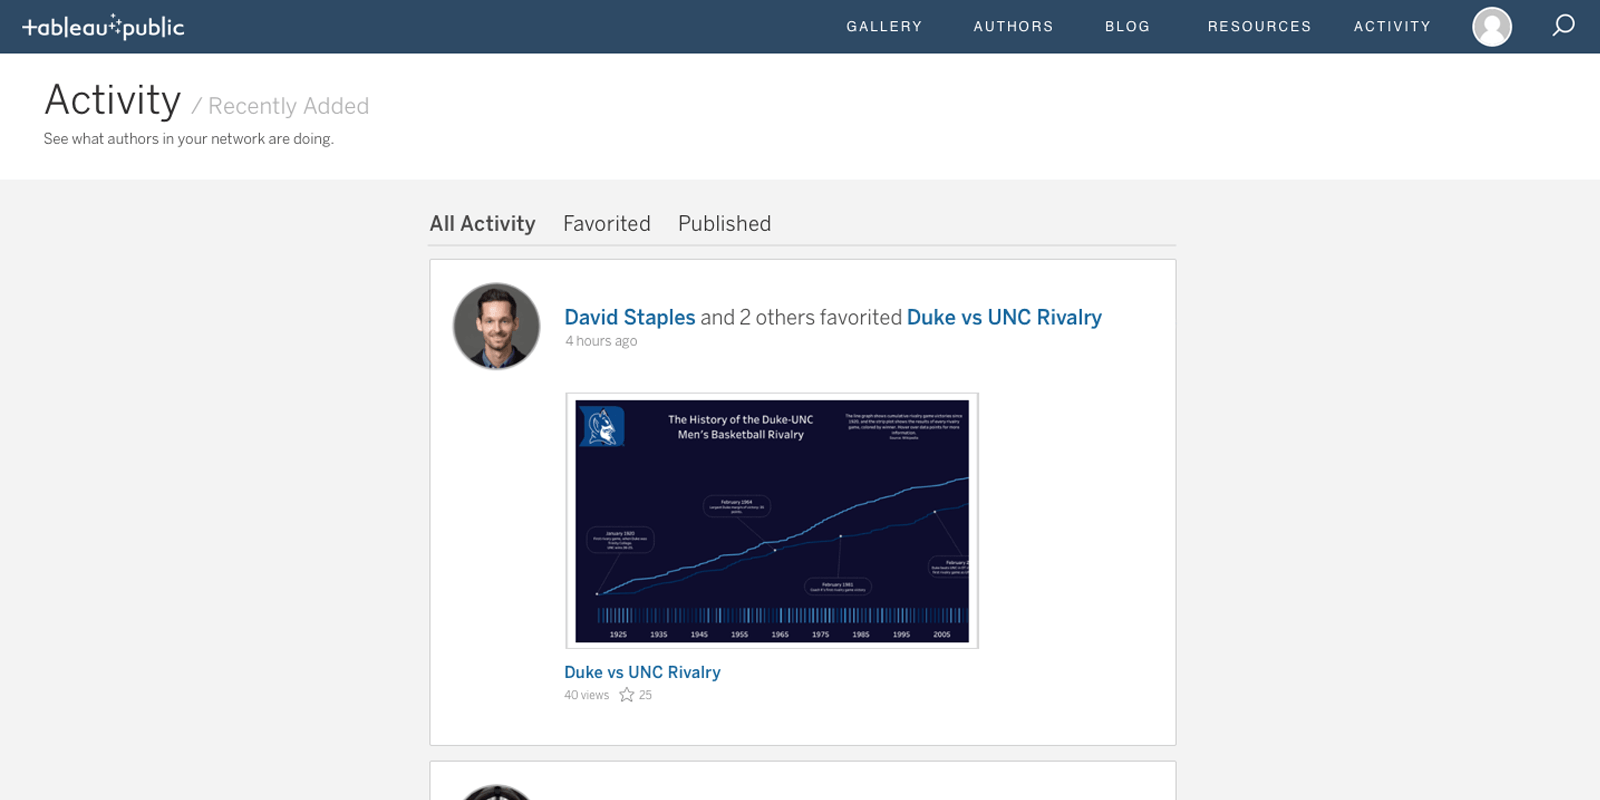
Activity feed improvements
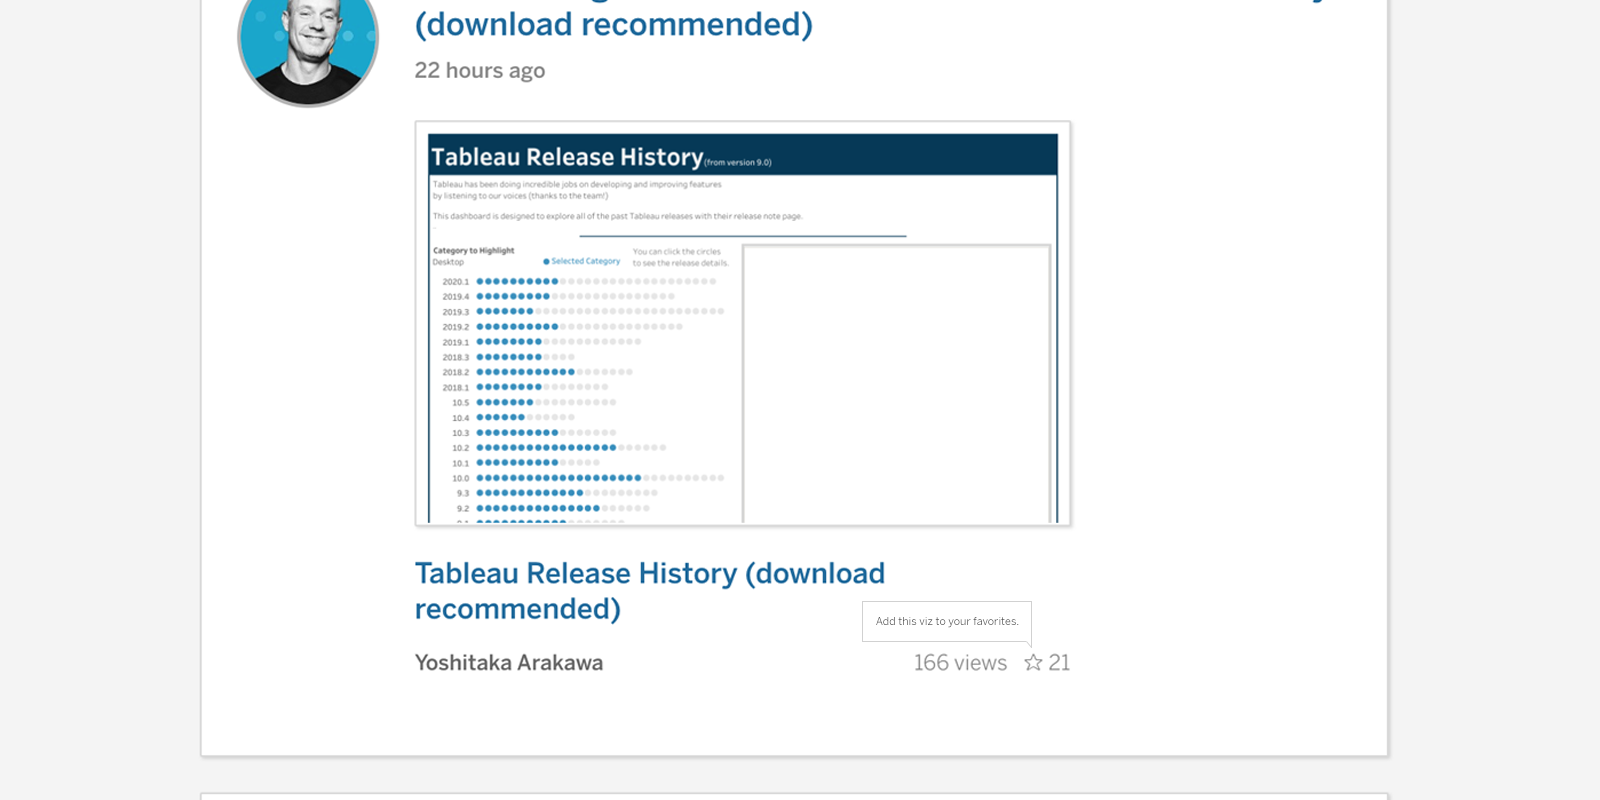
See a viz in your activity feed you like? You can now add vizzes to your favorites directly from your Tableau Public activity feed.
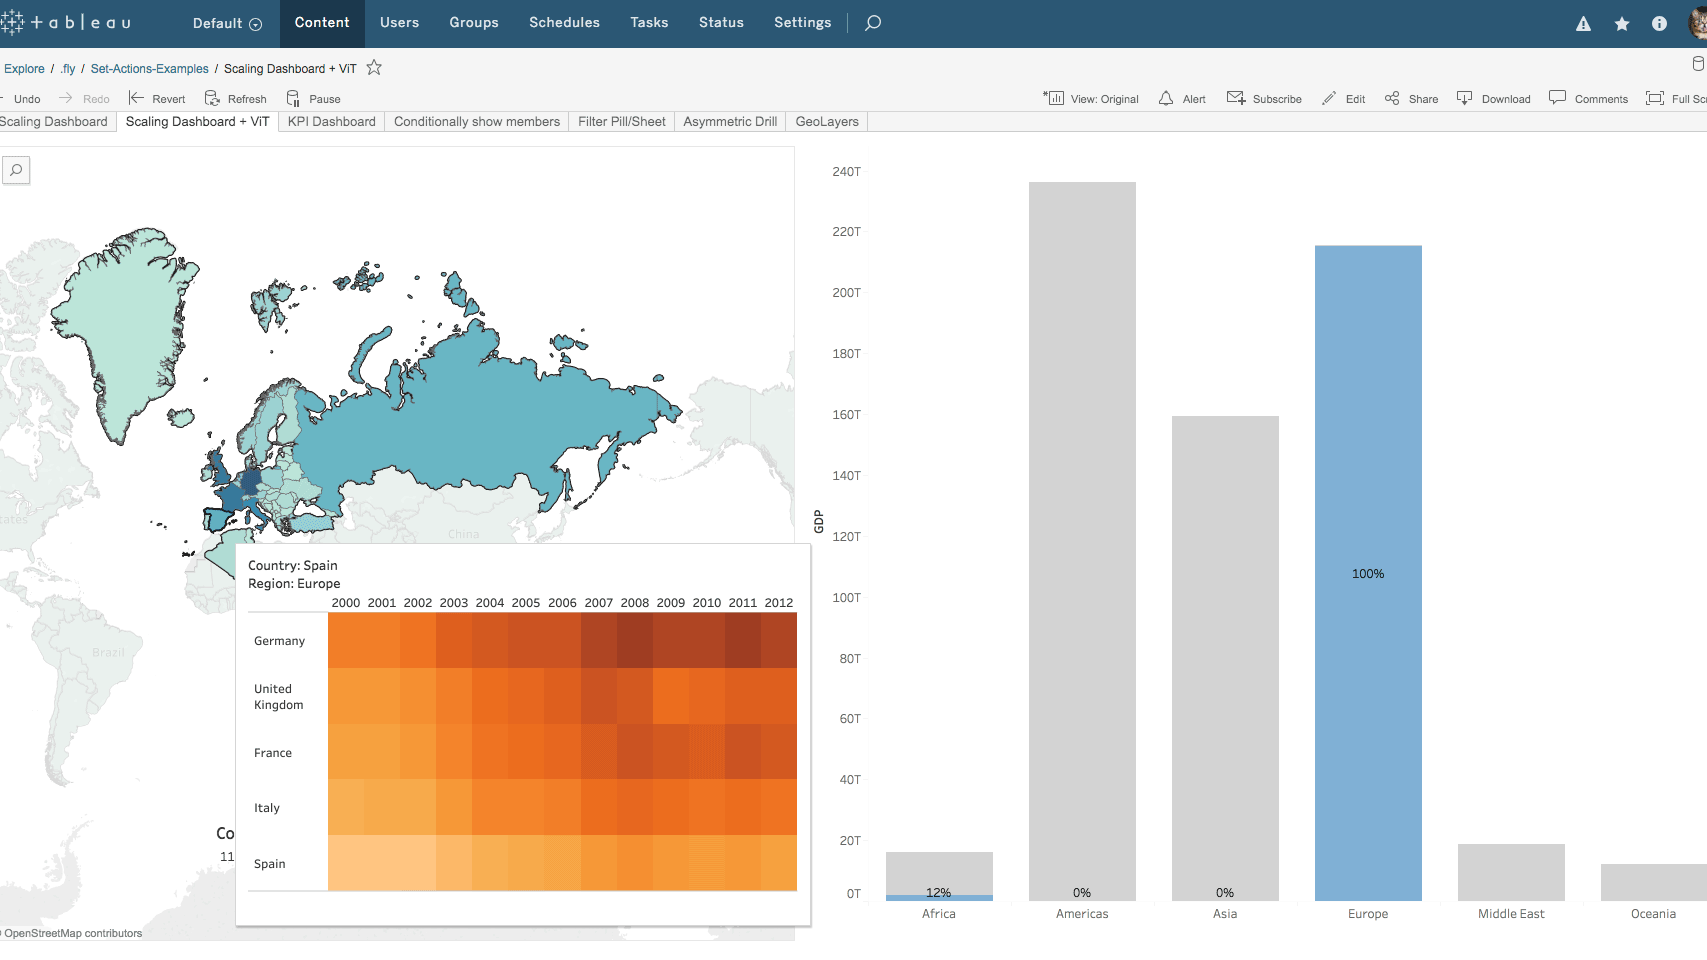
Set actions improvements
Set actions just got even more powerful with two new selection modes. You can now incrementally add and remove values from a set by interacting with marks in the view, even after a selection is cleared.
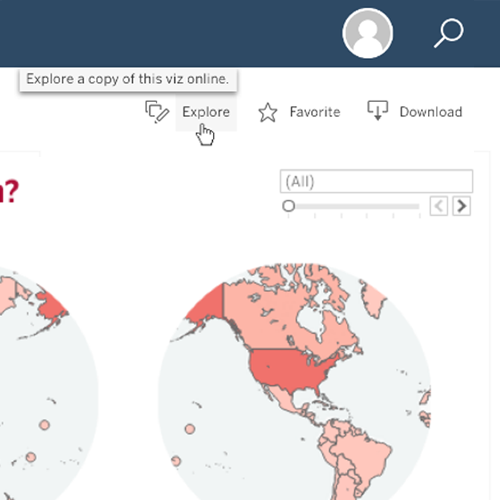
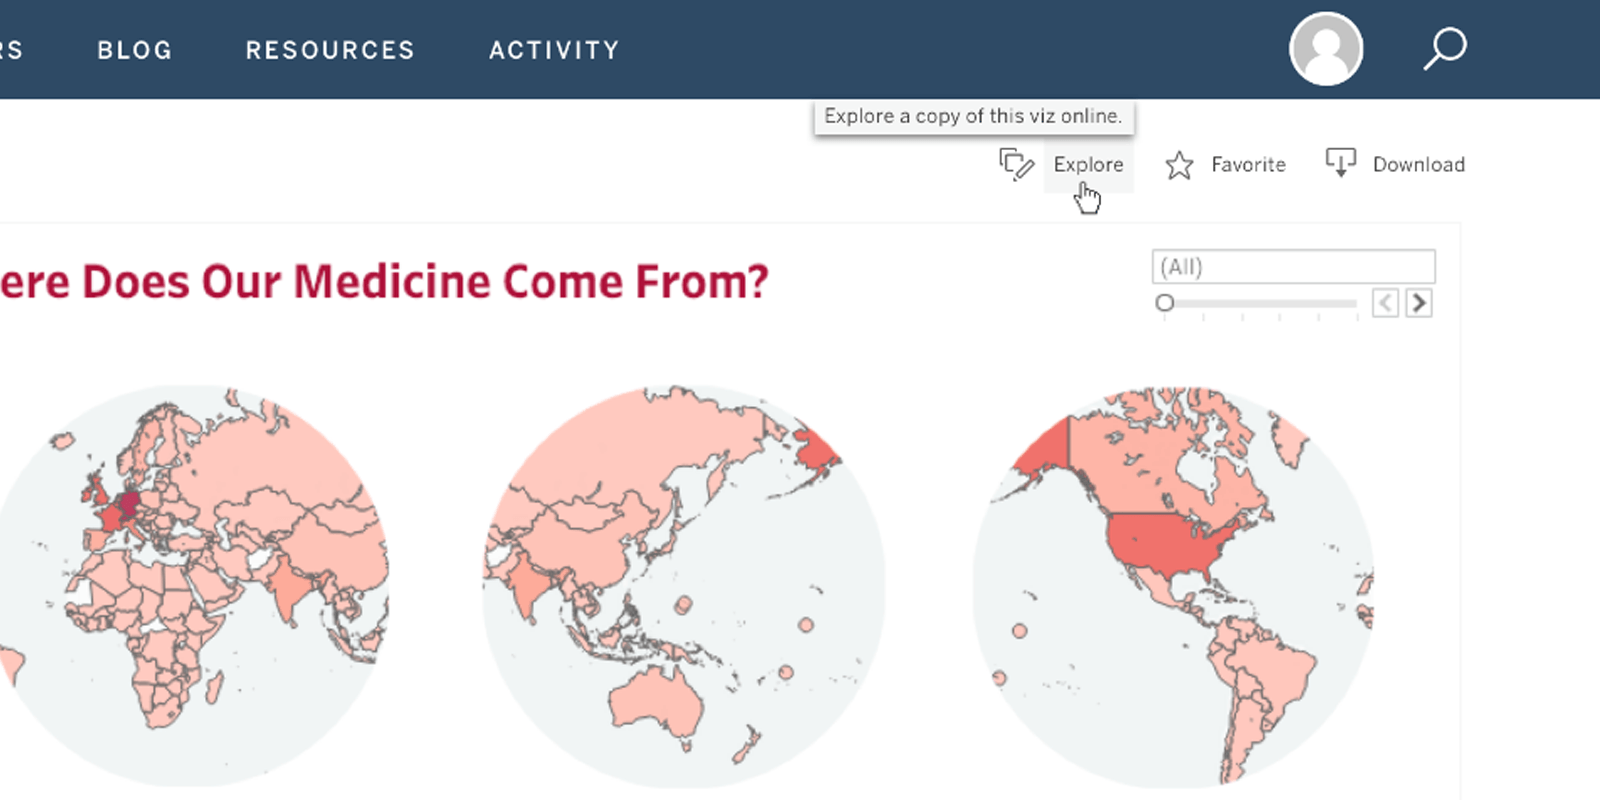
Explore a viz in the browser
Want to see how a viz on Tableau Public was made? You can now explore a viz directly in a browser. Explore, make your own version, and save as a copy to your profile with automatic attribution to the original author.
SAP HANA connector improvements
We have improved our OData Connector which now supports S/4HANA. Additionally, users can now connect to an OData service URL to list all the feeds inside their service and can join those feeds together just as they would any other tables in a Tableau datasource.
Tableau 2020.1
Tableau 2020.1 includes exciting ways to add powerful interactivity to your data, bringing to life some of the most-requested features from the Tableau Community. Enjoy dynamic parameters, buffer calculations, and viz animations to tell even more powerful, moving stories behind your data.
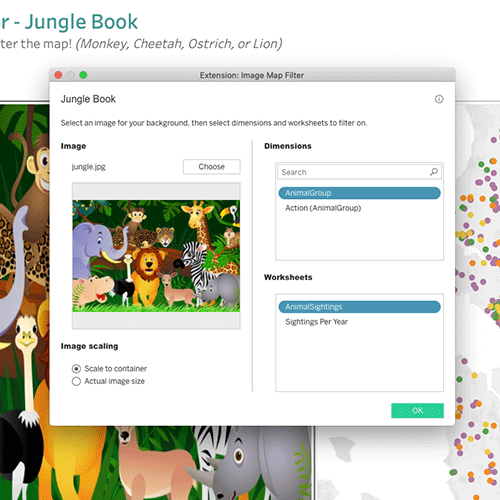
Dashboard Extensions for Tableau Public
With extensions, you can create more customized visualizations. We are now supporting the Image Map Filter, Single Checkbox Parameters, and Filter Bookmarks extensions on Tableau Public. These extensions are available for download in our Tableau Exchange.
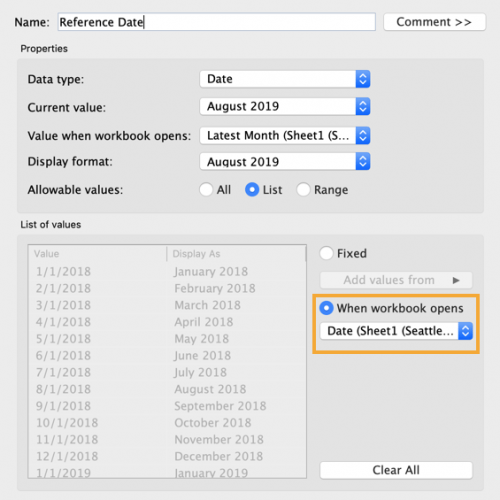
Dynamic parameters
Say goodbye to republishing workbooks with parameters every time the underlying data changes. Set your parameter once, and Tableau will automatically update the parameter’s list of values every time someone opens the workbook.
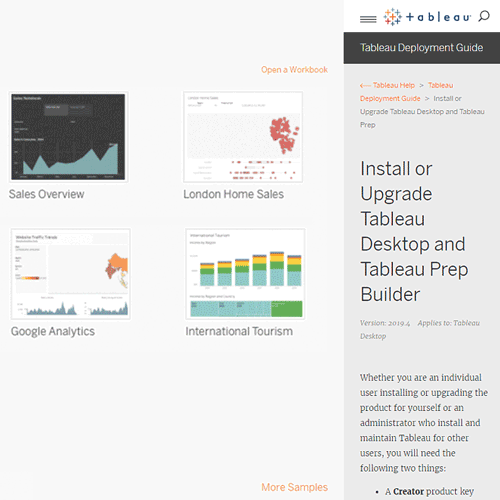
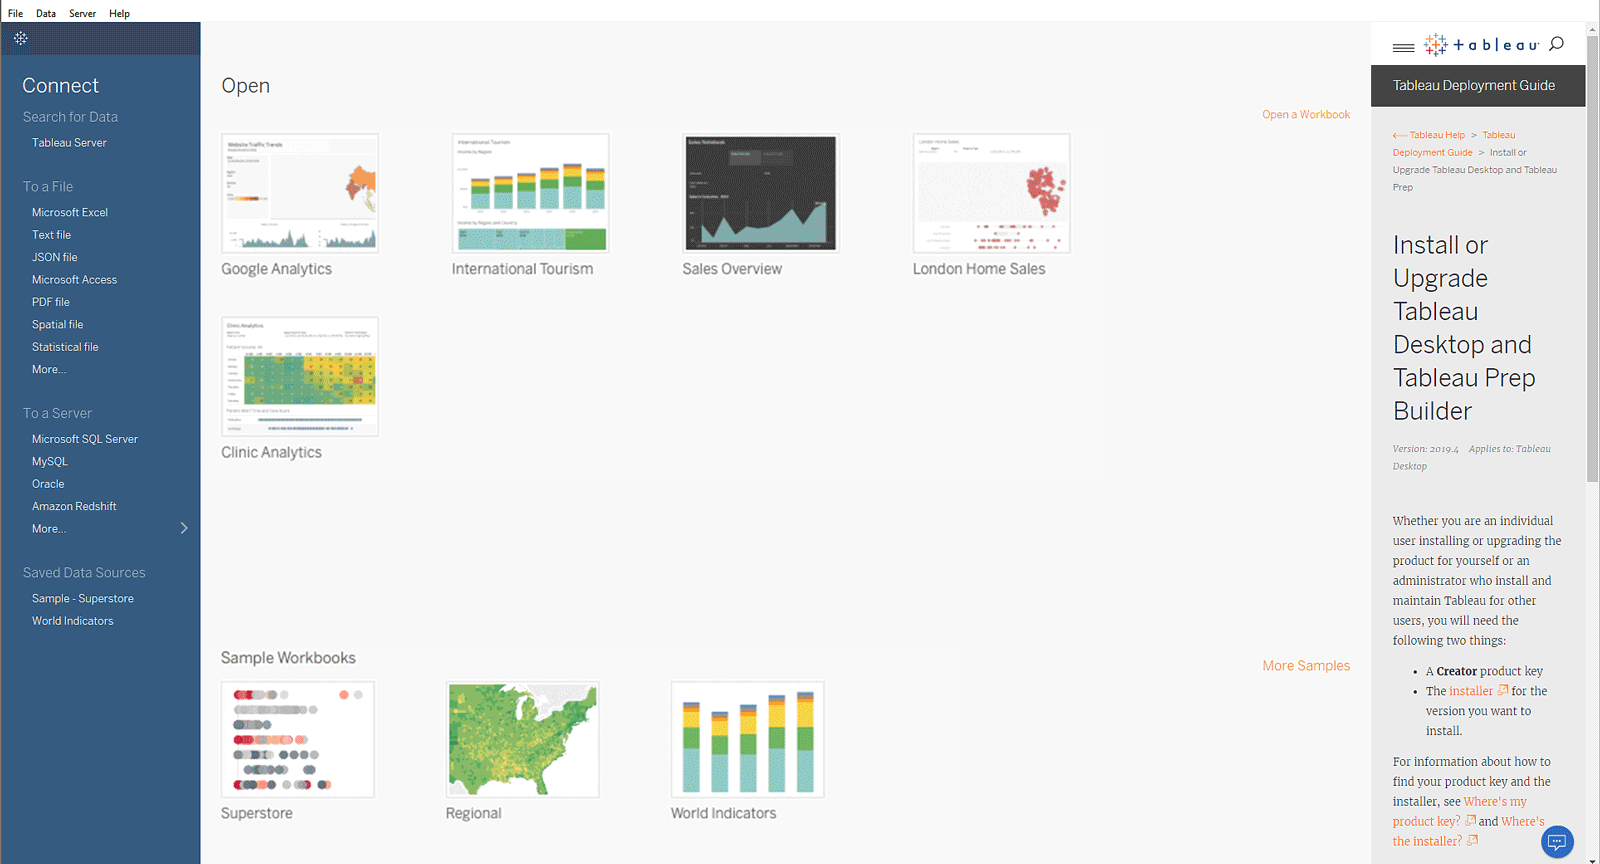
Customizable Discover Pane for Tableau Desktop
You can now customize the Discover Pane that appears on the start page in Tableau Desktop to show your own custom content instead of the content Tableau shows by default. Provide links and information specific to your organization to make it easier for your users to get started using Tableau quickly. Learn more about it here.
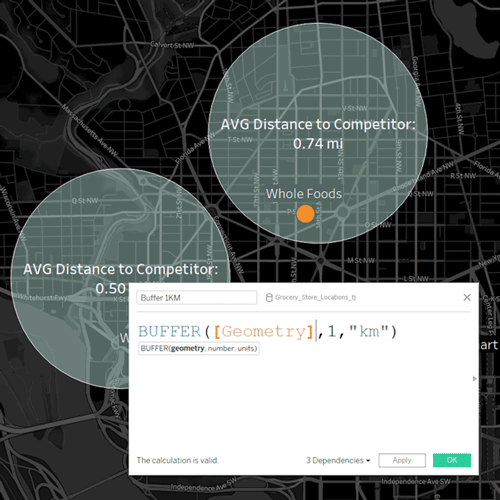
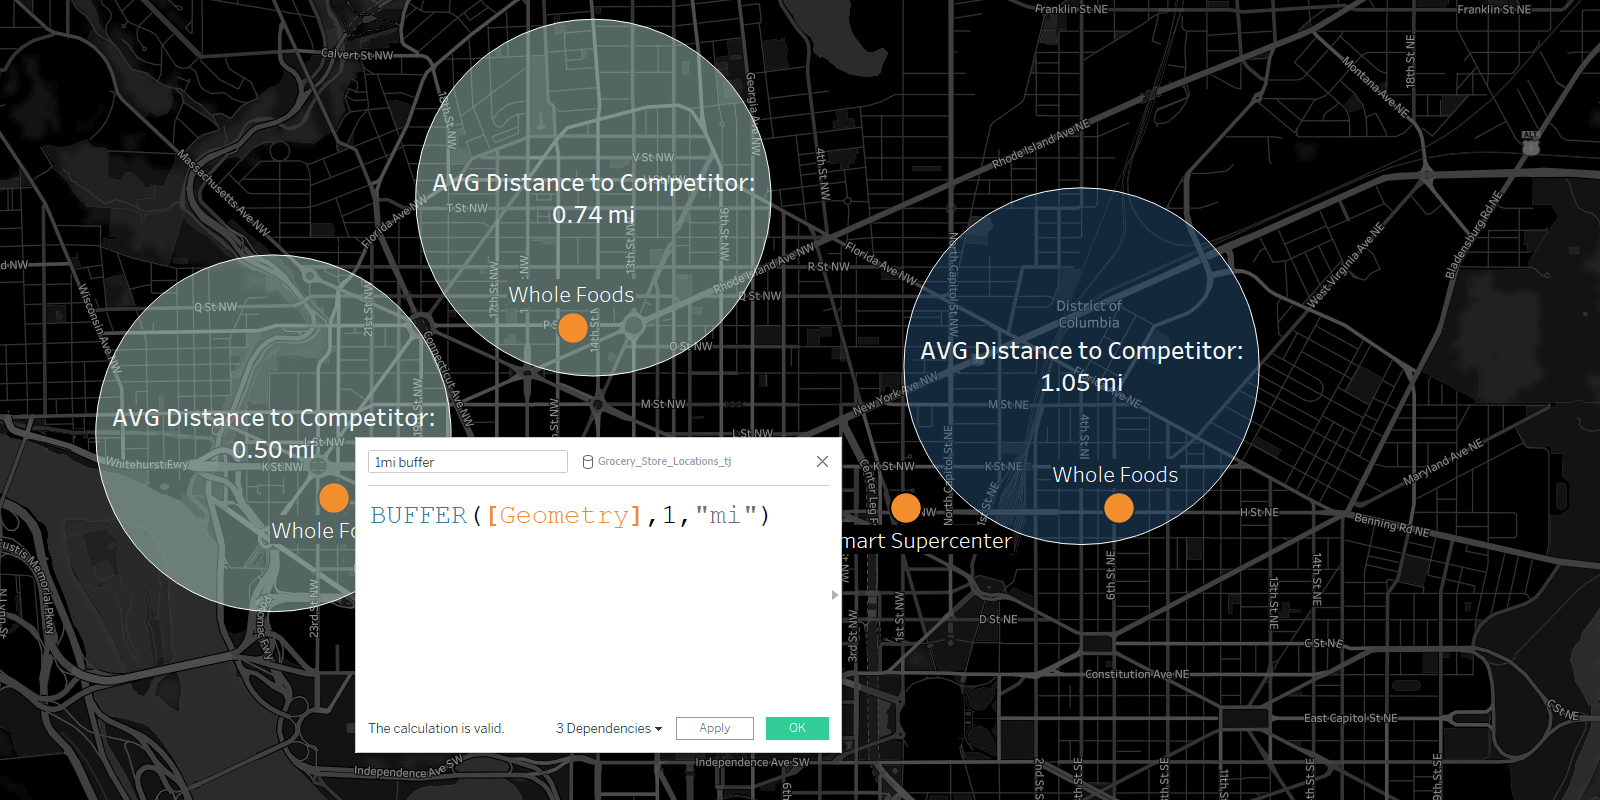
Buffer by distance calculations
Buffer calculations allow you to visualize the distance around point locations. Give Tableau three parameters—location, distance, and a unit of measure—and a buffer, or boundary is instantly created. Answering complex spatial questions becomes easier than ever before—visualize what properties are within 200 meters of a proposed transit site, or how many competitors’ stores are within 1 mile of their store, and more.
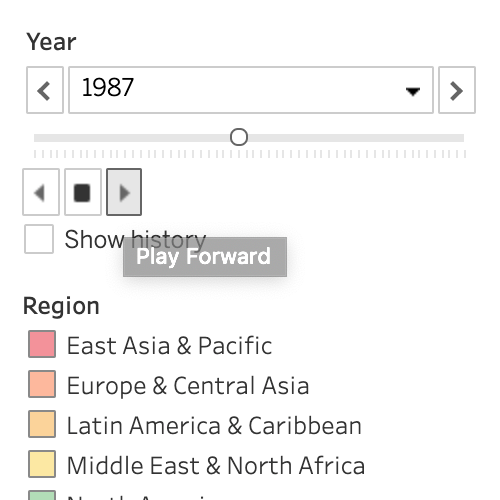
Play button in the browser
For workbooks using pages, press play directly in the browser to see how a given measure affects the rest of your data. Combine with Viz Animations for smooth, coherent transitions showing changes between states or over time.
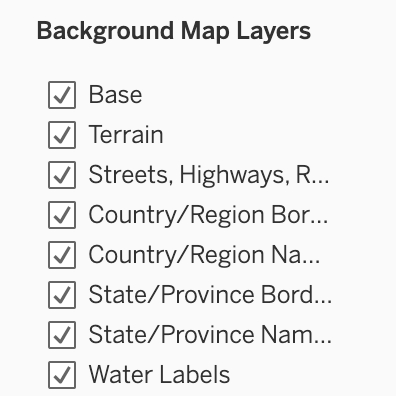
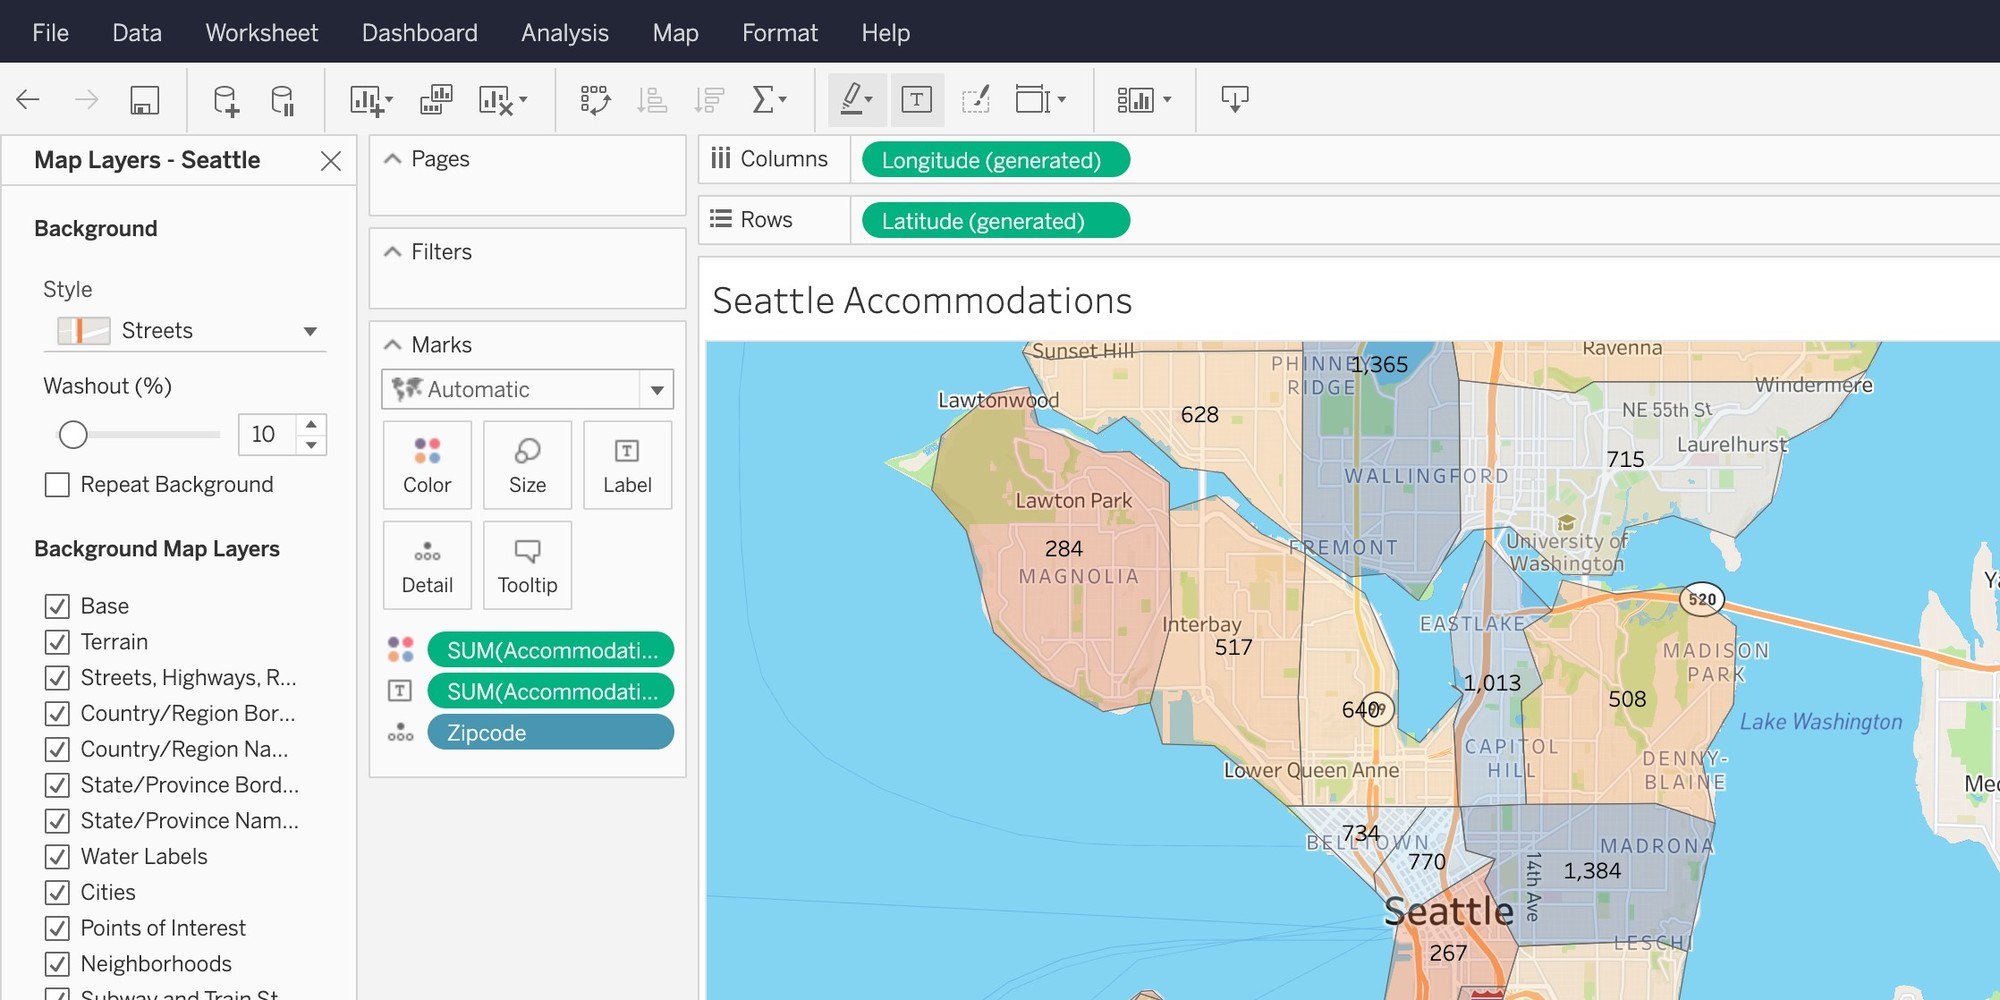
Map improvements in the browser
Control more aspects of your map in the browser. Change background map styles, repeat backgrounds, map layers, and demographic data layers. In addition, the style picker dropdown makes it easier to find and distinguish between map styles.
Tableau 2019.4
2019.4 brings functionality to make it easier for customers to find, connect to, and analyze their data. Highlight features this release include significant table improvements, view recommendations for Tableau Server and Online, and Webhooks support to help further integrate and extend the Tableau platform.


Alibaba Connectors
Now, through a partnership with Alibaba, Tableau customers will be able to natively connect and analyze data in MaxCompute, AnalyticDB, or Data Lake Analytics.
Read more about this partnership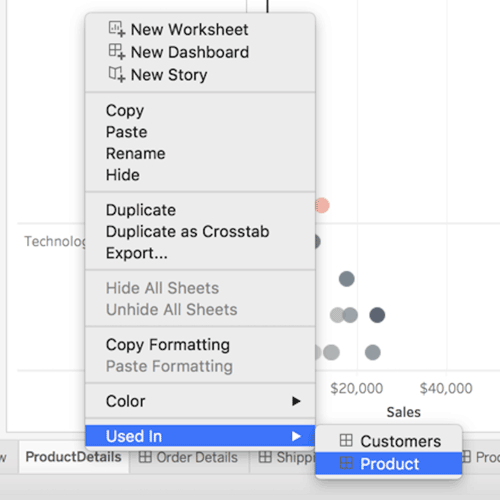
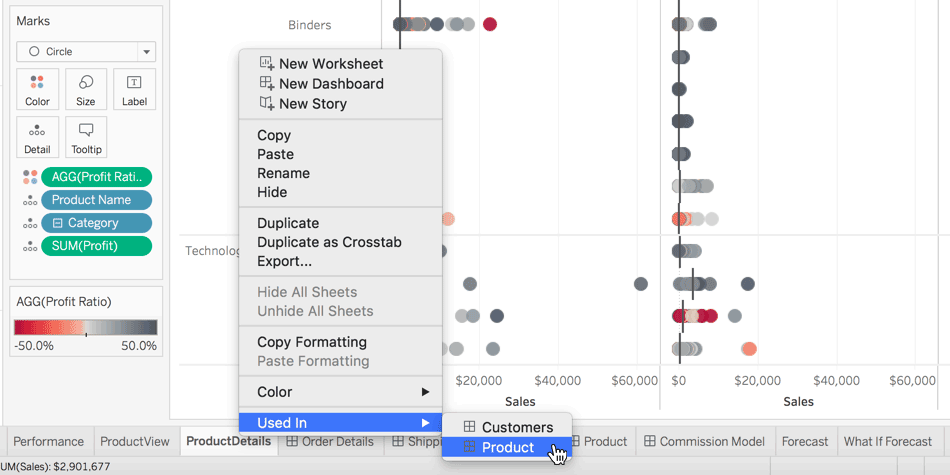
Go to where a sheet is used
We’re making it faster to navigate larger, complex workbooks that contain multiple sheets. Easily view and jump to all locations in a workbook (dashboards, stories) where a worksheet is used.
Activity feed improvements
Filter your personalized Tableau Public activity feed by toggling between activity type. Favorites are now grouped together for the same viz.
SAP HANA connector improvements
Now when you connect to SAP HANA, leveled hierarchies utilized in calculation views will automatically be available in Tableau.

Kyvos Connector
For customers using Kyvos, you can now natively connect and start analyzing your data. Available for Tableau Desktop and Tableau Server.

For customers using Presto, you can now take full advantage of the innovation of Qubole as a native connector. Available for Tableau Desktop and Tableau Server.
Tableau 2019.3
2019.3 brings new capabilities to help you and your organization do more with your data. Understand the “why” behind outliers with Explain Data, build trust in your data with Tableau Catalog, and operate at even greater scale with our new Tableau Server Management Add-on offering. Also enjoy enhancements such as encryption at rest, the ability to embed Ask Data, and the ability to connect to published data sources in Prep Builder.
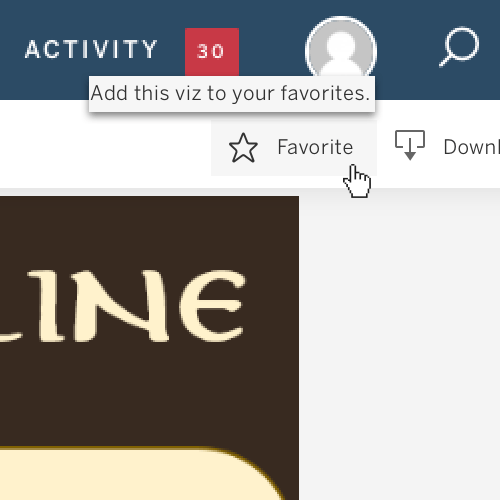
Favorite from gallery
You now have the ability to save vizzes from the Tableau Public gallery to your personal collection of favorites, making them easily accessible when searching for inspiration.
Web editing
Edit and save any of your Tableau Public vizzes directly in your browser. Any changes will be automatically updated in all embedded locations.
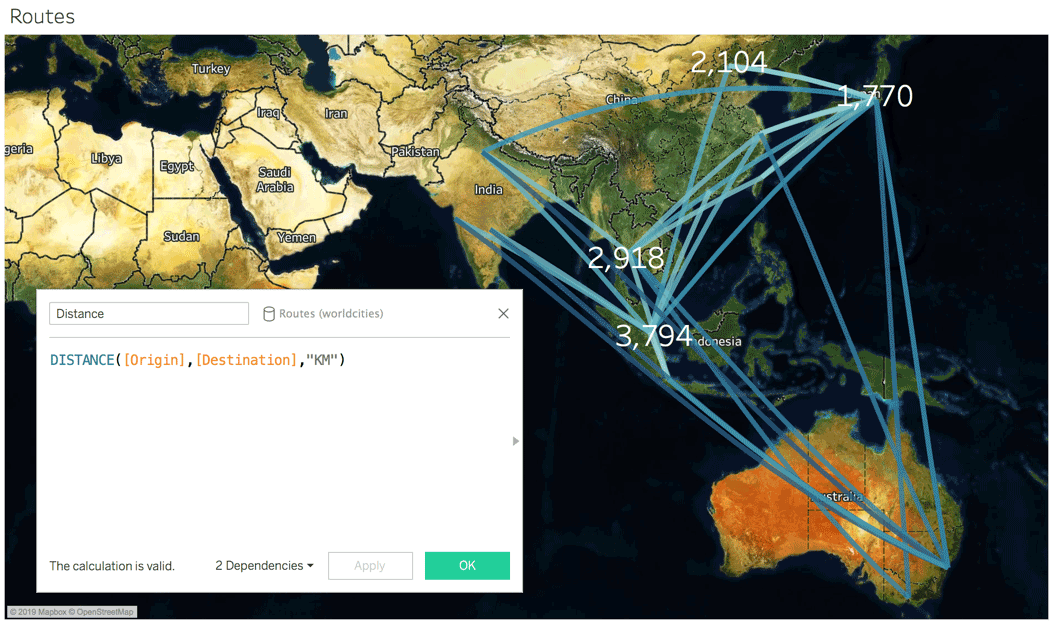
Spatial calculations: Distance
You can now easily measure the distance between two points, perfect for measuring the length of flight or shipping routes or driving proximity analysis around a store or hub.
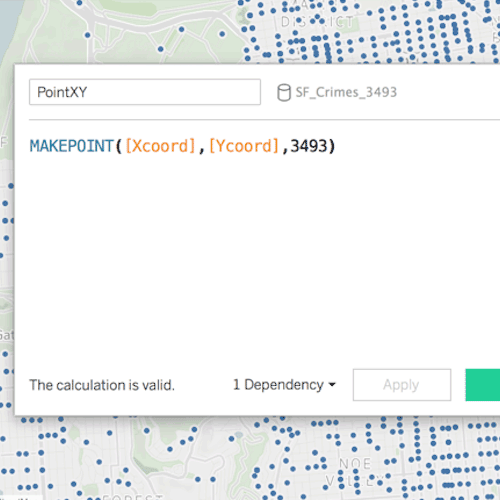
Spatial calculations: MakePoint improvements
You can now convert projected coordinates for locations, which might be in feet or meters, into latitudes and longitudes that Tableau can visualize and use in spatial joins. For instance, the Seattle Police Department logs location data using a local projection in US Feet, and can now use MakePoint to convert it directly into useable lat/long coordinates.
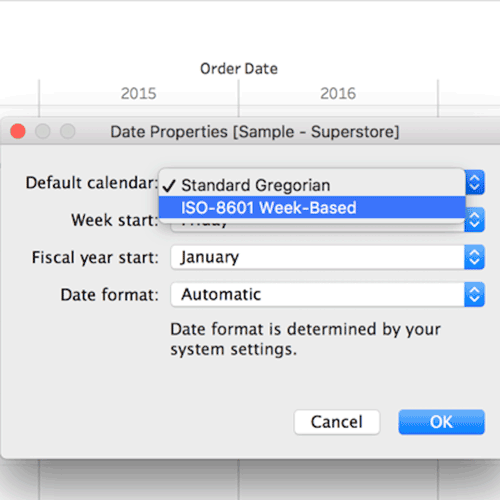
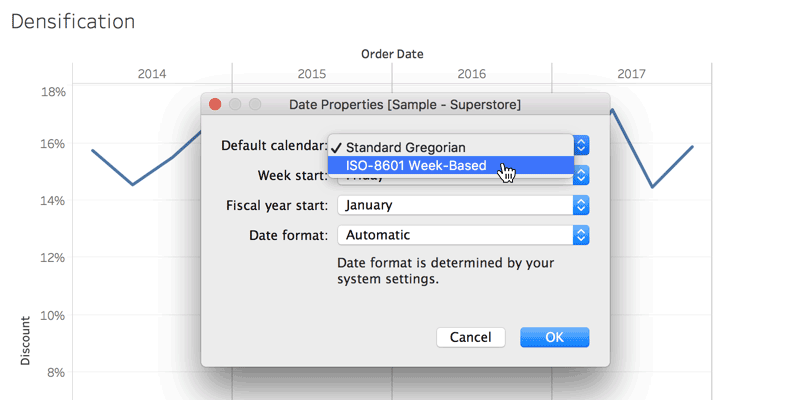
ISO-8601 calendar default
You can now set the ISO-8601 calendar so your date parts default to the iso-equivalent of year, quarter, week, and weekday for better calendar-based analysis.
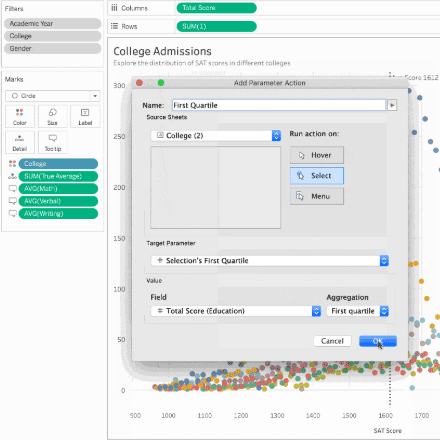
Parameter actions improvements
Parameter actions just got more powerful with three new aggregation functions: first quartile, third quartile, and concatenation. You also now have the option to create new parameters directly from the parameter action dialog.
Tableau 2019.2
2019.2 includes exciting new ways to interact with your data and new dashboarding capabilities that come together to make a big difference for a more precise, streamlined authoring experience. Enjoy parameter actions, vector maps, and a new way to browse your content on Tableau Server and Online.
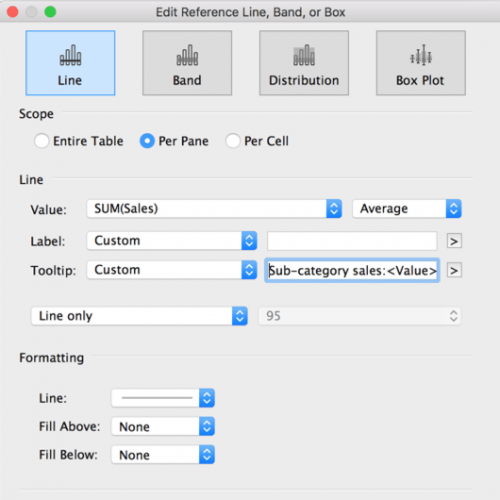
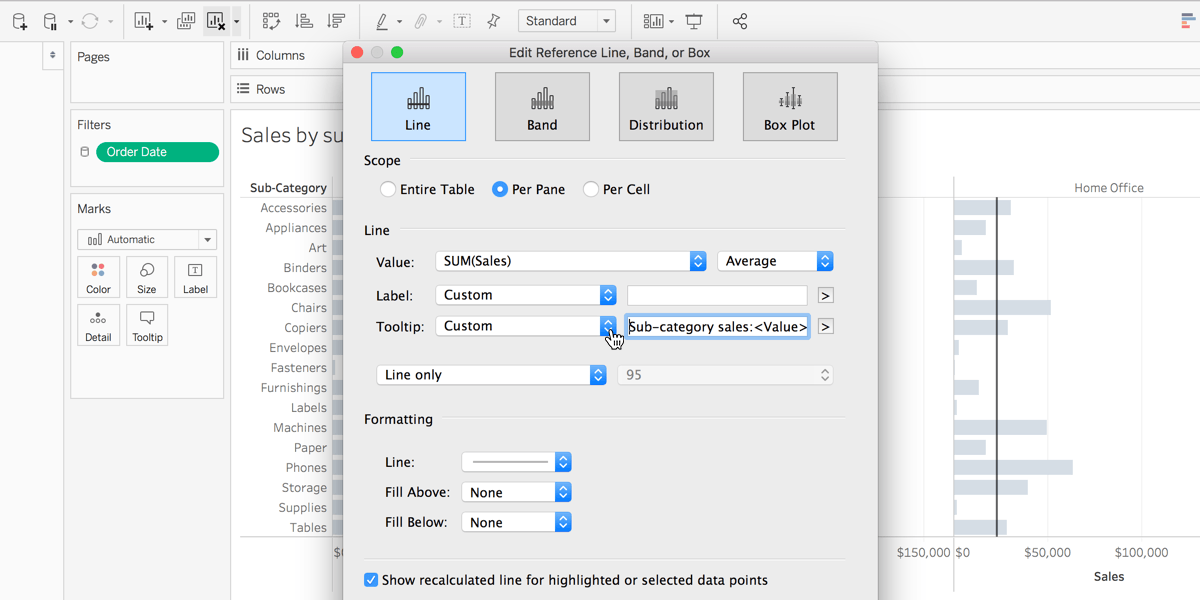
Customizable reference line tooltips
You now have the option to customize tooltips for reference lines, bands, and distributions. Edit the tooltip text, or choose to disable the tooltip altogether.
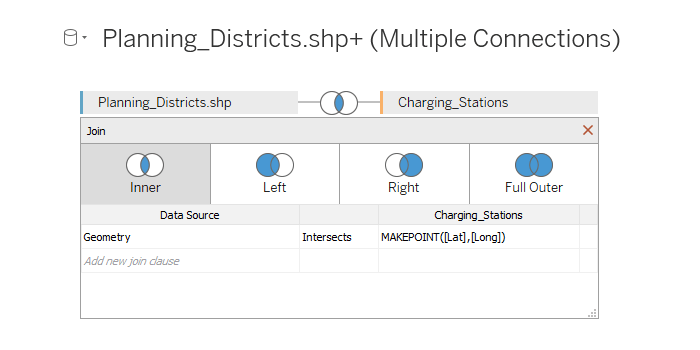
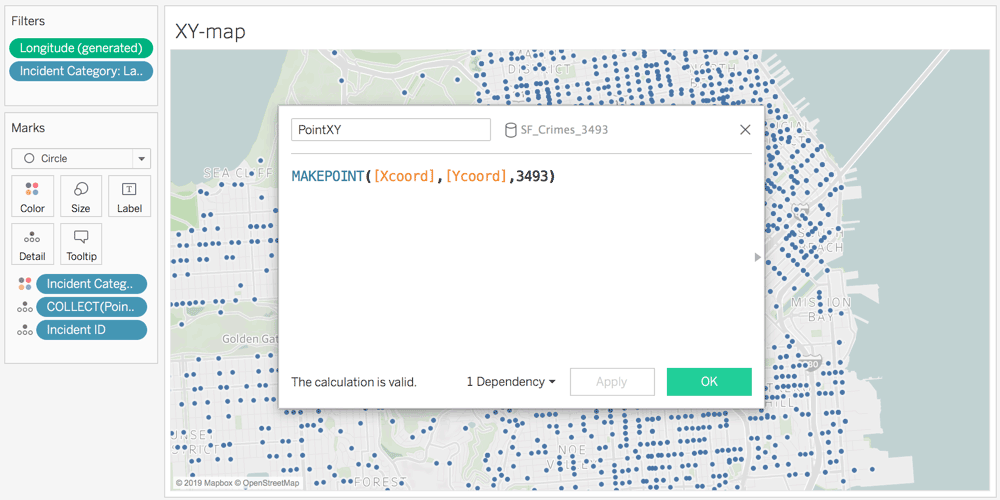
Spatial calculations: MakePoint
You can now turn latitude/longitude values from text files, excel, or any data source into spatial fields and use them in spatial joins. With MakePoint, you can spatially enable text files and excel spreadsheets, making it easer to spatially aggregate your data.
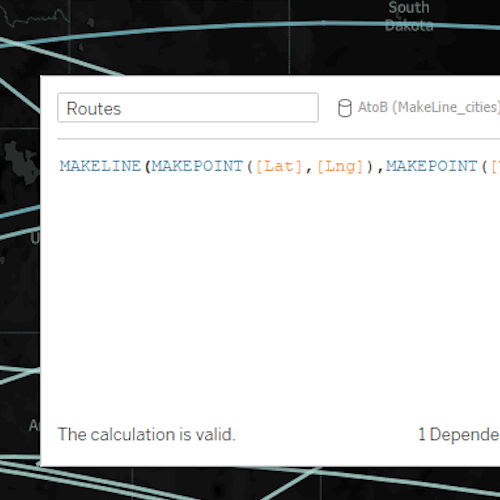
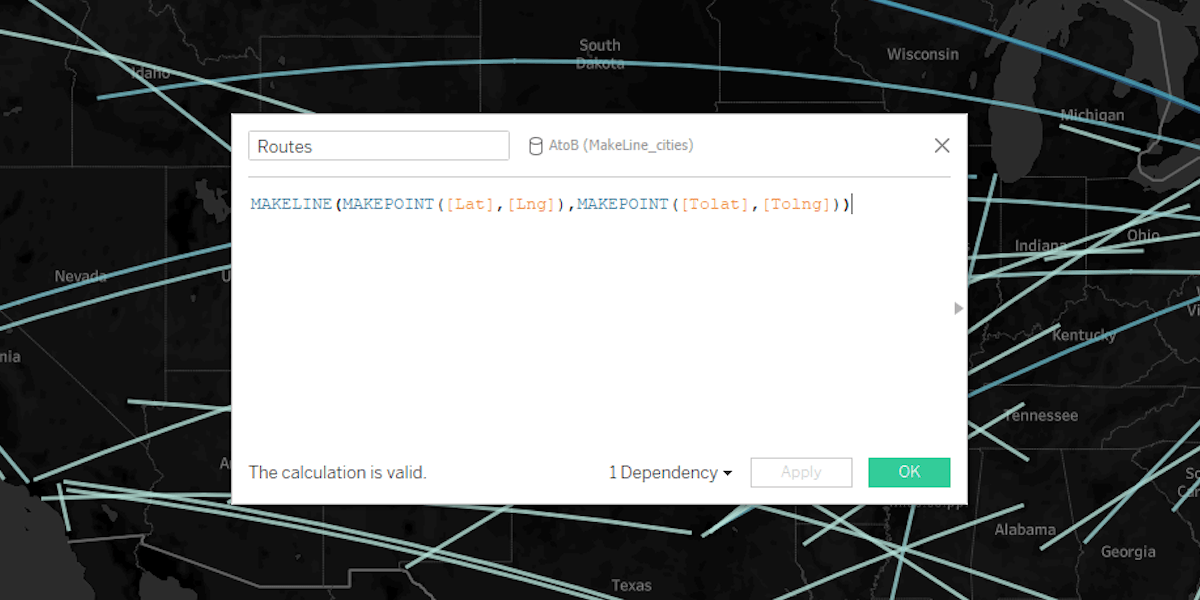
Spatial calculations: MakeLine
You can now easily create two-point origin-destination maps, perfect for making flight maps of airline routes.
Parameter actions
You now have the ability to visually change a parameter’s value. Use parameter actions to drive reference lines, calculations, filters, and SQL queries simply by interacting with marks on a viz, bringing visual interactivity to your data like never before.
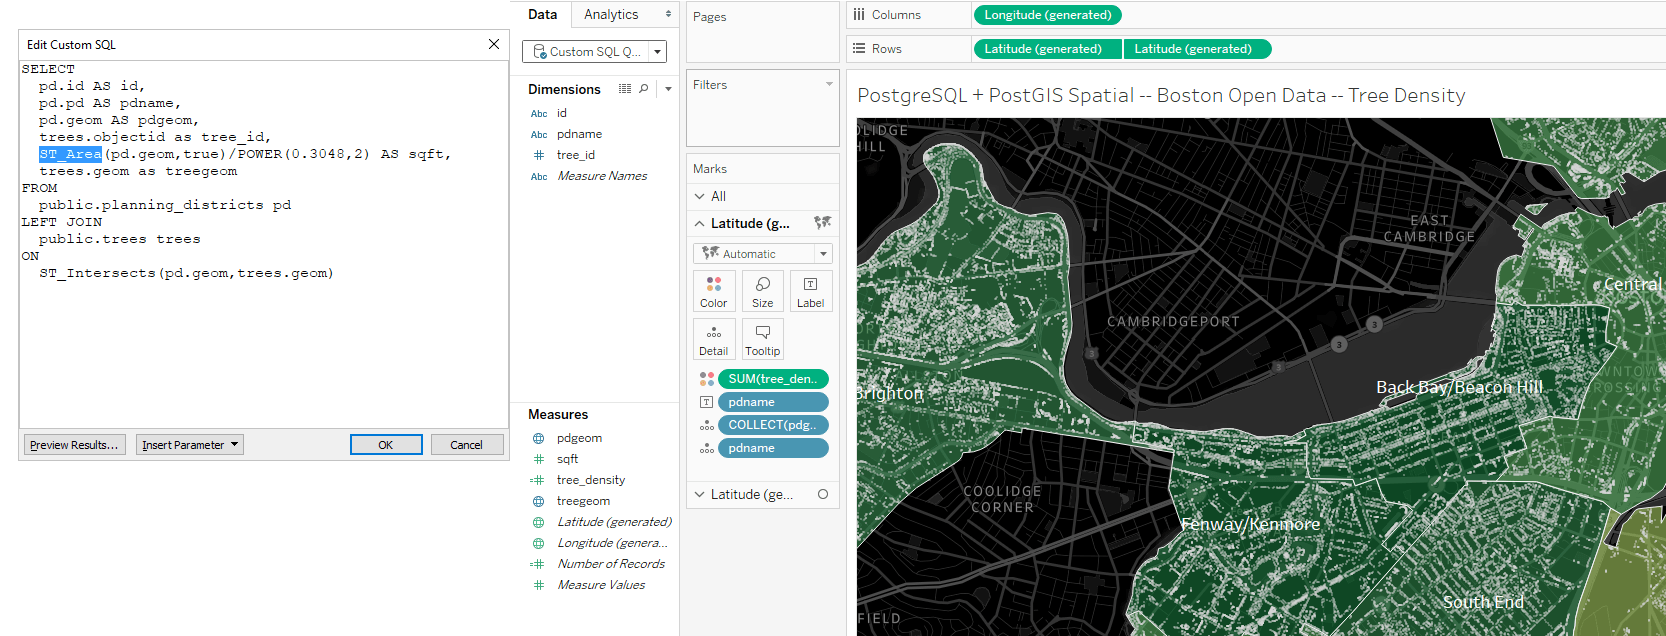
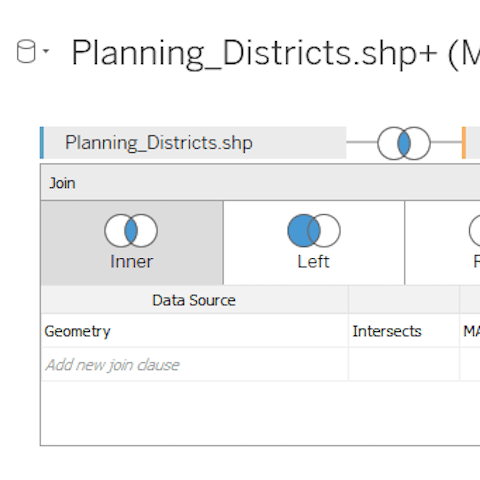
PostgreSQL+PostGIS Spatial support
You will now be able to use spatial data directly from a PostgreSQL or Pivotal Greenplum database with the PostGIS extension. No need to export or pre-process the data before diving into it in Tableau. And perform more advanced spatial analysis with the ability to now leverage the spatial operations supported by the database.
Show/hide dashboard containers
Maximize screen real estate with the flexibility to toggle between visible or hidden for any floating container on your dashboard. Streamline what content viewers see, such as customizing instructions, filters, or legends to be hidden when they are no longer useful.
Tableau 2019.1
2019.1 includes the launch of Ask Data, an entirely new way to interact with your data in Tableau, as well as Tableau Prep Conductor, a new add-on to Tableau Online and Server that enables data preparation at scale by automating processes and flows. Also enjoy data-driven alert views, dashboard zone names, and URL action improvements.
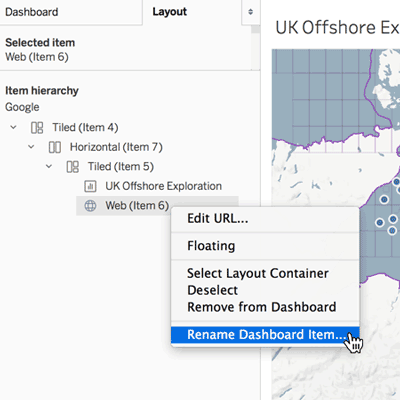
Dashboard zone names
You now have the ability to assign a name to any item on a dashboard, helping to better organize multiple zones when looking at the layout tree.
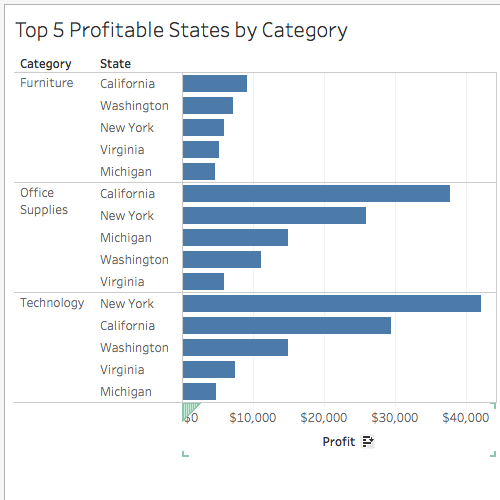
Nested sorting improvements
Sorting just got more intuitive. You can now sort within multiple dimensions, making it easy to spot trends in your categorical data.
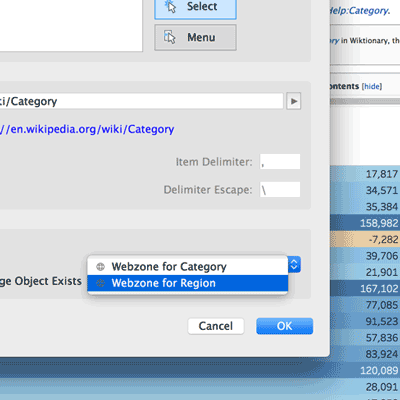
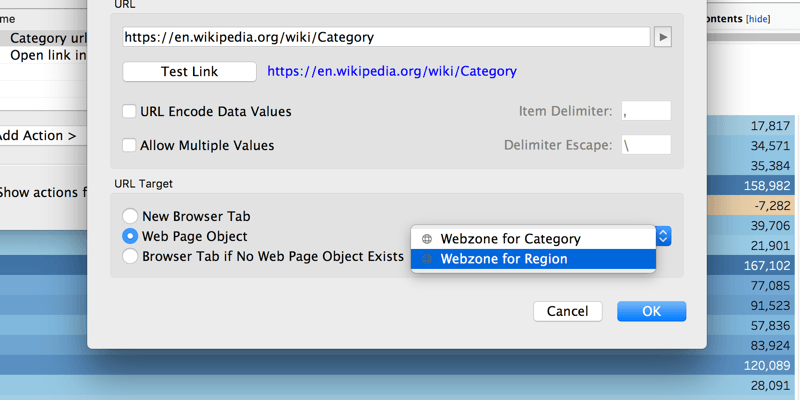
Url action improvements
Url actions can now target specific web zones in a dashboard, allowing authors the control to more seamlessly link to information that is hosted outside of their data source. Better integrate and add more meaningful content to your dashboard, and design more sophisticated app-like experiences.
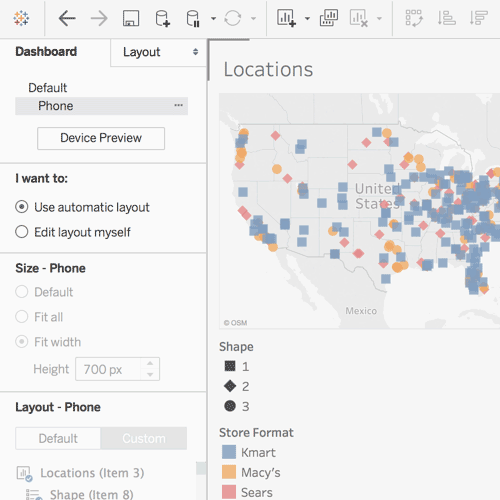
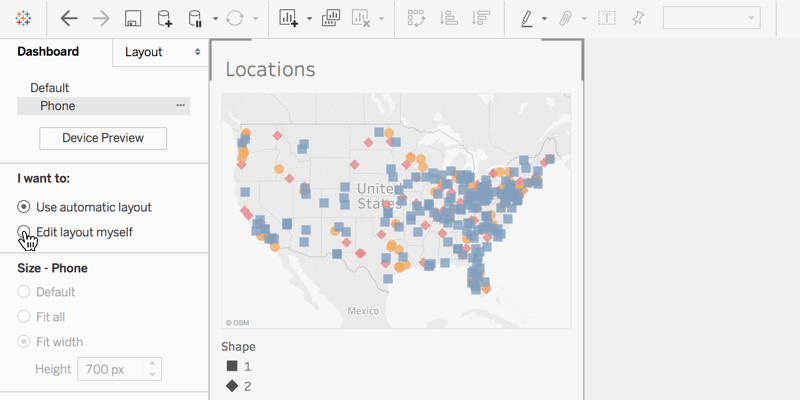
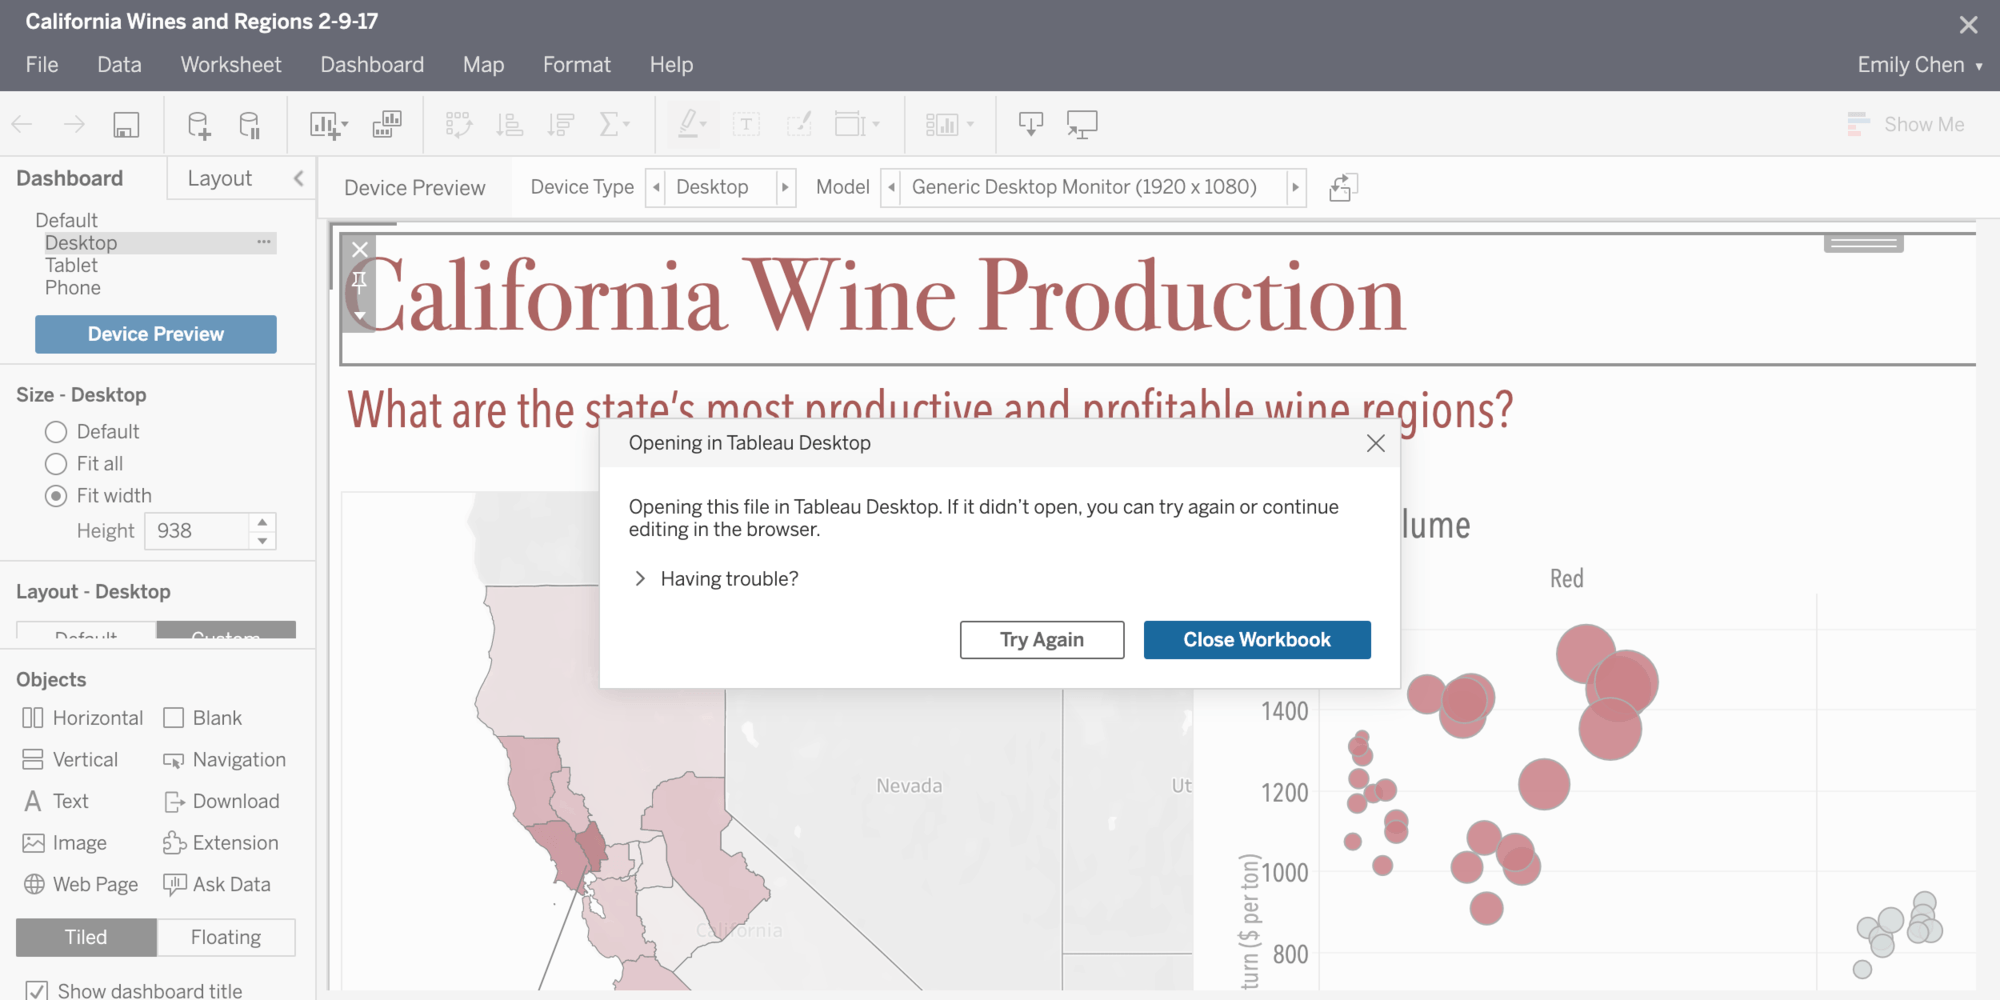
Automatic dashboard phone layouts
Authoring mobile dashboard layouts just got easier. Tableau will now automatically add phone layouts to new dashboards, with ability to further customize them for specific use cases.

OAuth enabled for Snowflake Connector
We’ve significantly improved the Snowflake connection experience. The Snowflake Connector is now available across our entire platform and we have added native OAuth integration for both security and convenience.
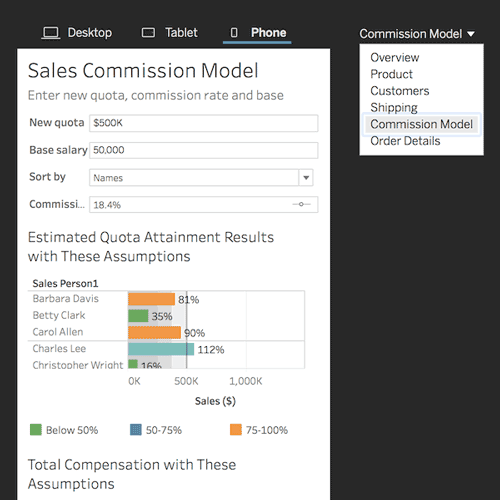
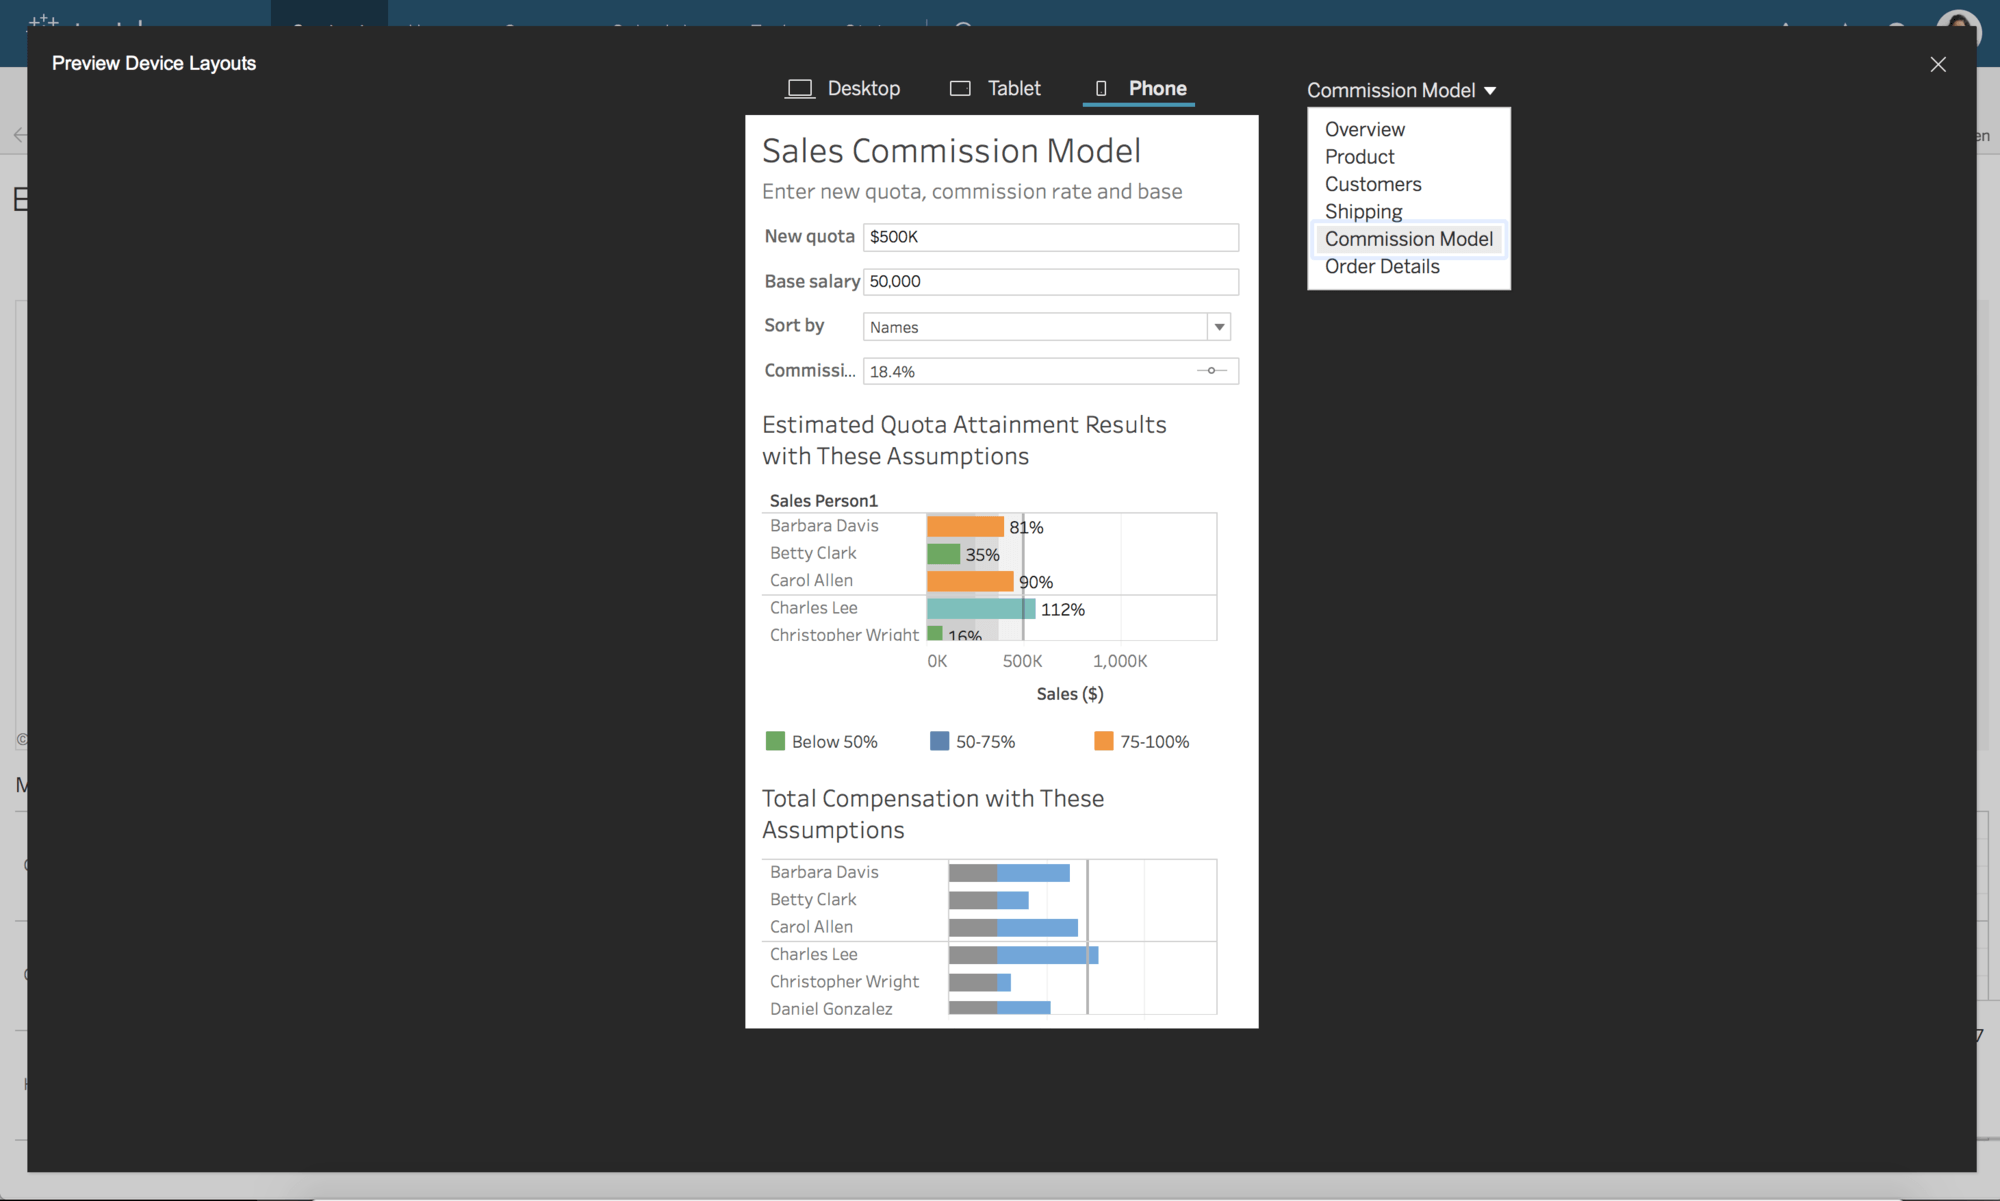
Device layout preview on the web
Device dashboard design just got easier. You can now preview what your laptop, tablet, and phone layouts will look like directly in the desktop browser. Make any necessary formatting or content adjustments to your dashboards, and save knowing your mobile layouts are pixel perfect.