Tableau 2019.3 Features
Explore the newest features in Tableau 2019.3 including Explain Data, Tableau Catalog,
and Tableau Server Management Add-on
New feature highlights
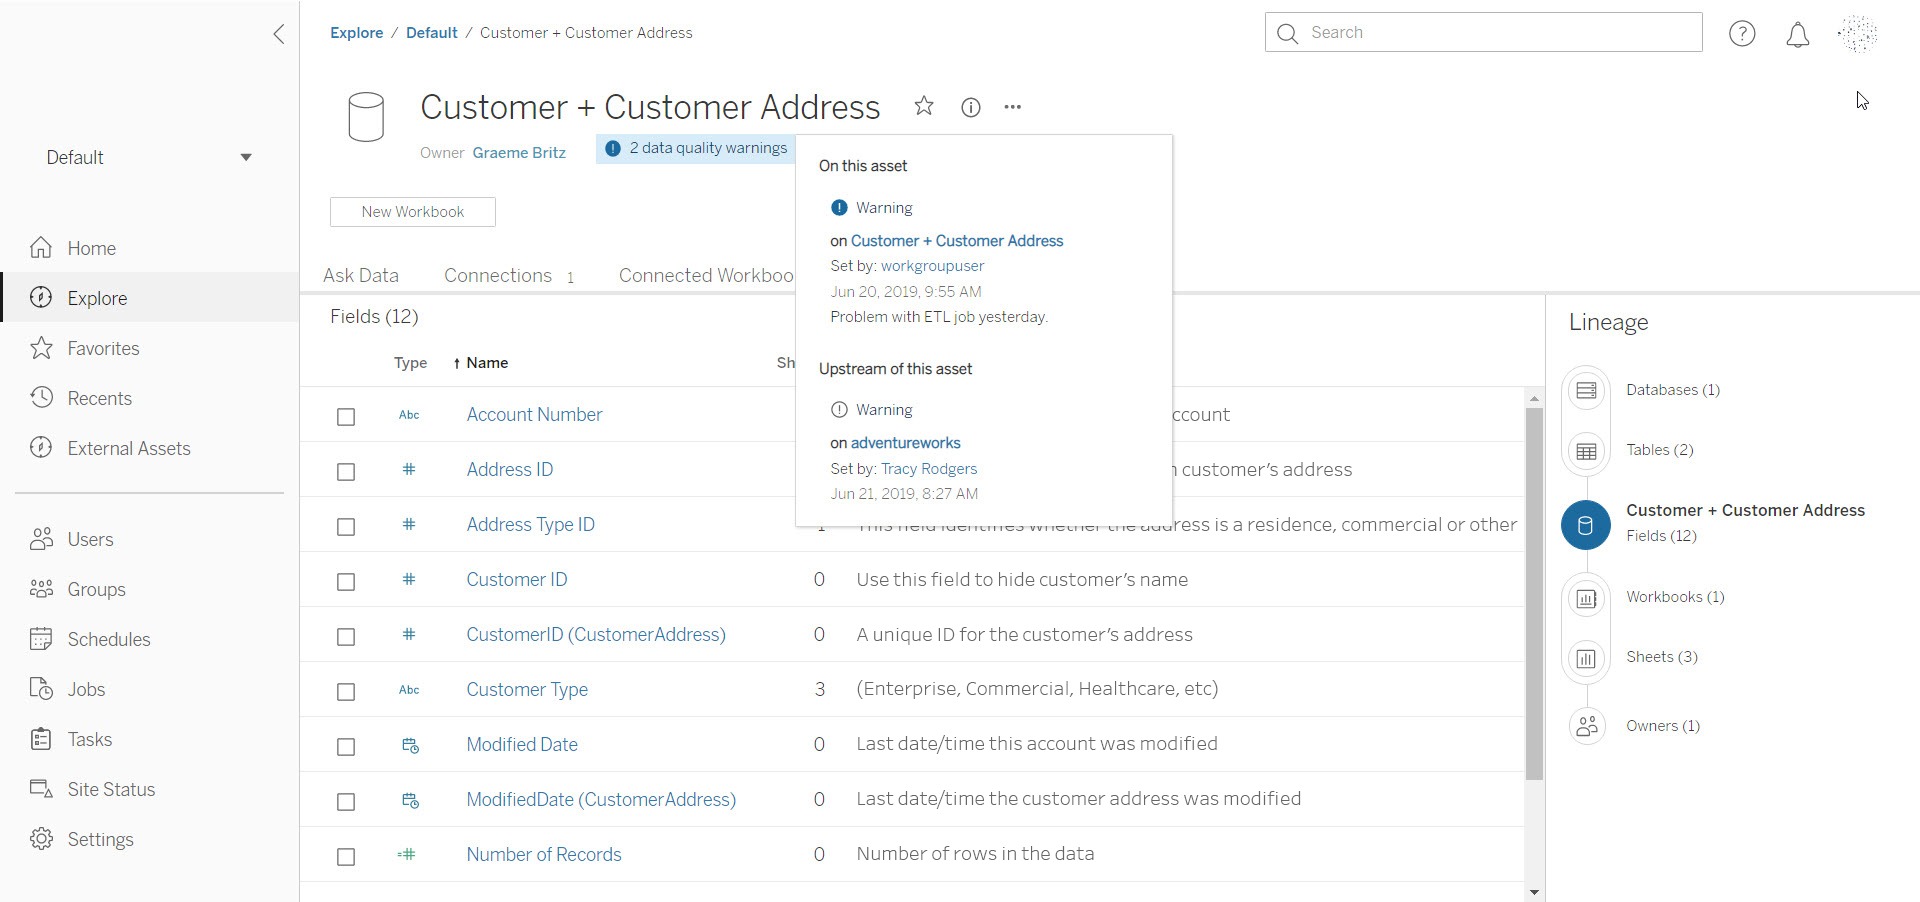
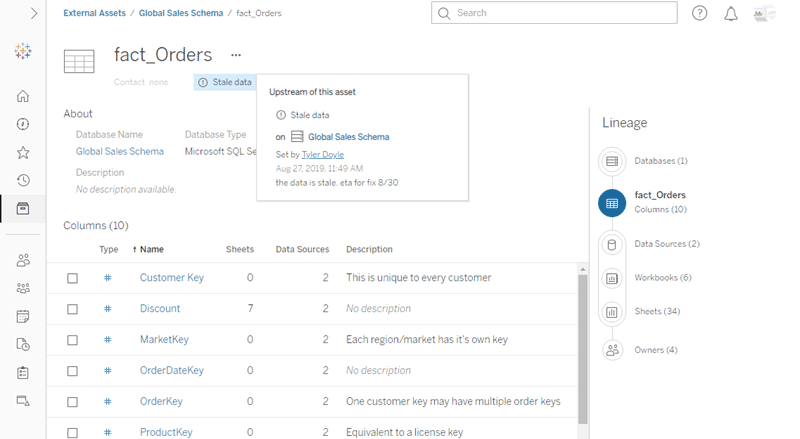
Tableau Catalog
With Tableau Catalog you get a complete view of all of the data being used by Tableau, and how it is connected to your analytics – including lineage, impact analysis and usage metrics. Increase the trust and discoverability of the right data for everyone in your organization. Tableau Catalog is part of the Data Management Add-on.
Learn more about Tableau Catalog
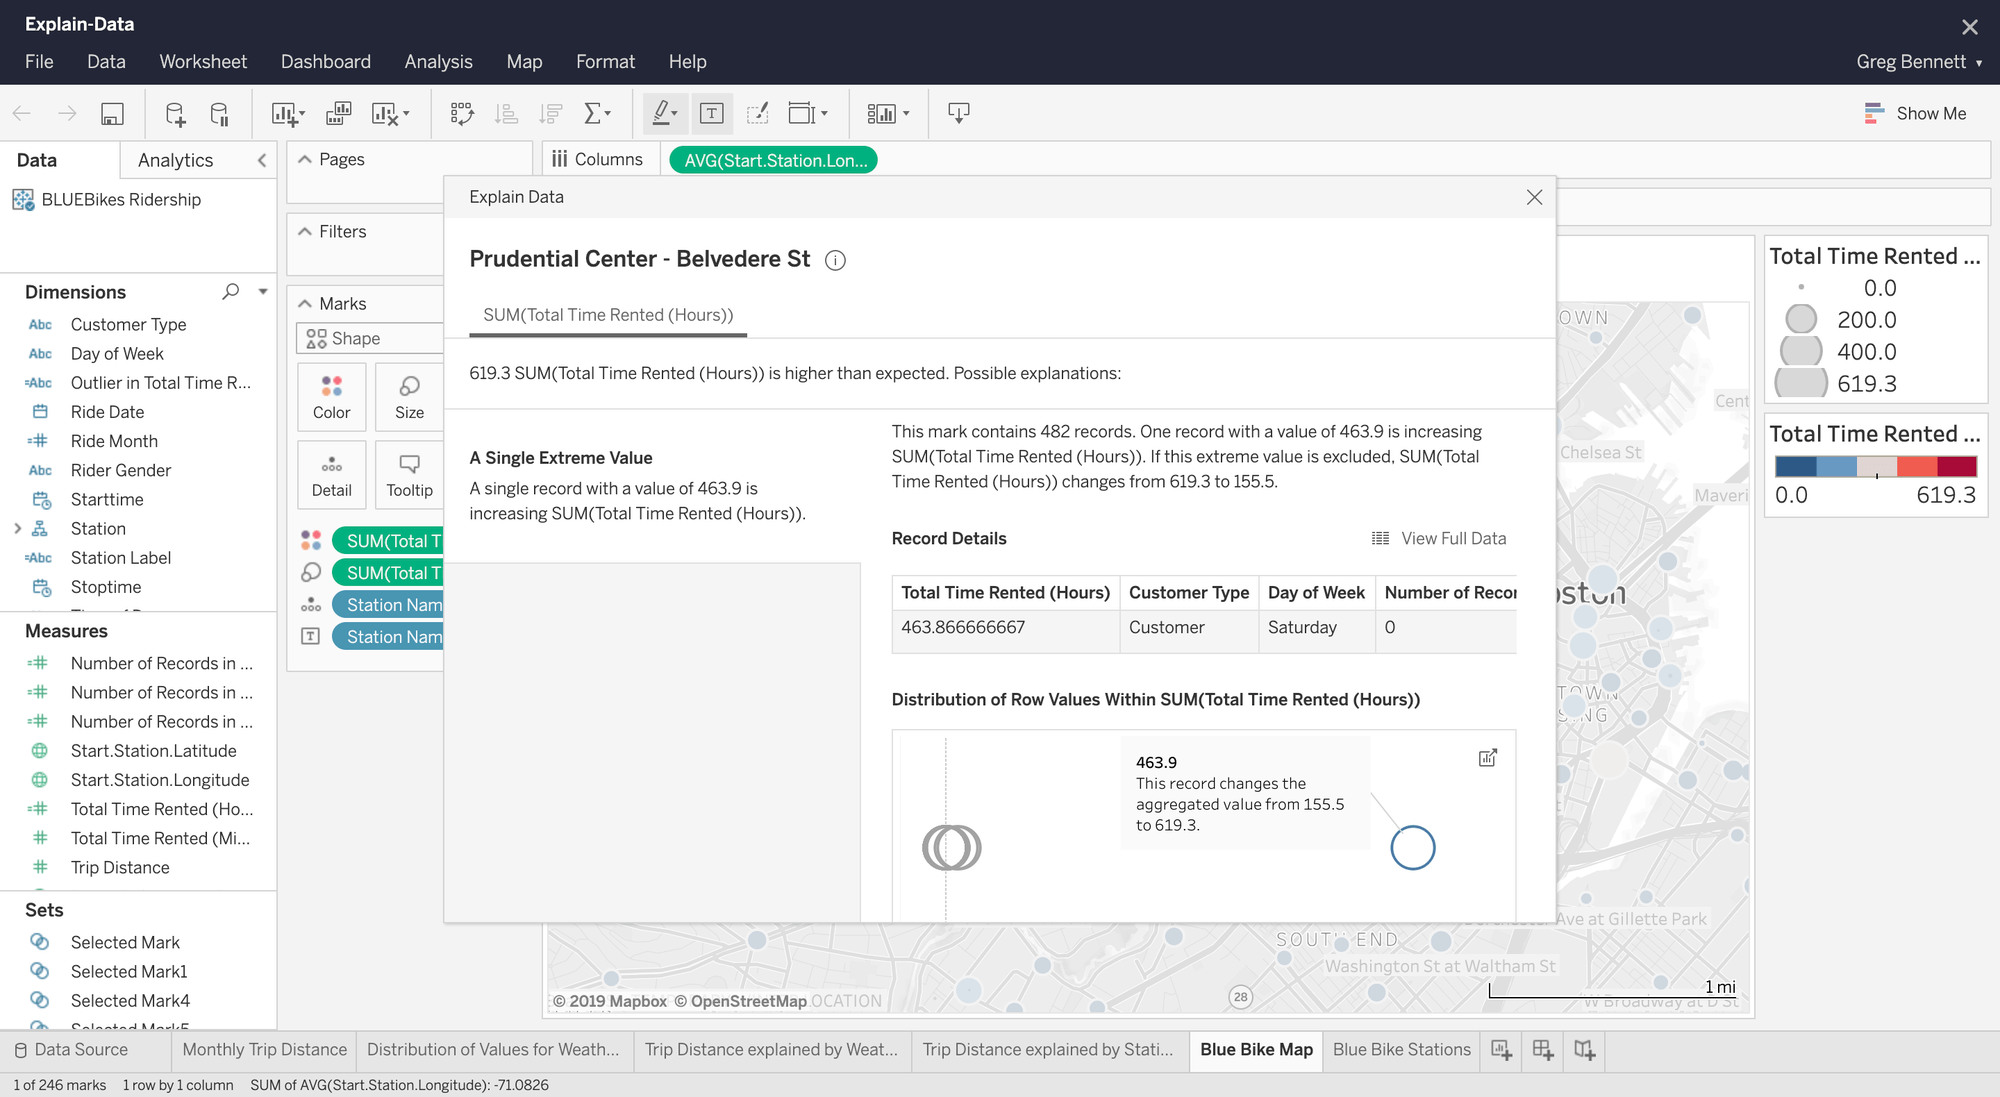
Explain Data
Explain Data automatically provides AI-driven explanations for unexpected values in your data with a single click. Available as you’re creating a viz or dashboard, Explain Data uses powerful Bayesian methods to surface statistically significant explanations behind data points. Behind the scenes, hundreds of potential explanations are checked and the most likely ones are surfaced. Every explanation is a viz that can be explored with the full power of Tableau, keeping you in your analytical flow as you dive deeper into your data.
Learn more about Explain DataExplain Data allows anyone, whatever their level of data knowledge, to explore their data and ‘go beyond the number’ to understand not only the what, but also the why – the true definition of democratizing data.
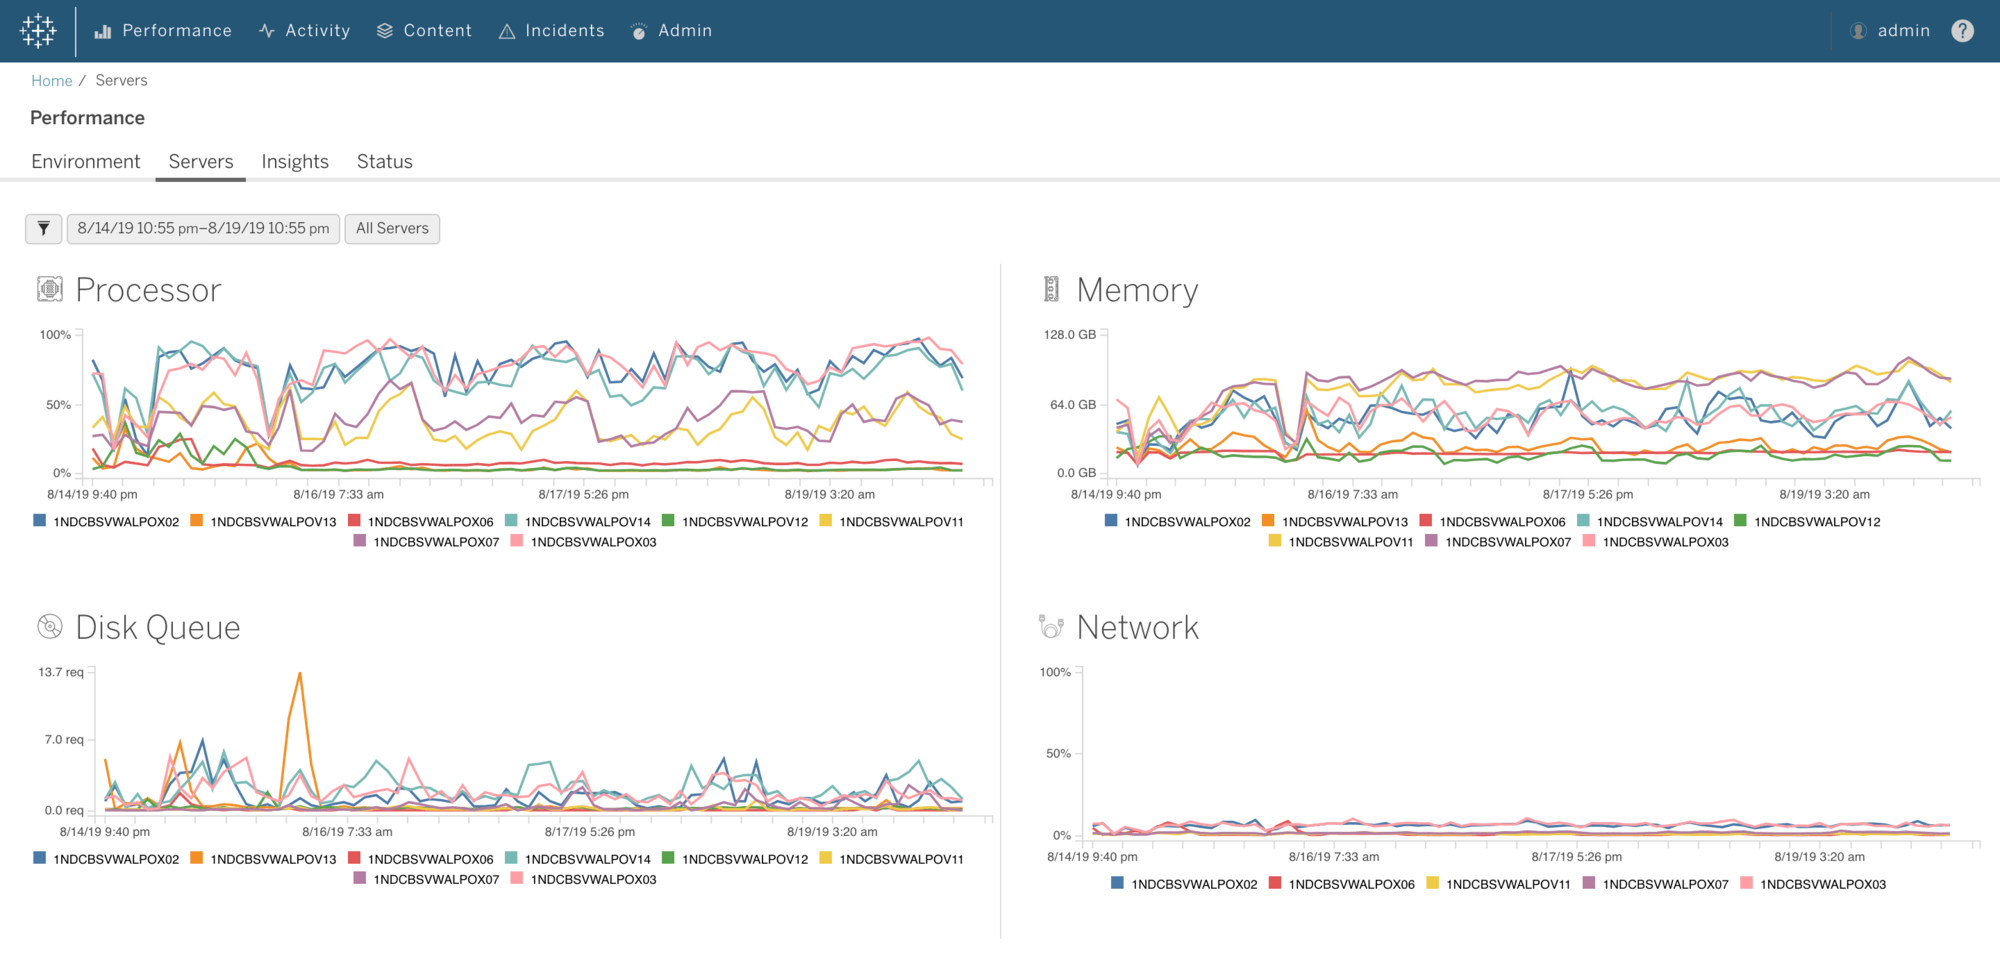
Tableau Server Management Add-on
The Tableau Server Management Add-on gives organizations running Tableau Server at scale greater manageability and control over their deployment. We’re making it easier to streamline management processes and run large, mission-critical Tableau Server deployments. This new offering provides AWS KMS integration, new performance monitoring and content management apps, and additional scalability capabilities for Tableau Server.
Learn more about Server Management Add-on
Coming to you from Tableau HQ in Seattle!
Tune in for an overview highlighting the innovations of Tableau 2019.3.
Watch now
Tableau 2019.3 deep dive
Join analytics and Tableau experts as they outline Tableau’s latest release. Learn more about the recent innovations that help you build trust in your data and help users quickly go from the “what” to “why” more effectively.
Sign upAll Features
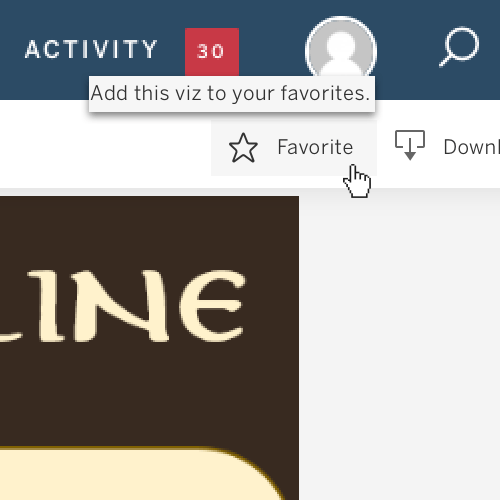
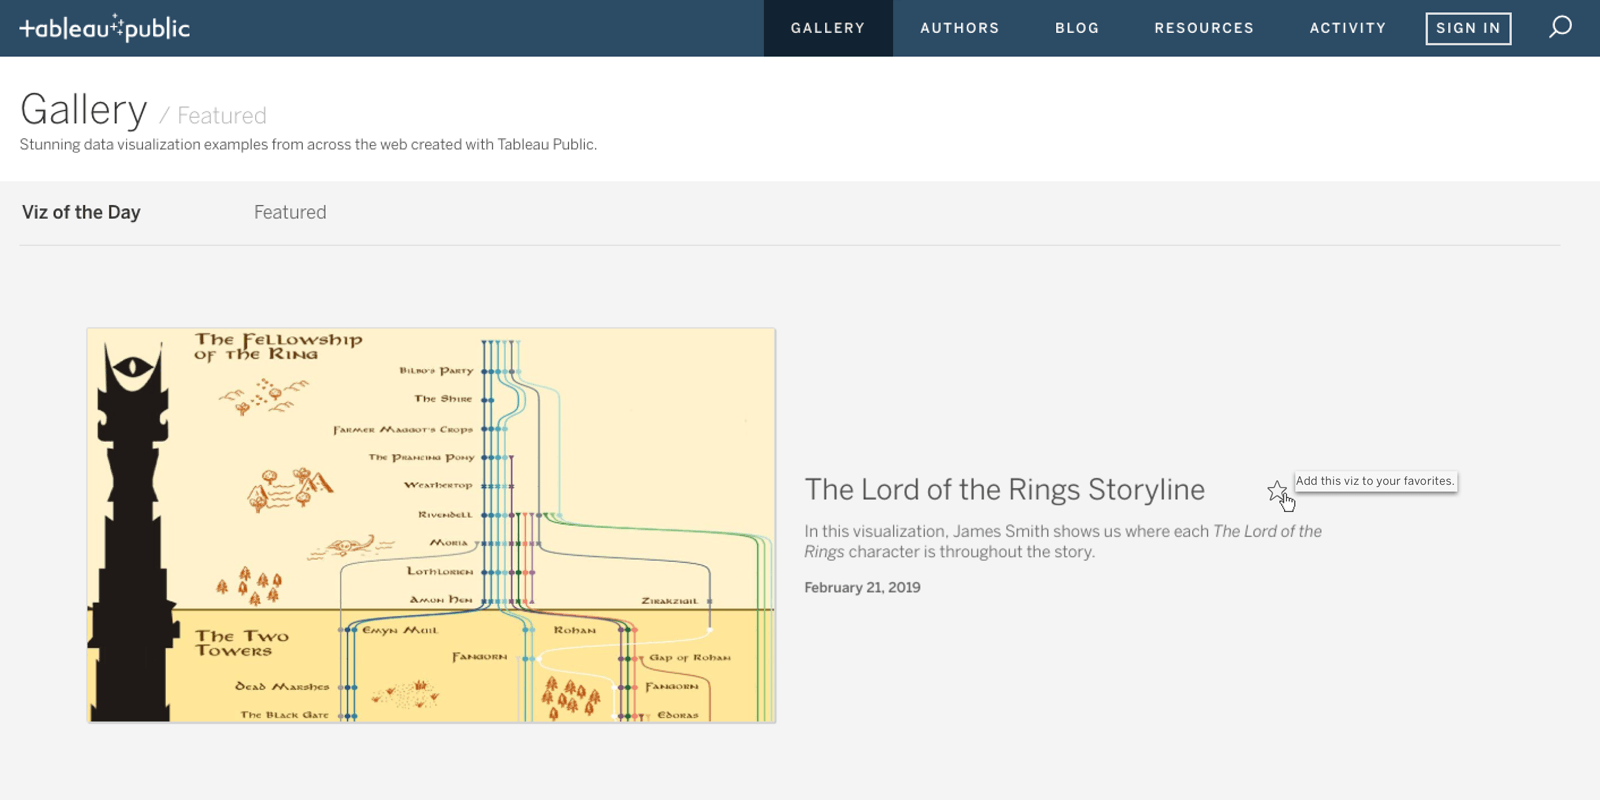
Favorite from gallery
You now have the ability to save vizzes from the Tableau Public gallery to your personal collection of favorites, making them easily accessible when searching for inspiration.
Web editing
Edit and save any of your Tableau Public vizzes directly in your browser. Any changes will be automatically updated in all embedded locations.
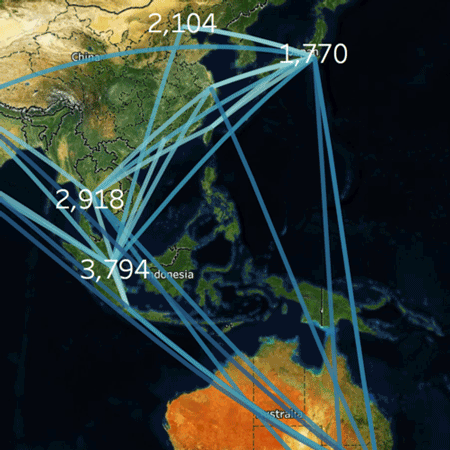
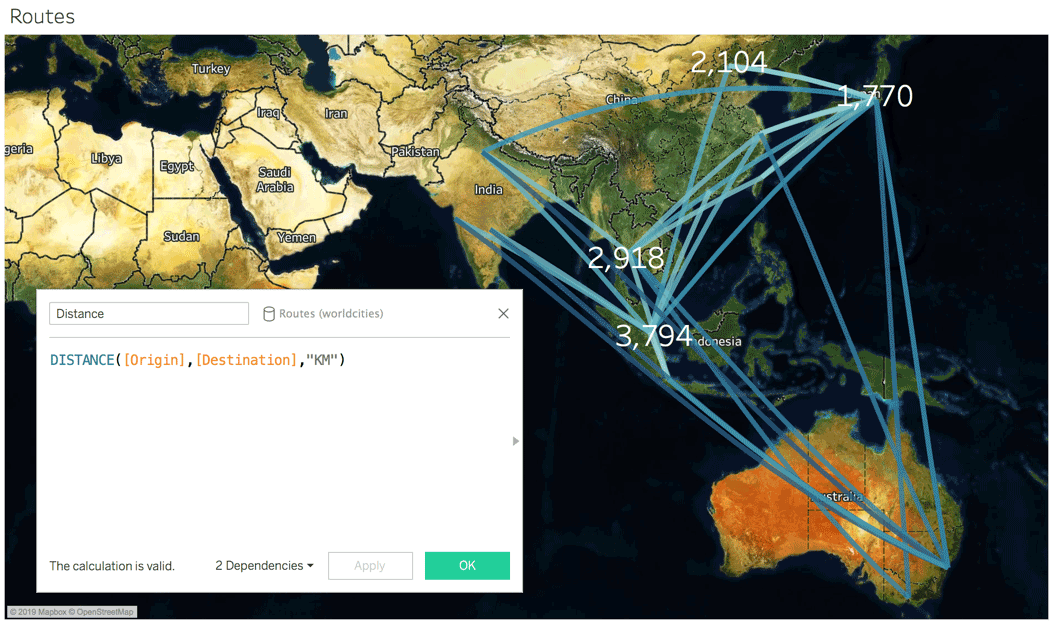
Spatial calculations: Distance
You can now easily measure the distance between two points, perfect for measuring the length of flight or shipping routes or driving proximity analysis around a store or hub.
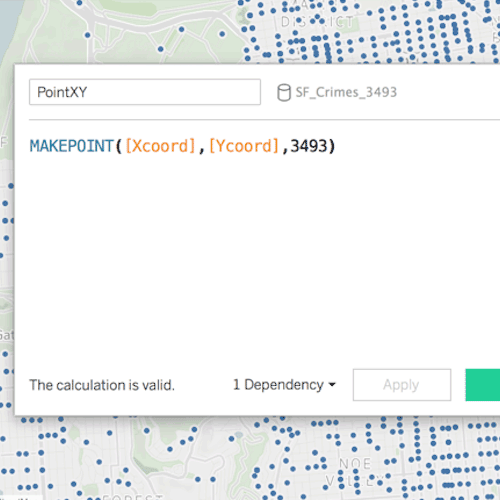
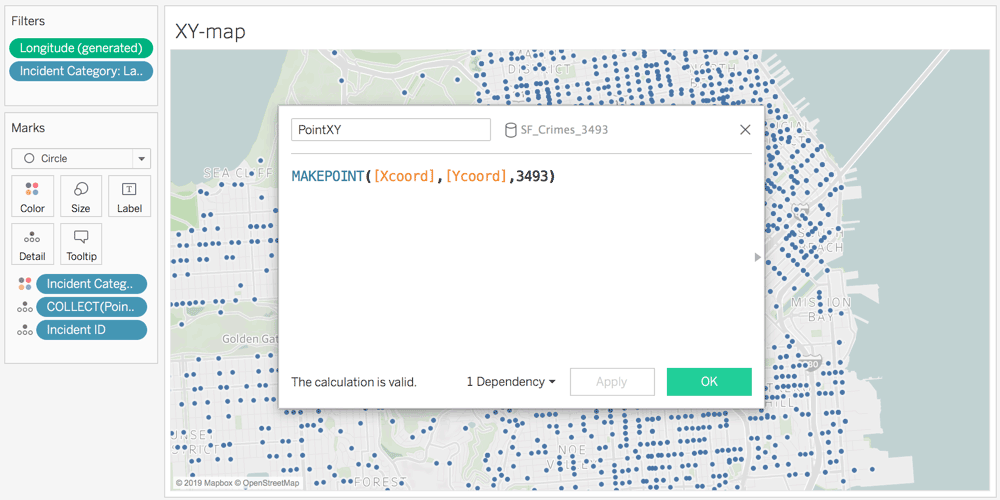
Spatial calculations: MakePoint improvements
You can now convert projected coordinates for locations, which might be in feet or meters, into latitudes and longitudes that Tableau can visualize and use in spatial joins. For instance, the Seattle Police Department logs location data using a local projection in US Feet, and can now use MakePoint to convert it directly into useable lat/long coordinates.
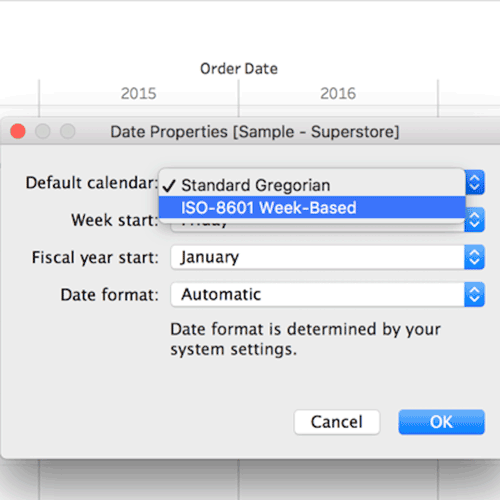
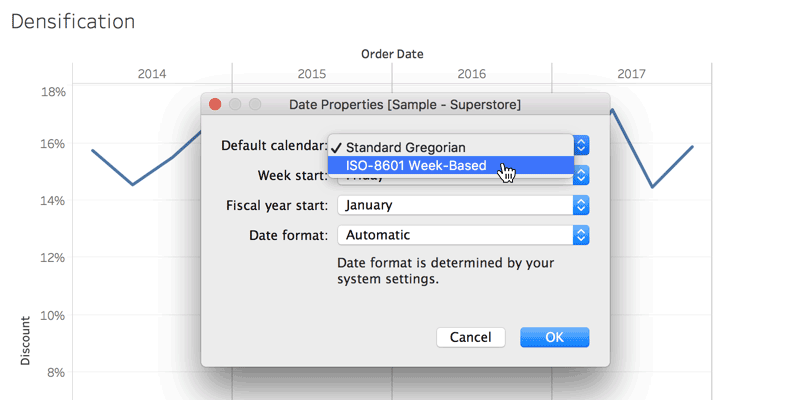
ISO-8601 calendar default
You can now set the ISO-8601 calendar so your date parts default to the iso-equivalent of year, quarter, week, and weekday for better calendar-based analysis.
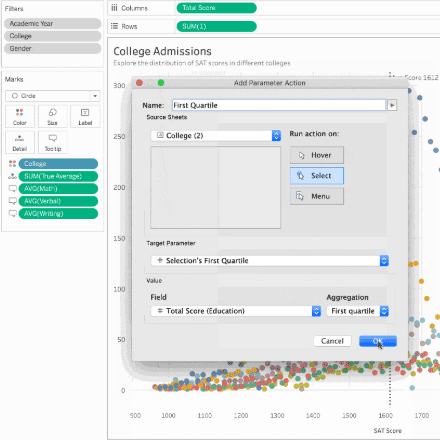
Parameter actions improvements
Parameter actions just got more powerful with three new aggregation functions: first quartile, third quartile, and concatenation. You also now have the option to create new parameters directly from the parameter action dialog.
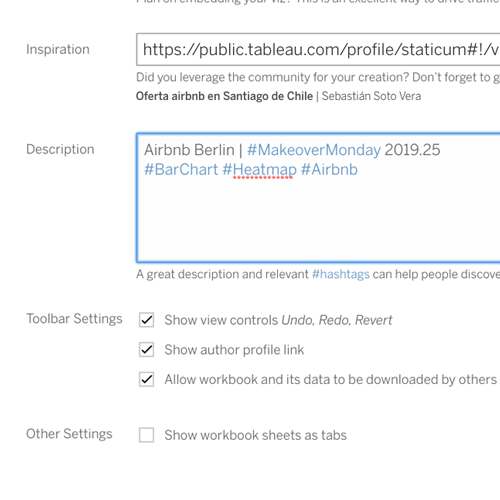
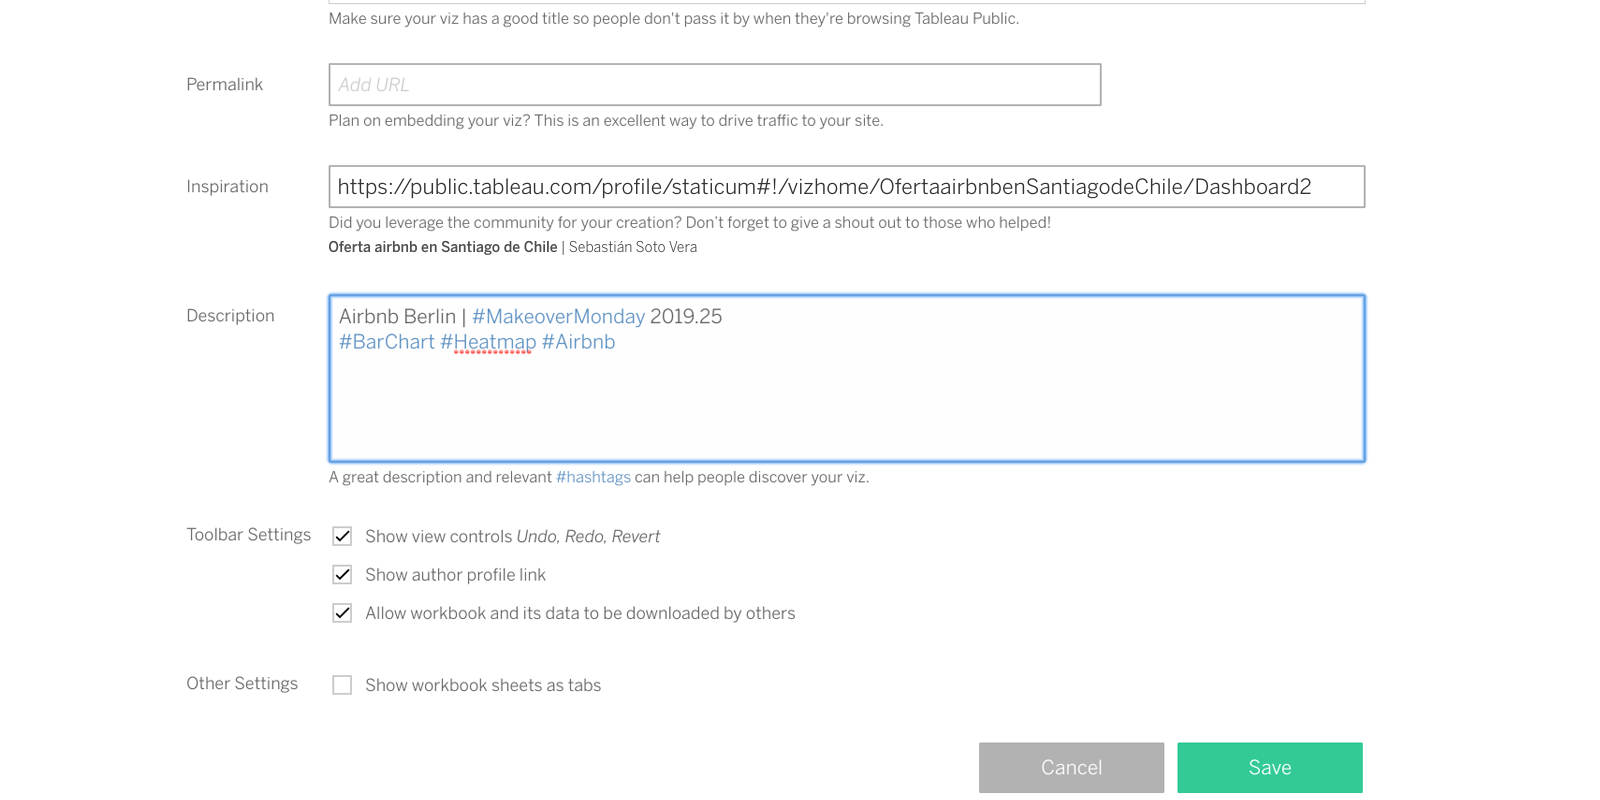
Hashtags
Add hashtags to your Tableau Public profile and viz descriptions for better discoverability in search. Click on a hashtag to view related content.
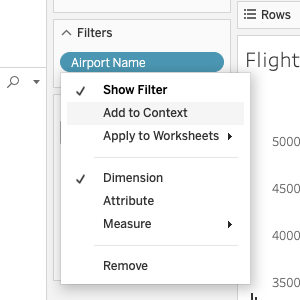
Web Authoring improvements
New in web authoring: Update to context filters on the web. Quickly identify and change filters between context and dependent without leaving the browser. Cancel long-running queries so you can move on to the next task faster.
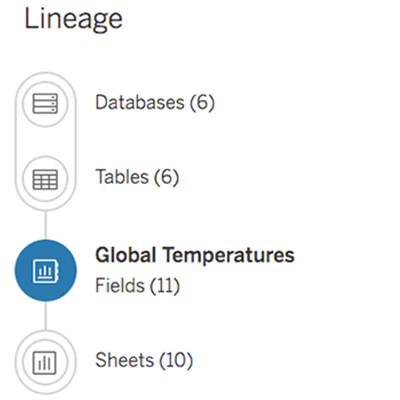
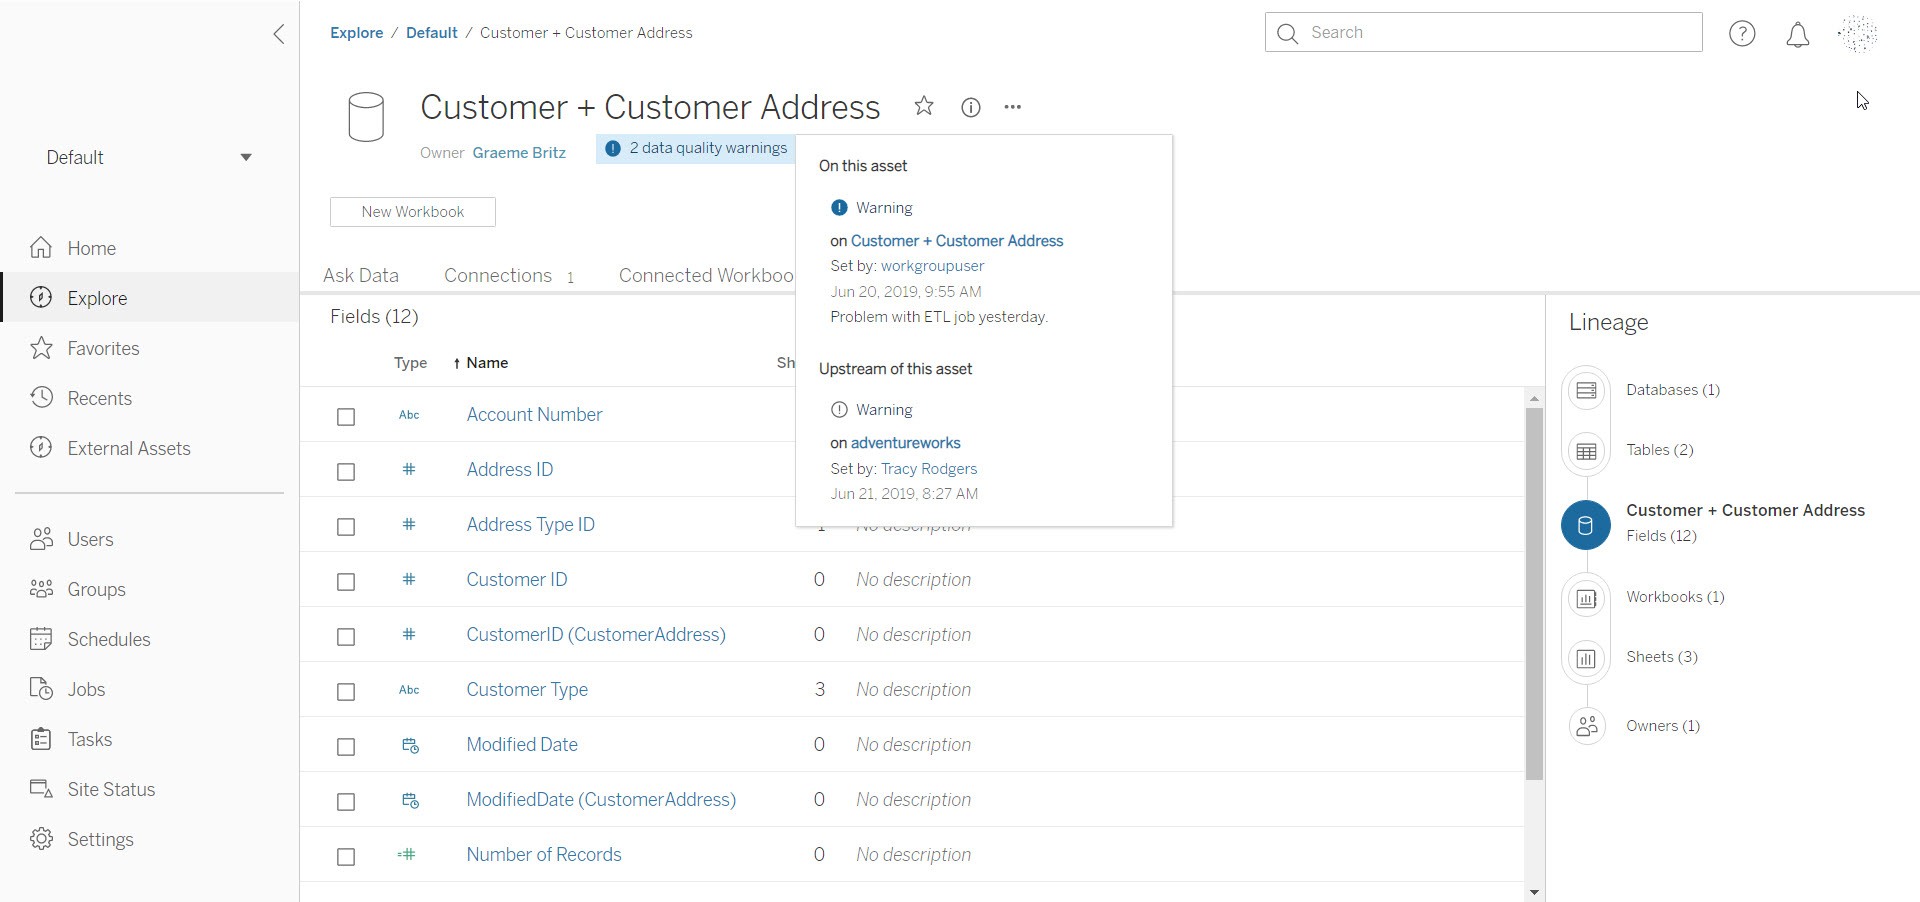
Tableau Catalog
With Tableau Catalog you get a complete view of all of the data being used by Tableau, and how it is connected to your analytics – including lineage, impact analysis and usage metrics. Increase the trust and discoverability of the right data for everyone in your organization. Tableau Catalog is part of the Data Management Add-on.
Learn more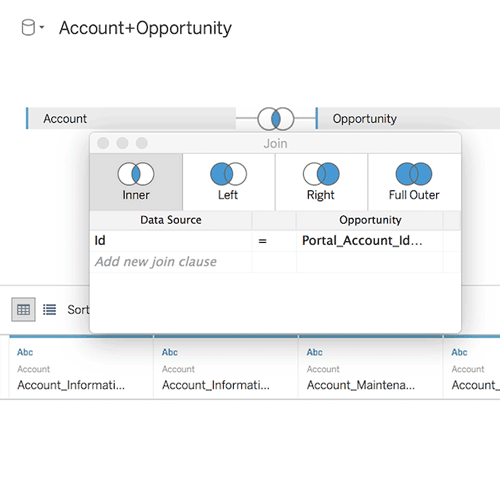
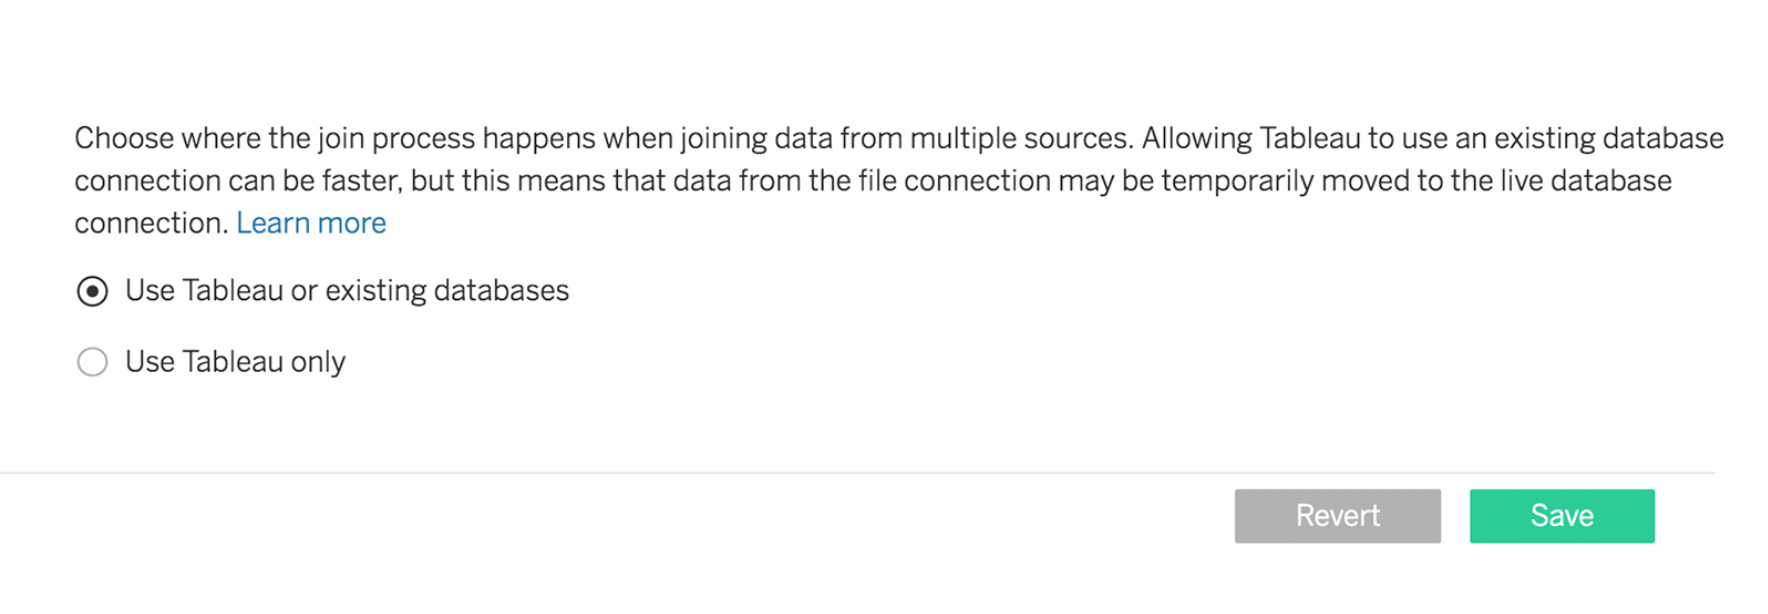
Optimized joins
Optimize your joins. You can now control if your join is executed in Hyper, or the source database. Control this option from Tableau Desktop or at the site level in Tableau Server or Tableau Online.
Databricks Connector
For customers using Spark, you can now take full advantage of the innovation of Databricks as a native connector. Available for Tableau Desktop and Tableau Server.

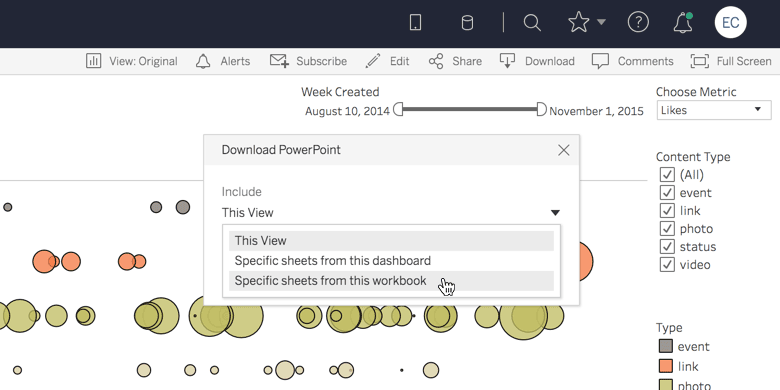
Export to PowerPoint improvements
Select relevant, specific dashboards to integrate into your presentations. You now have the option to select which sheets, dashboards, or stories to export to PowerPoint.
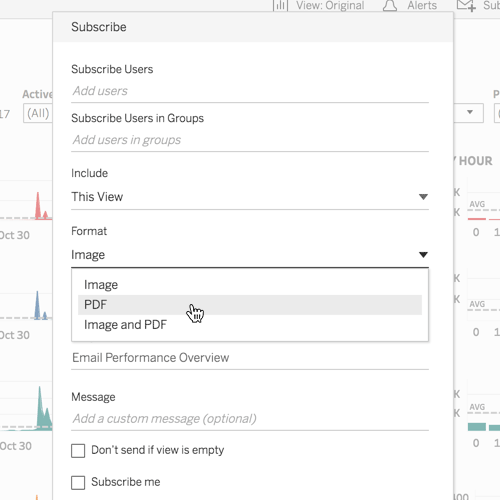
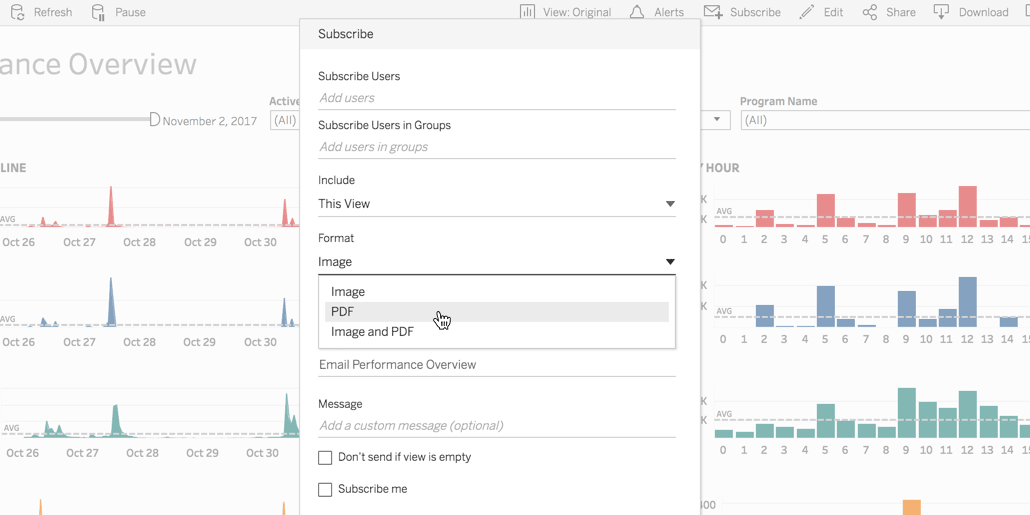
PDF attachment to subscriptions
Consolidate your workflows with the option to receive a PDF attachment with your subscription to a dashboard. You can select to attach an image, PDF, or PDF and image, which will land in your inbox as part of your regular subscription email.
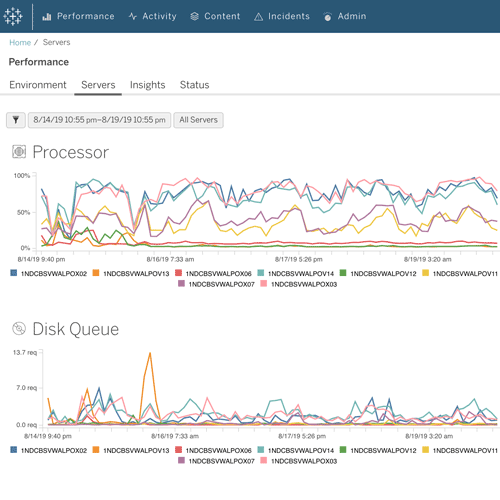

Tableau Server Management Add-on
Advanced Management for Tableau Server gives organizations running Tableau Server at scale greater manageability and control over their deployment. We’re making it easier to streamline management processes and run large, mission-critical Tableau Server deployments. This new offering provides AWS KMS integration, new performance monitoring and content management apps, and additional scalability capabilities for Tableau Server.
Learn more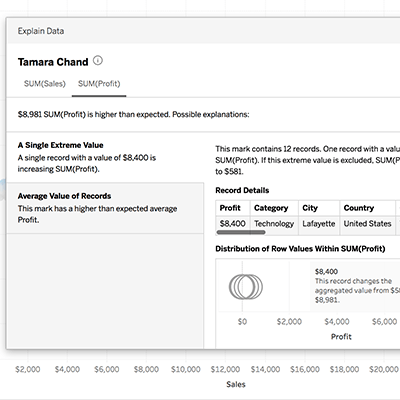
Explain Data
Explain Data automatically provides AI-driven explanations for unexpected values in your data with a single click. Available as you’re creating a viz or dashboard, Explain Data uses powerful Bayesian methods to surface statistically significant explanations behind data points. Behind the scenes, hundreds of potential explanations are checked and the most likely ones are surfaced. Every explanation is a viz that can be explored with the full power of Tableau, keeping you in your analytical flow as you dive deeper into your data.
Learn more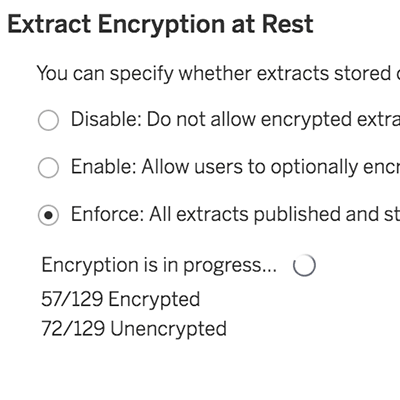
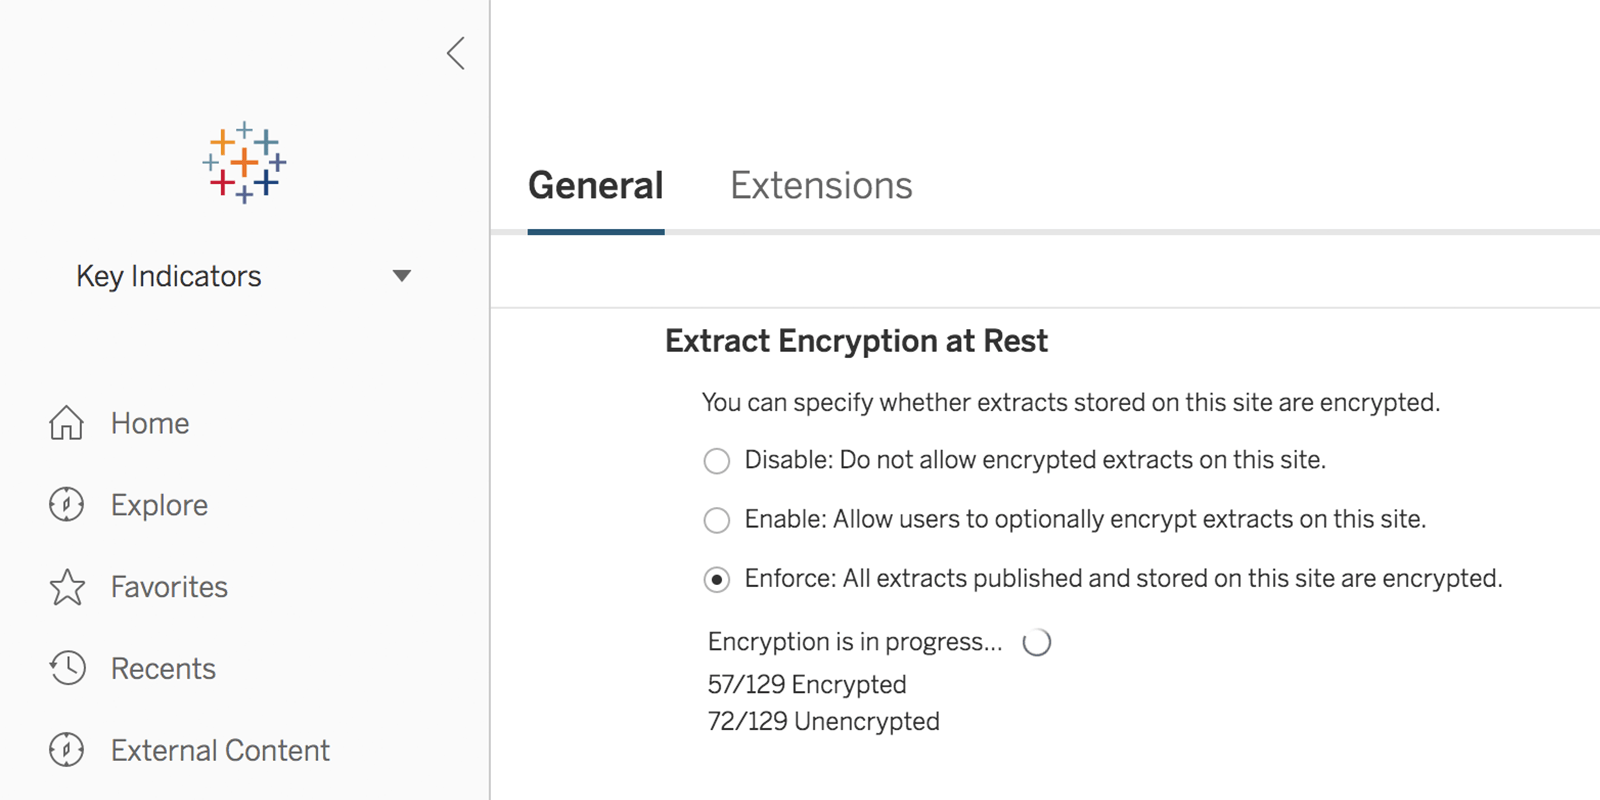
Extract Encryption at Rest for Tableau Server
For additional security you can now encrypt your extracts at rest. You can also think of this as object-level encryption. It’s easy to use—simply toggle it on per extract or enable at the site level. Tableau Online is already fully encrypted at the service level.
Learn more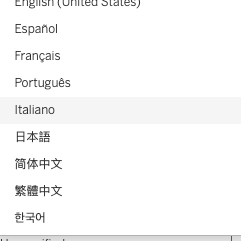
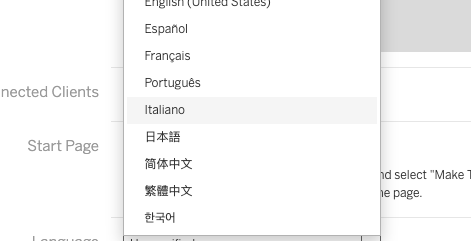
New product language: Italian
Italian is now available as a language option, making Tableau feel more familiar for Italian speakers.
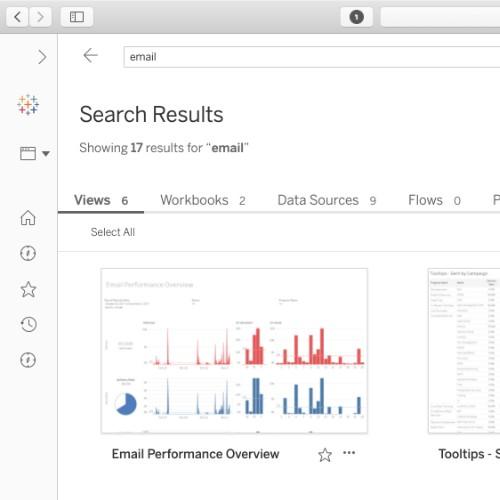
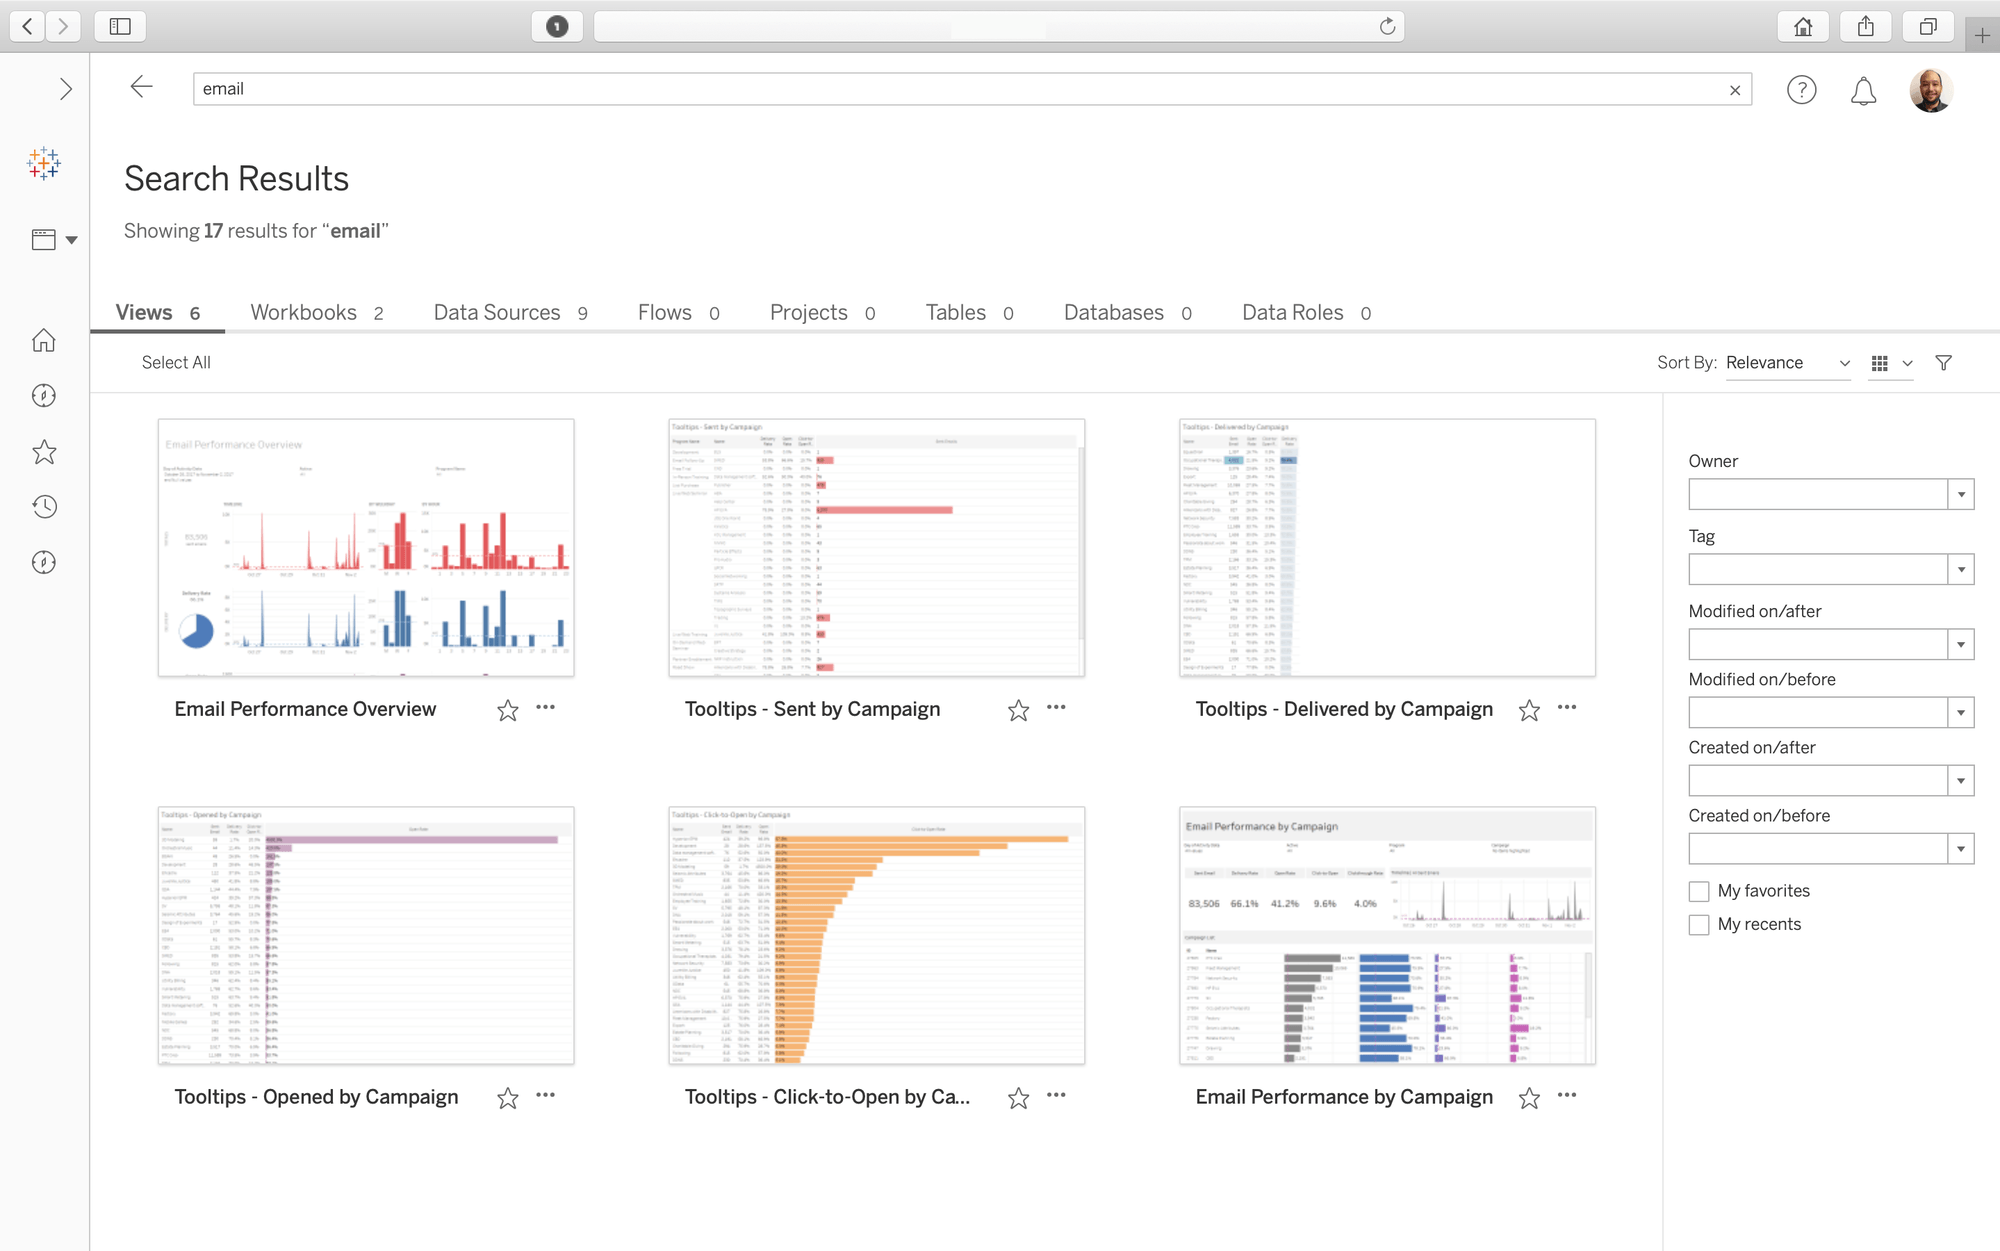
New search results page
Find what you're looking for faster. Now your search results will be laid out on a newly redesigned search results page. See all your results by views, workbooks, data sources, flows, and other content types.
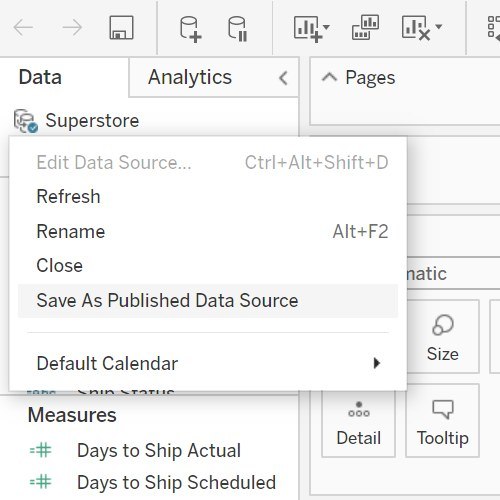
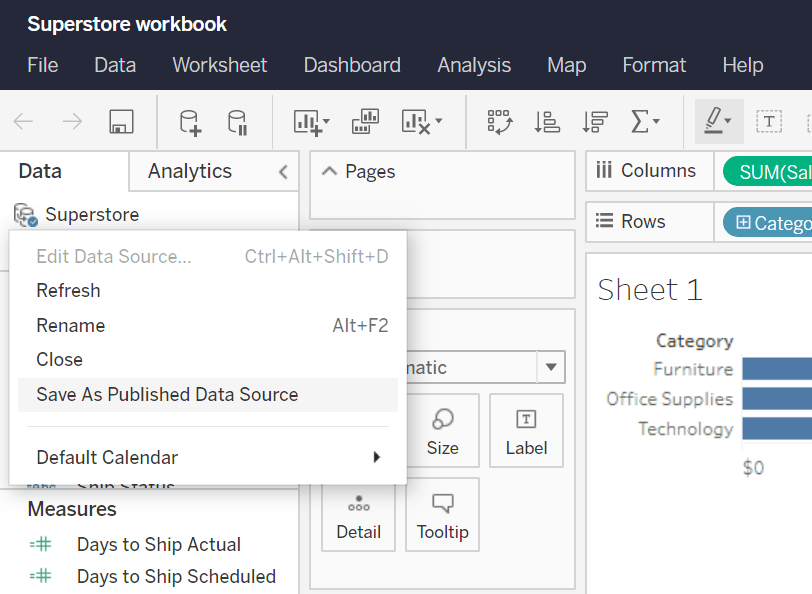
Publish embedded data sources
Quickly and easily publish embedded data sources from workbooks to share with your team.
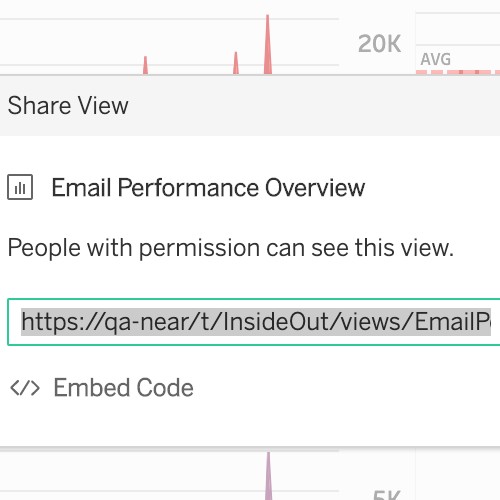
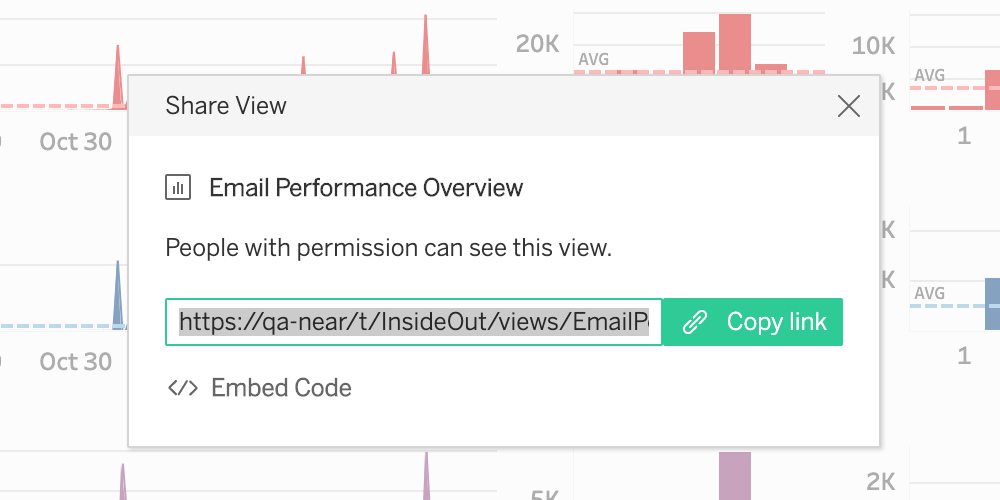
Improved content sharing
Share more easily with a simplified share experience. Share projects, workbooks, data sources, views and flows through Tableau Online and Tableau Server.
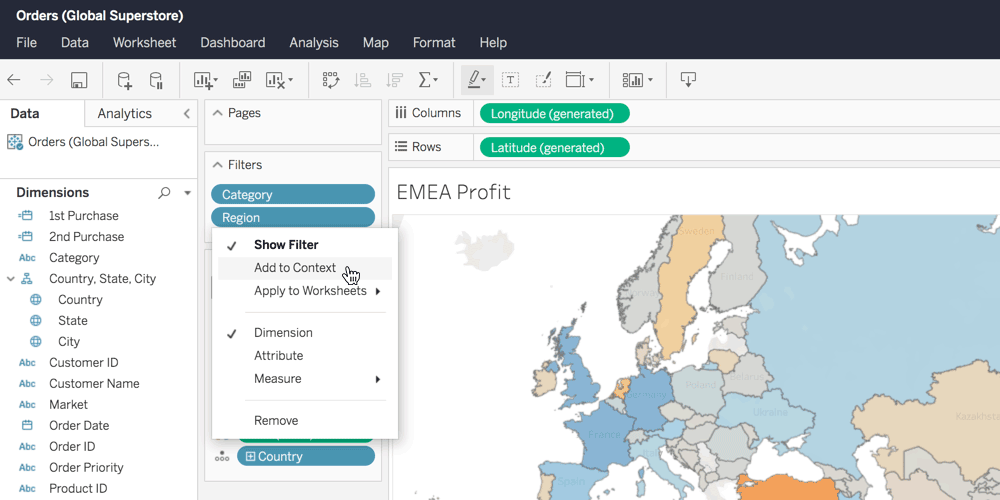
Set context filters on the web
Improvements to web authoring continue with the ability to create context filters and dependent filters in the browser to help drive the performance of your workbook.
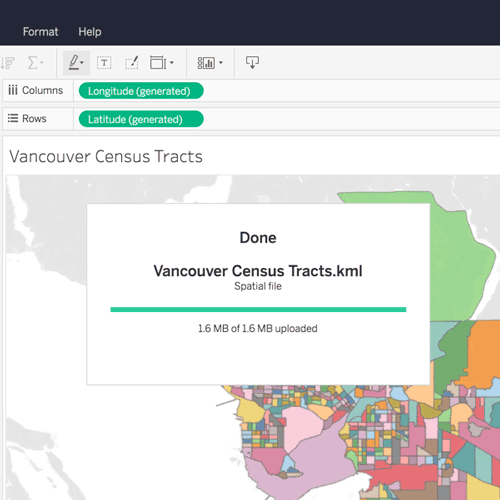
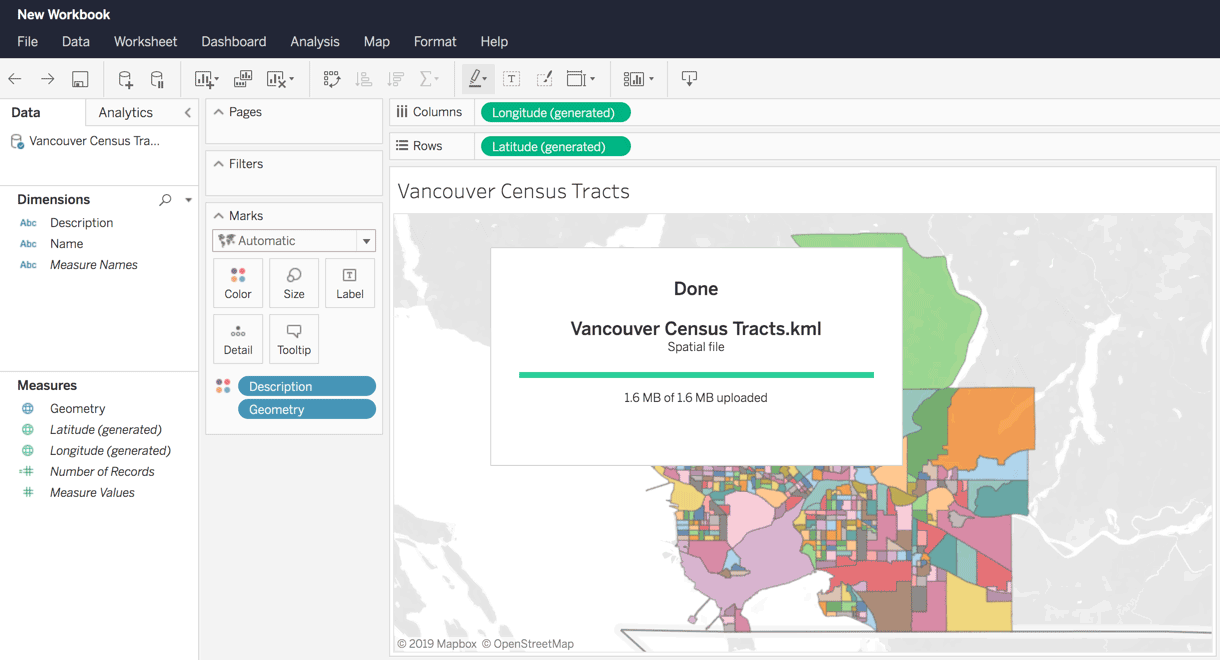
Spatial files for web authoring
Spatial file support has arrived to web authoring. Connect to KML, GeoJSON, TopoJSON, and zipped shapefiles to better understand and share your location analysis on the web. End to end geospatial analysis, all without leaving the browser.
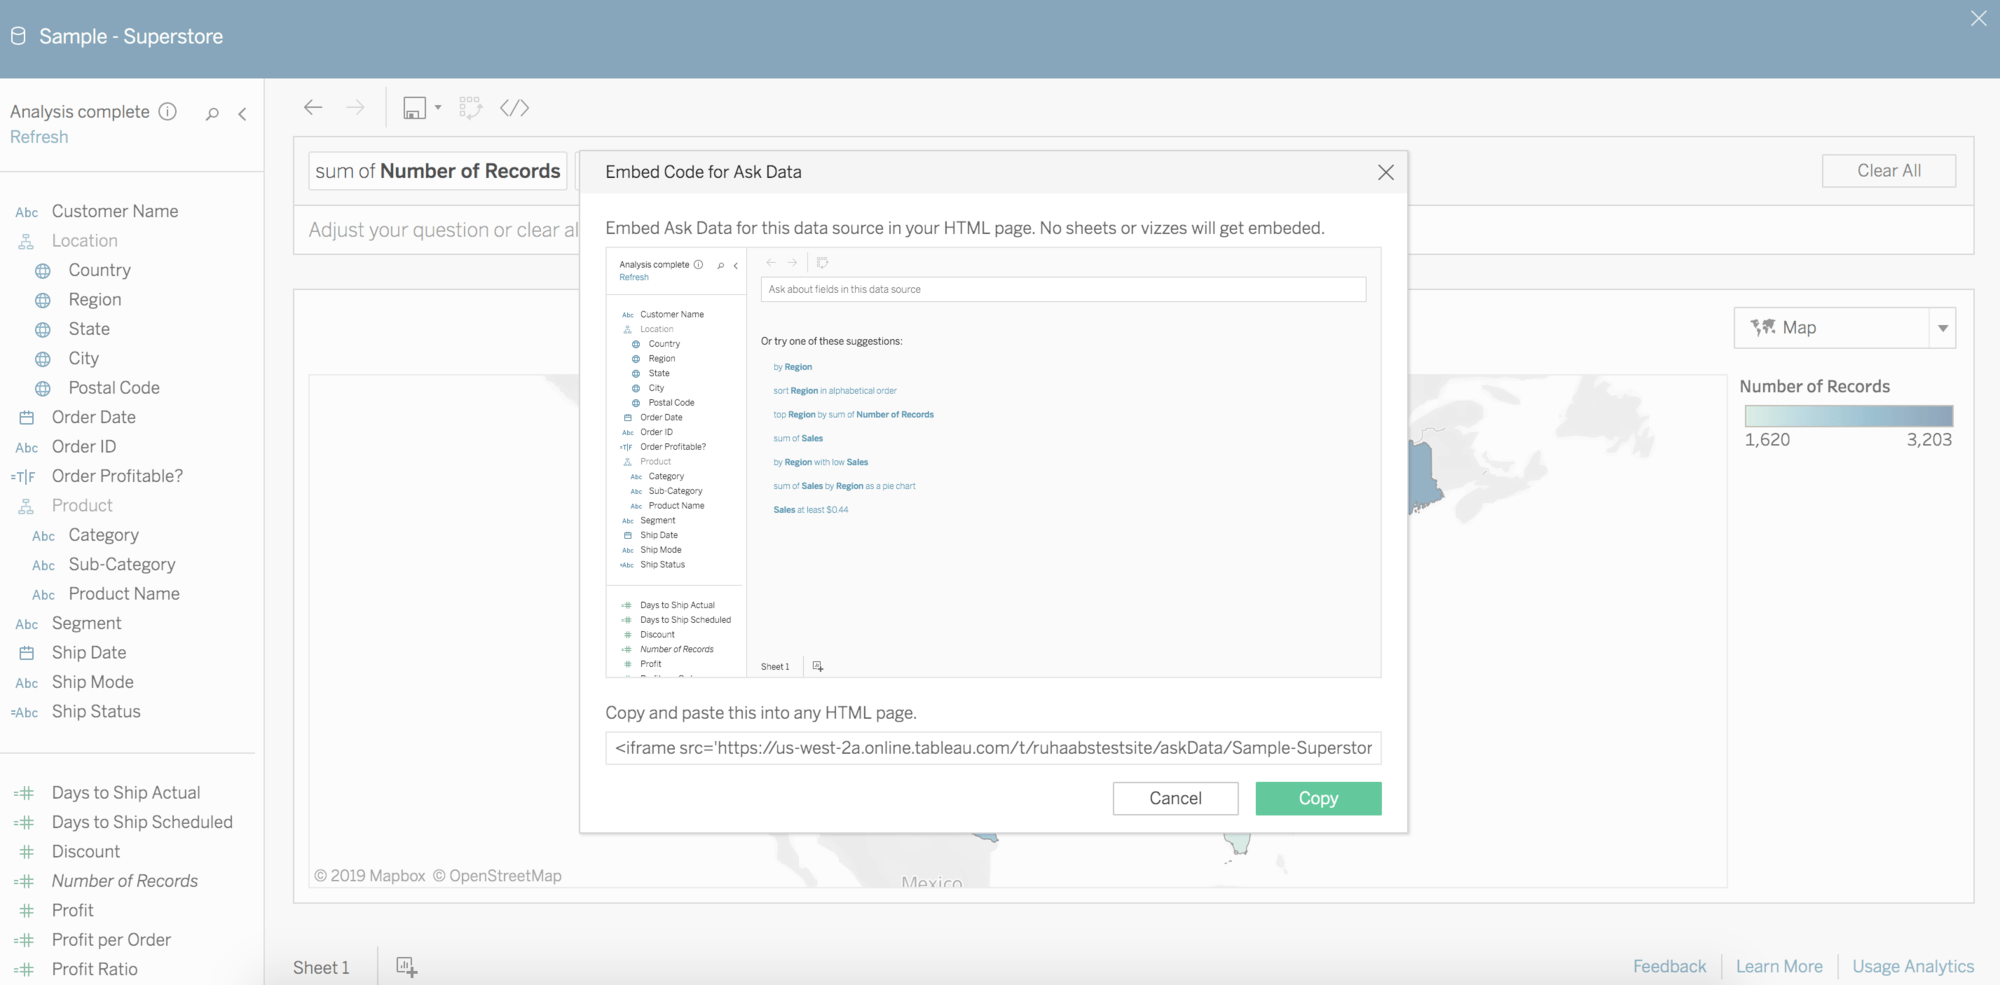
Ask Data improvements
Embed Ask Data into your company portal or Wiki, and you can enable even more people in your organization to be asking questions of their data.

Debian 9.0+ Linux support
Customers running Tableau Server on Linux now have the option to run using the Debian 9.0+ distribution.
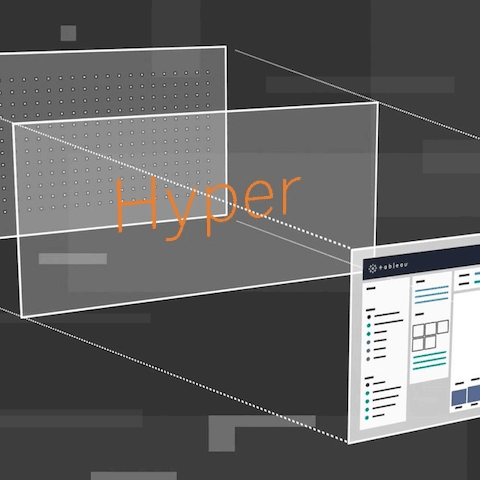
Hyper API
The Hyper API contains a set of functions you can use to automate your interactions with Tableau extract (.hyper) files. You can use the API to create new extract files, or to open existing extract files, and then insert, delete, update, or read data from those files. Learn more about the API or download here.
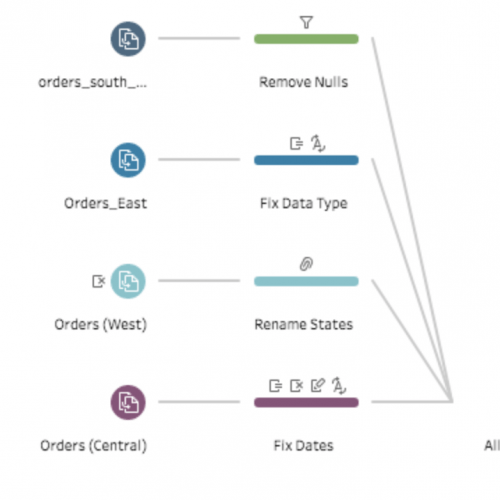
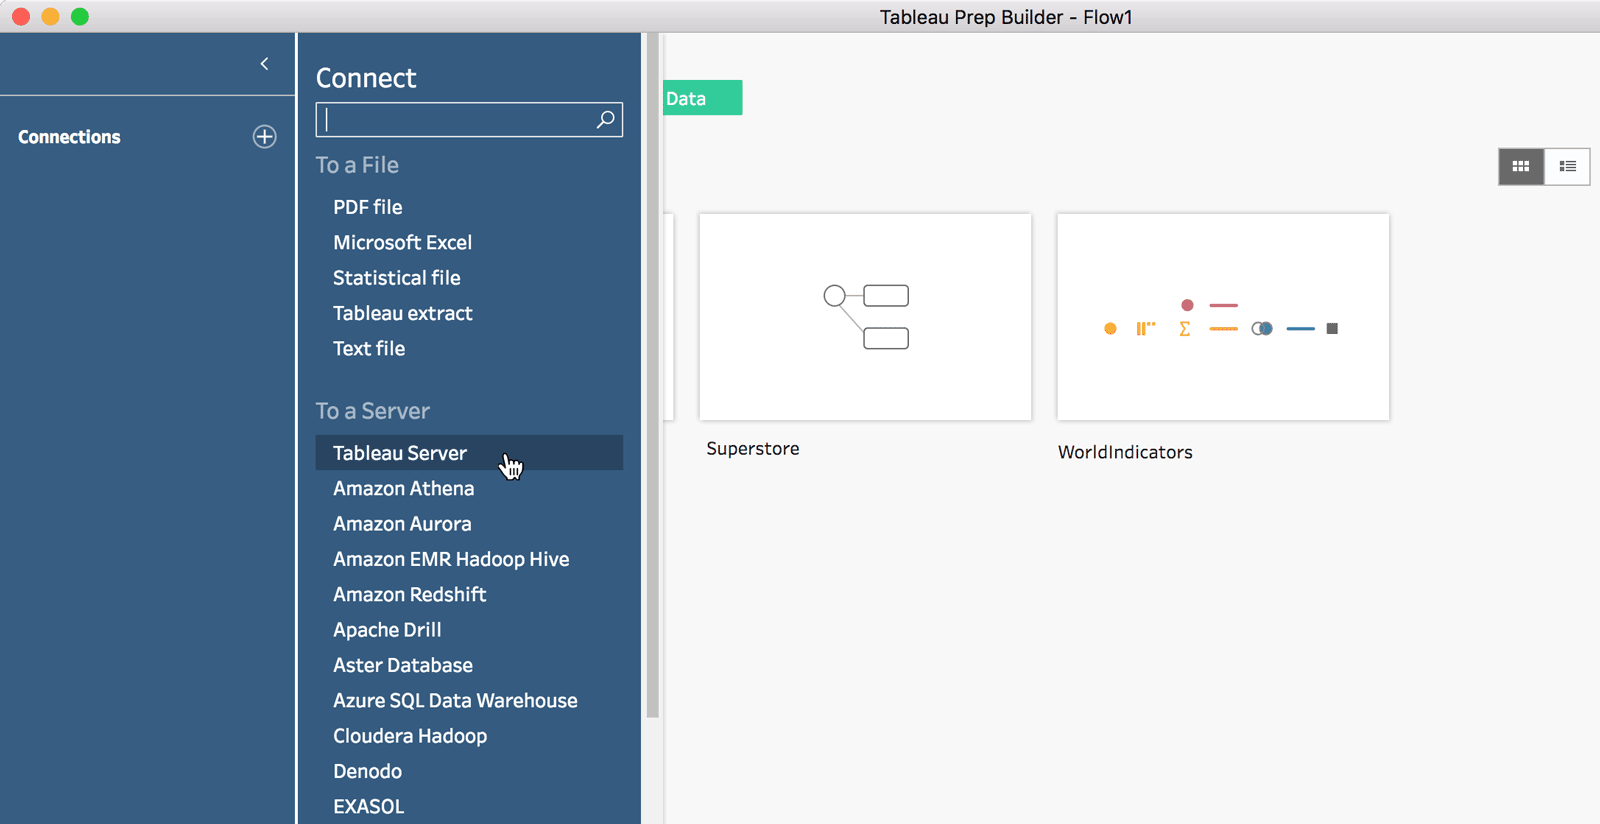
Connect to published data sources with Tableau Prep
Connect to published data sources with Prep Builder and Prep Conductor, so you can build flows with all the data in your Tableau environment.
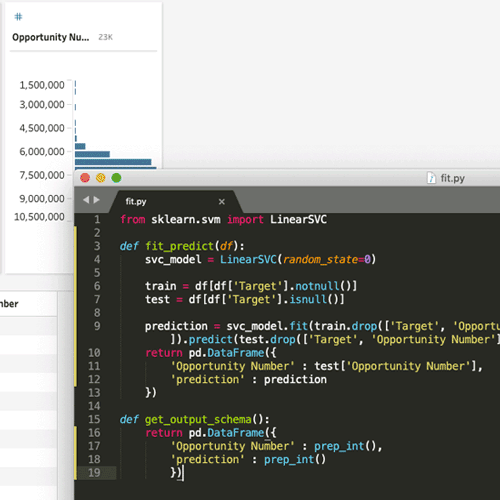
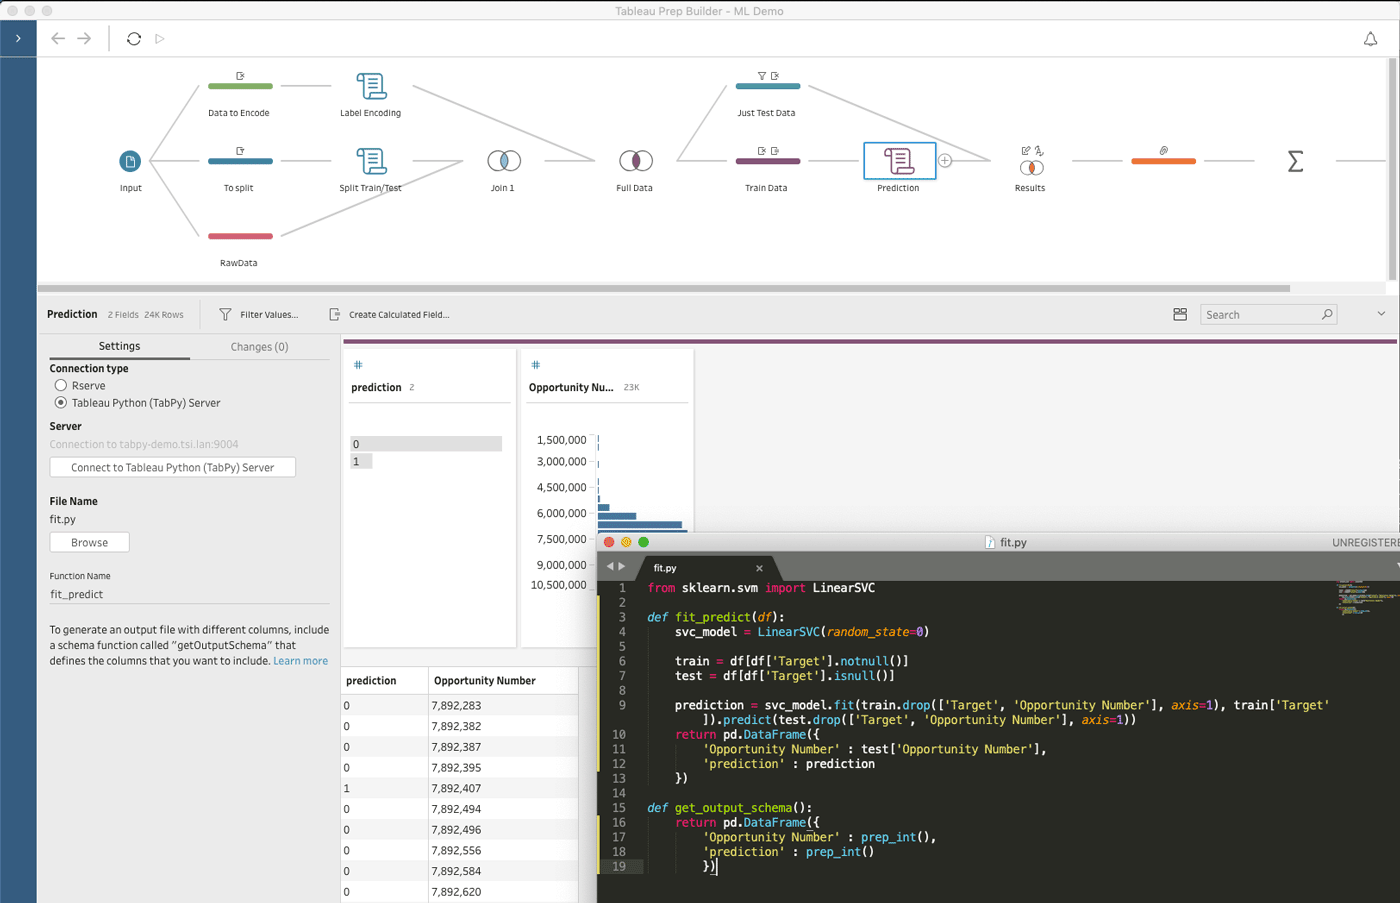
R and Python integration for Prep Builder
Create a step to run an R or Python script in Tableau Prep Builder, taking advantage of your data science workflows.
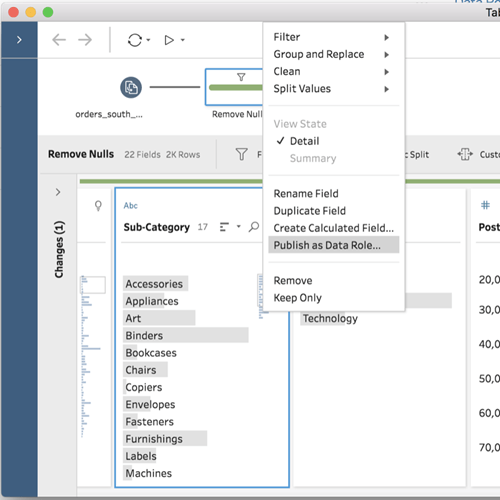
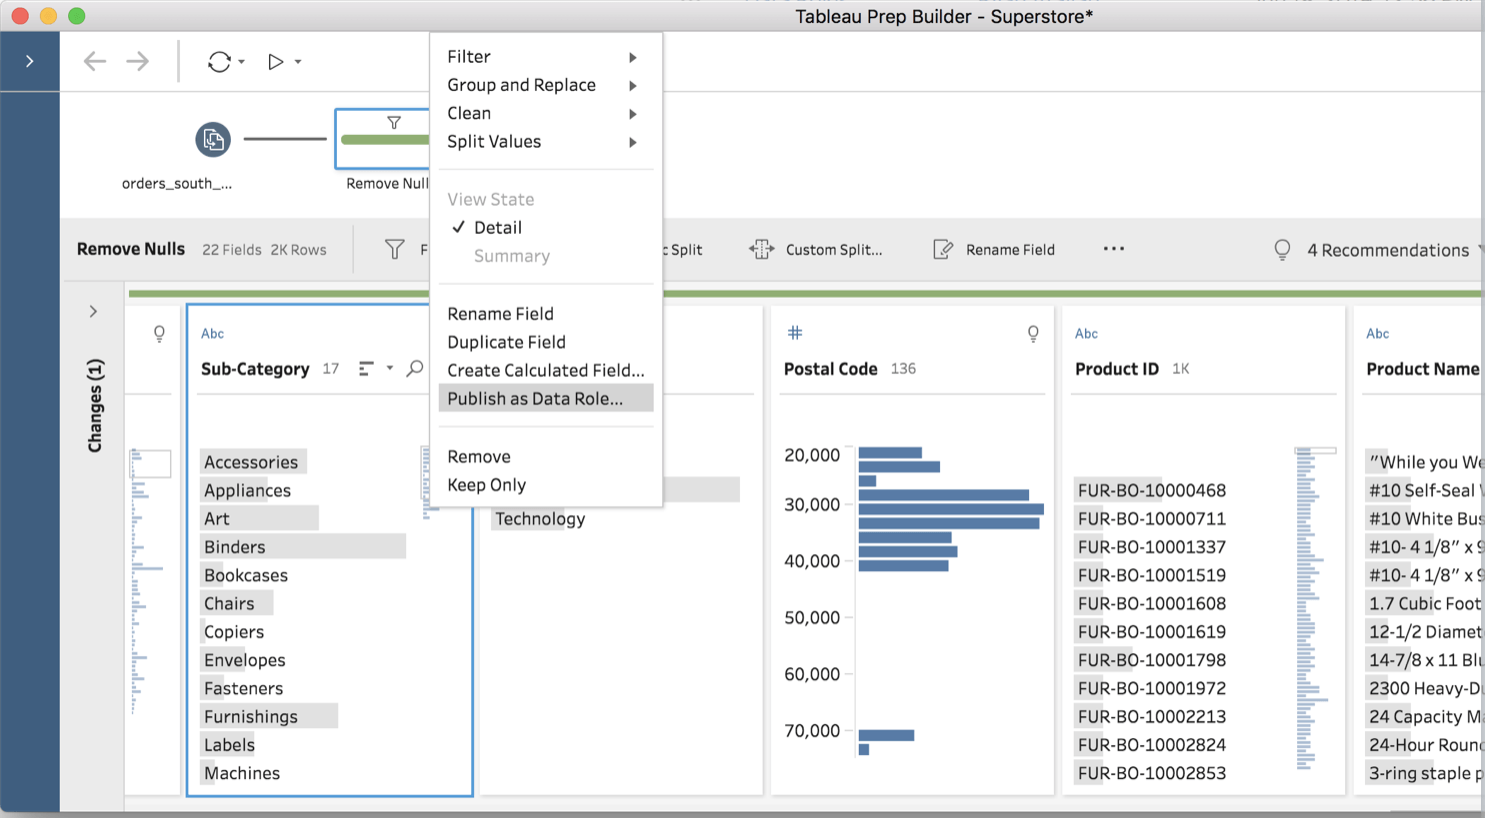
Custom Data Roles in Tableau Prep
Create your own Data Roles to get automatic data validation, and share them in Tableau Server so others can easily standardize their data too.

Google BigQuery Connector in Tableau Prep
Now you can do all your data preparation for Google BigQuery in Tableau Prep with this new connector.