
Tableau 2021.4
Connected Apps, Virtual Connections, and Improved Slack Integrations
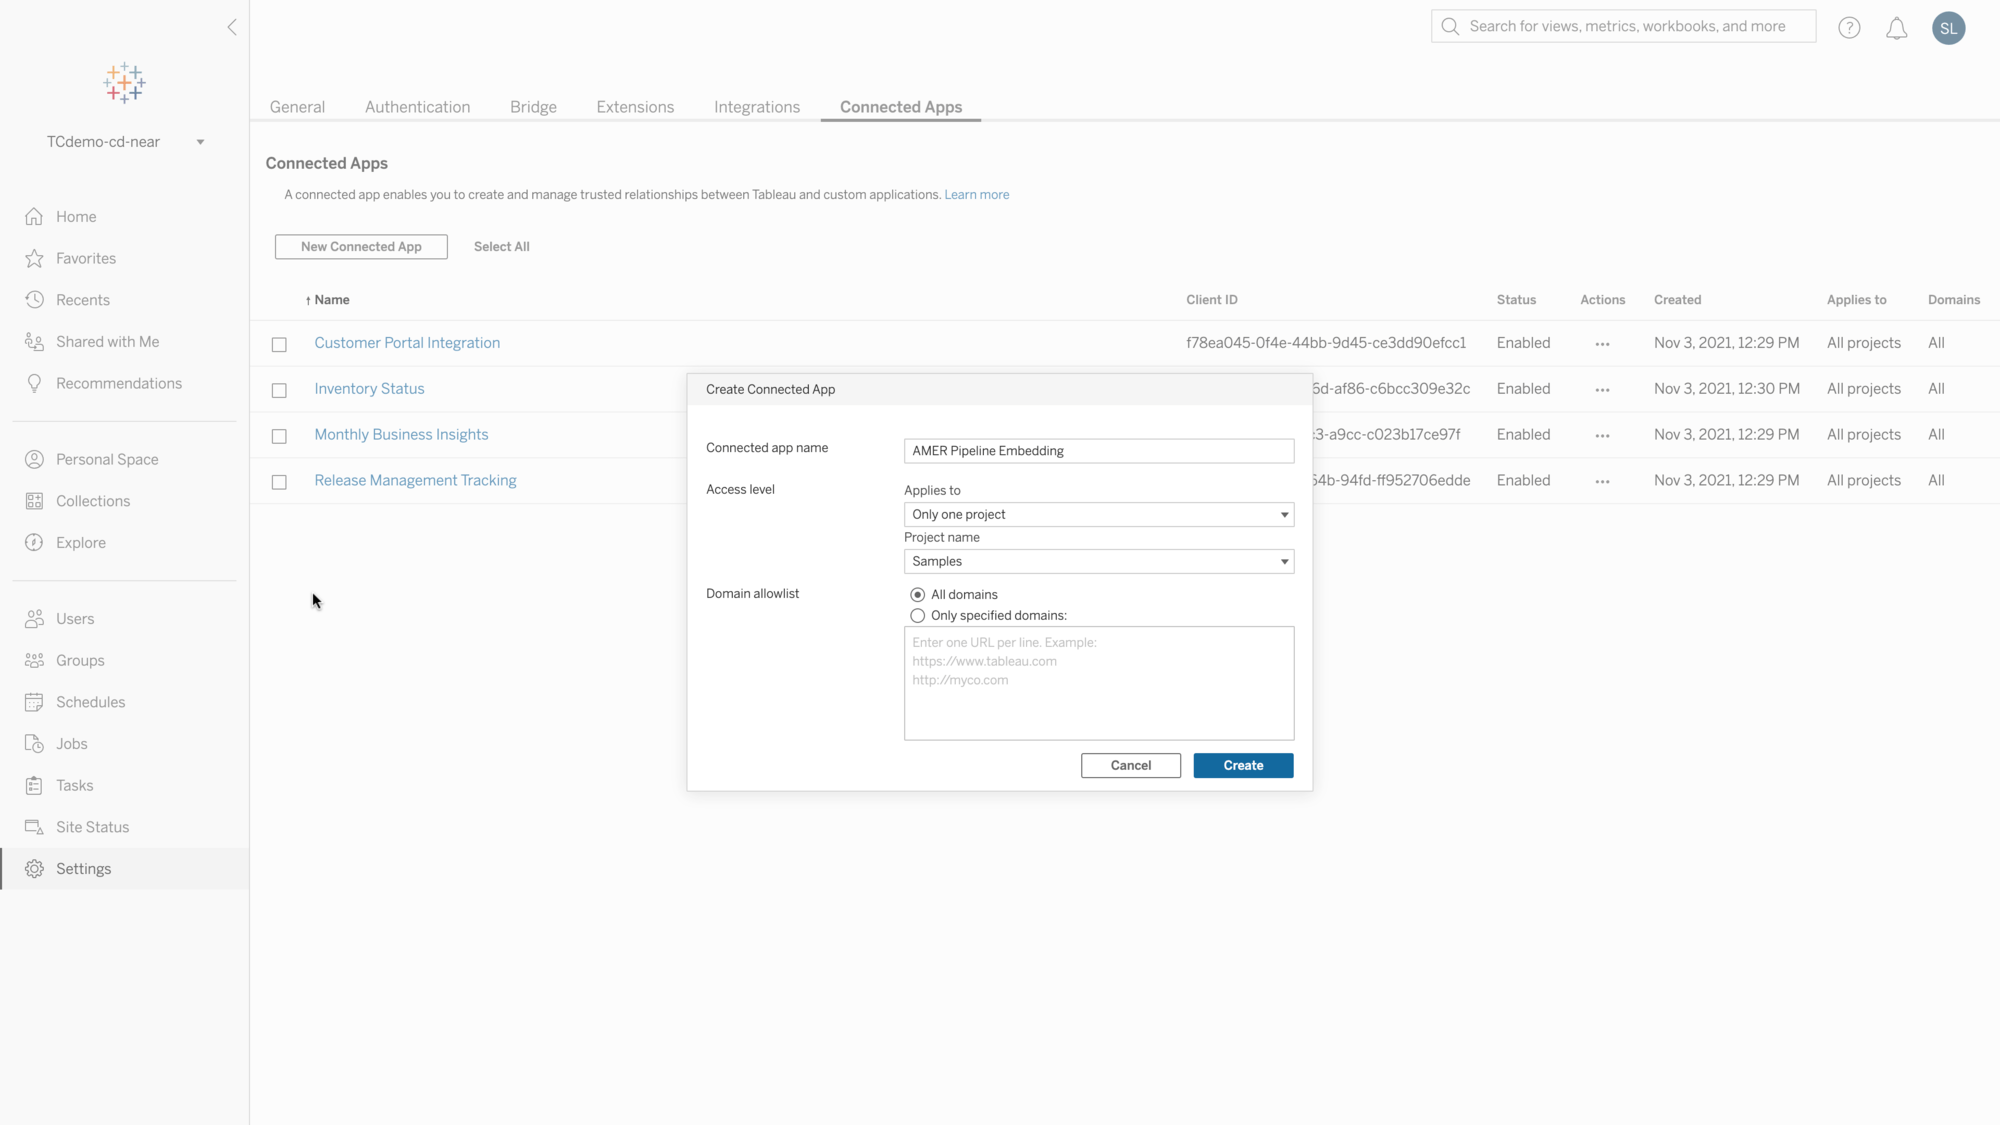
Connected Apps
Enjoy a flexible way to integrate Tableau into your existing technology infrastructure. Connected Apps creates a seamless and secure end-user experience with simple and trusted relationships between your applications and Tableau.
IT leaders are facing unprecedented challenges today. It’s no longer a luxury for businesses to have a data analytics platform, it’s a necessity that could make the difference between surviving and thriving.

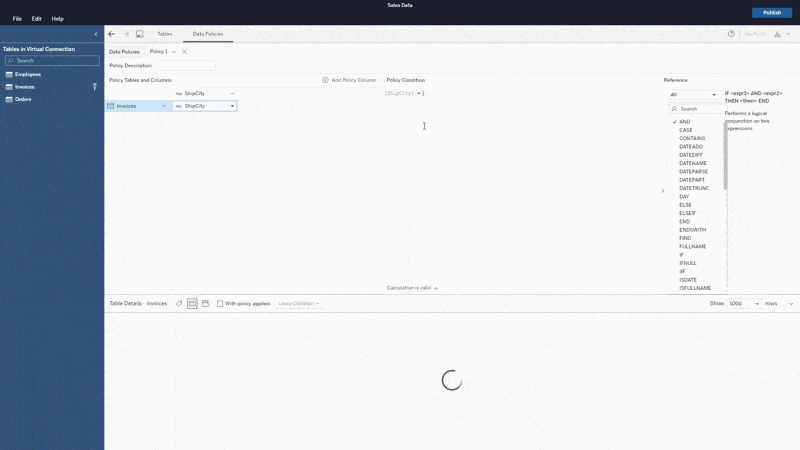
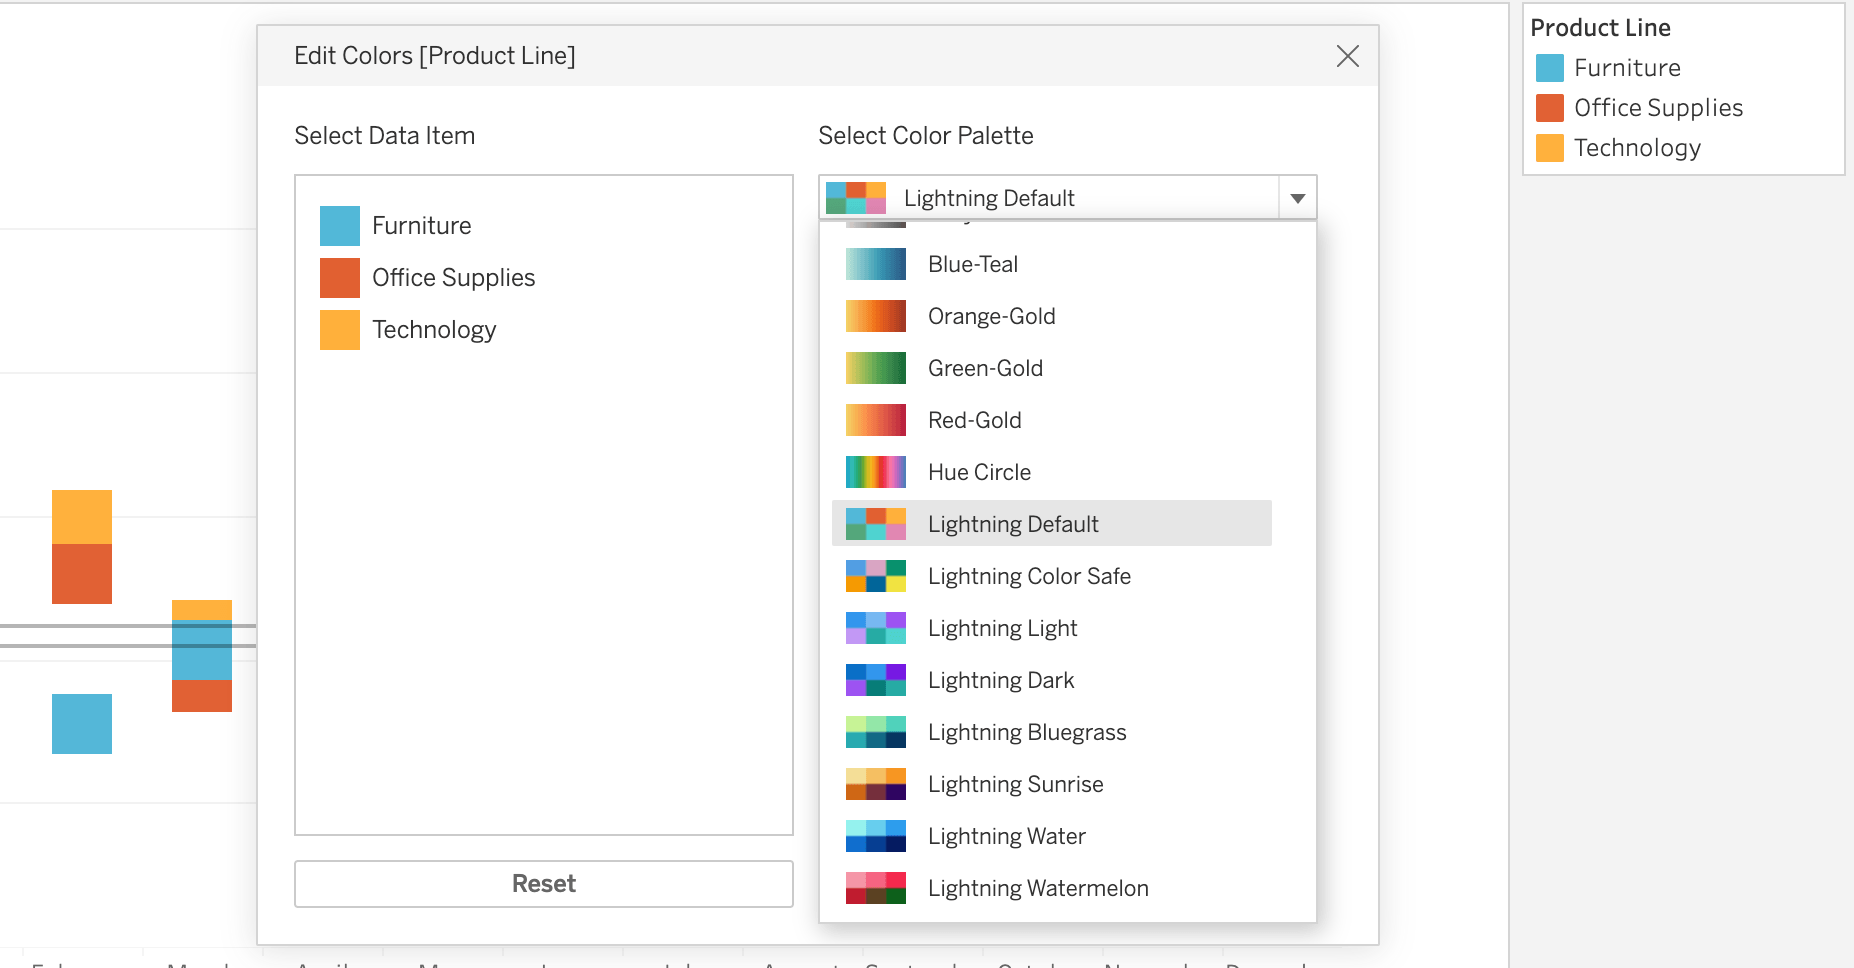
Virtual Connections
Virtual connections are a new content type in Tableau Server and Tableau Online that are used to create and share access to tables, securely embed service account credentials, define Data Policies, and extract data centrally.
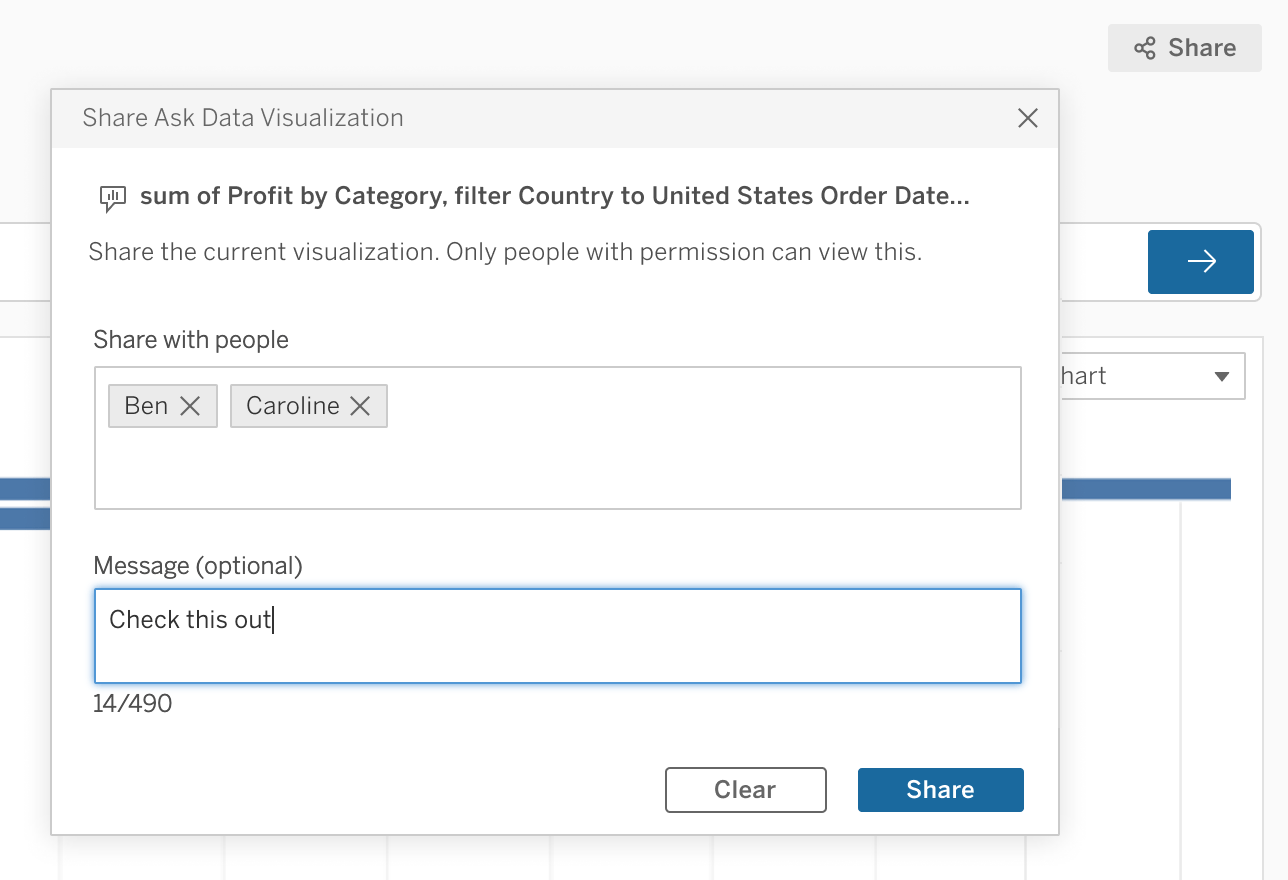
Ask Data and Slack integration
Broaden the reach of analytics across your business with deeper integration with Slack and Ask Data. You can now share a viz generated in Ask Data in Tableau directly to Slack, making it even easier to share insights with your teammates.
Learn more
Tableau 2021.4 Feature Overview
Tune in for an overview to hear about the latest features from Tableau Zen Ambassador, Tim Ngwena. He will walk you through the new features included in this release.
Watch nowExplore latest features and Tableau Accelerators
All Features
2021.4
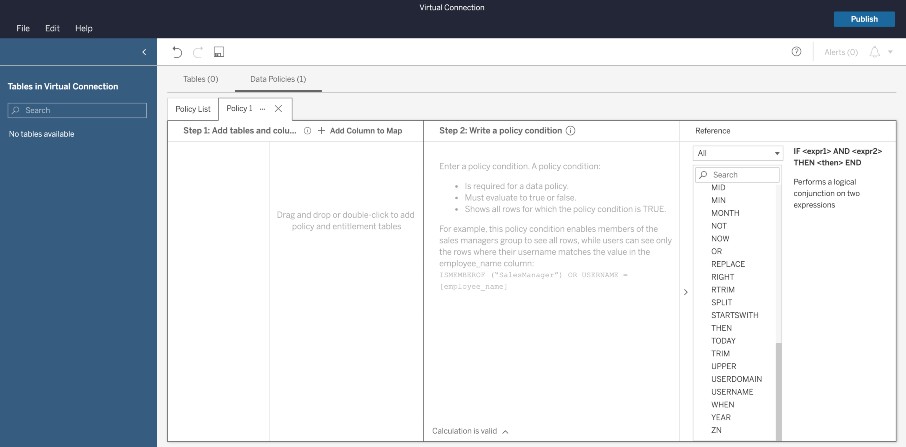
Virtual Connections
Virtual connections are a new content type in Tableau Server and Tableau Online that are used to create and share access to tables, securely embed service account credentials, define Data Policies, and extract data centrally.
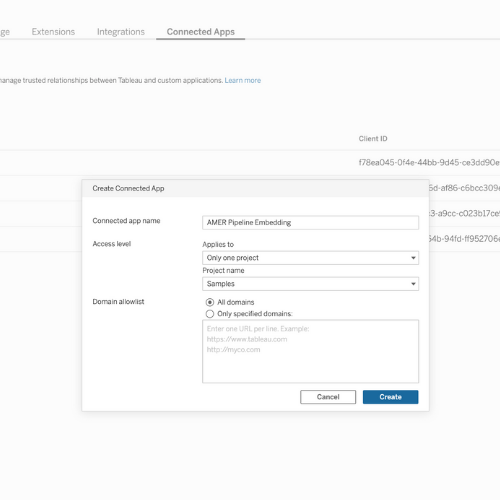
Connected Apps
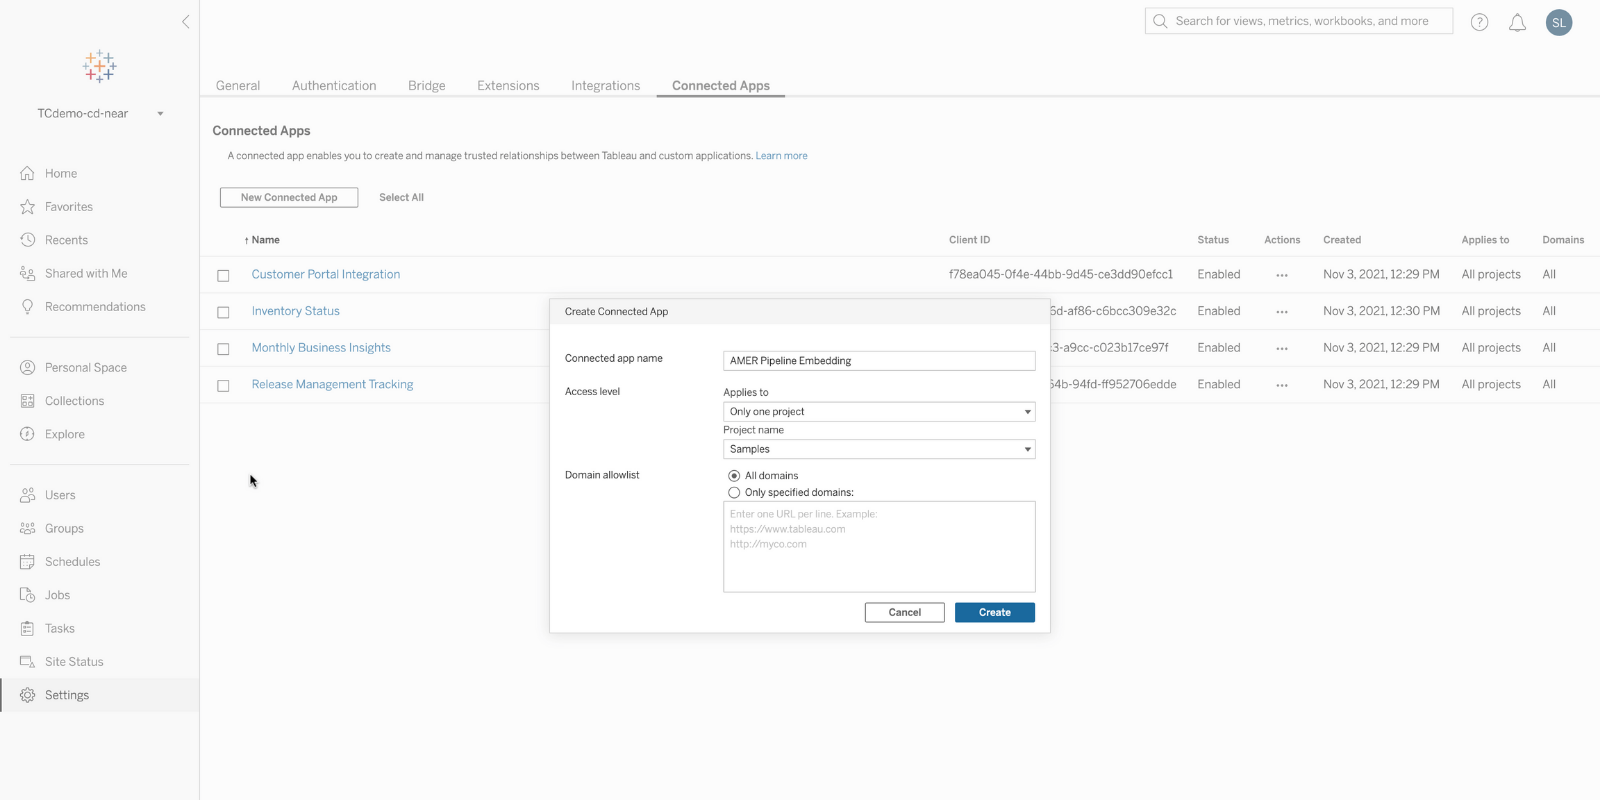
Enjoy a flexible way to integrate Tableau into your broader technology stack. Connected Apps create seamless and secure experiences with simple and trusted relationships between your applications and Tableau using modern, secure, easy-to-use authentication services.
With Connected Apps, Tableau admins have better control over security. You can set up a trusted relationship between Tableau and any external third-party application servers that use standards to embed a Tableau visualization without requiring users to log in to Tableau. Additionally, you can control user access to embedded content and restrict what content can be embedded.
Ask Data and Slack integration
21.4 brings improved Slack integration to further broaden the reach of analytics across your business. You can now share a viz generated in Ask Data in Tableau directly to Slack, making it even easier to share insights with your team mates.
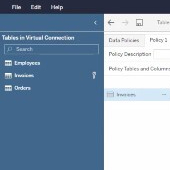
Centralized Row-Level Security
Centrally define and manage row-level security among Data Tables and have it consistently applied across all connected Tableau Flows, Data Sources, or Workbooks that depend on that data.
Edit published data sources
Managing data sources on the web just got easier. Say goodbye to downloading published data sources to Desktop to make your changes. You can now edit published data sources directly in Tableau Server and Tableau Online, test your changes, and publish—all without leaving the browser.
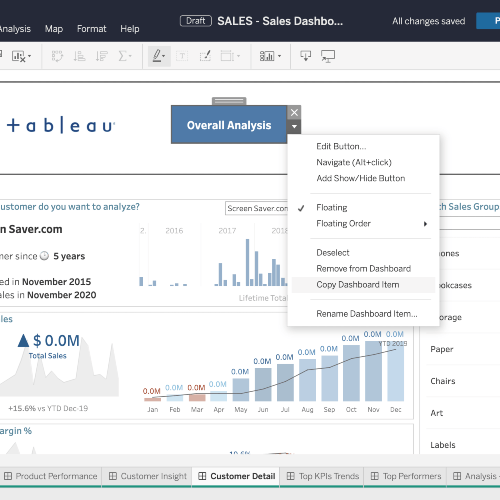
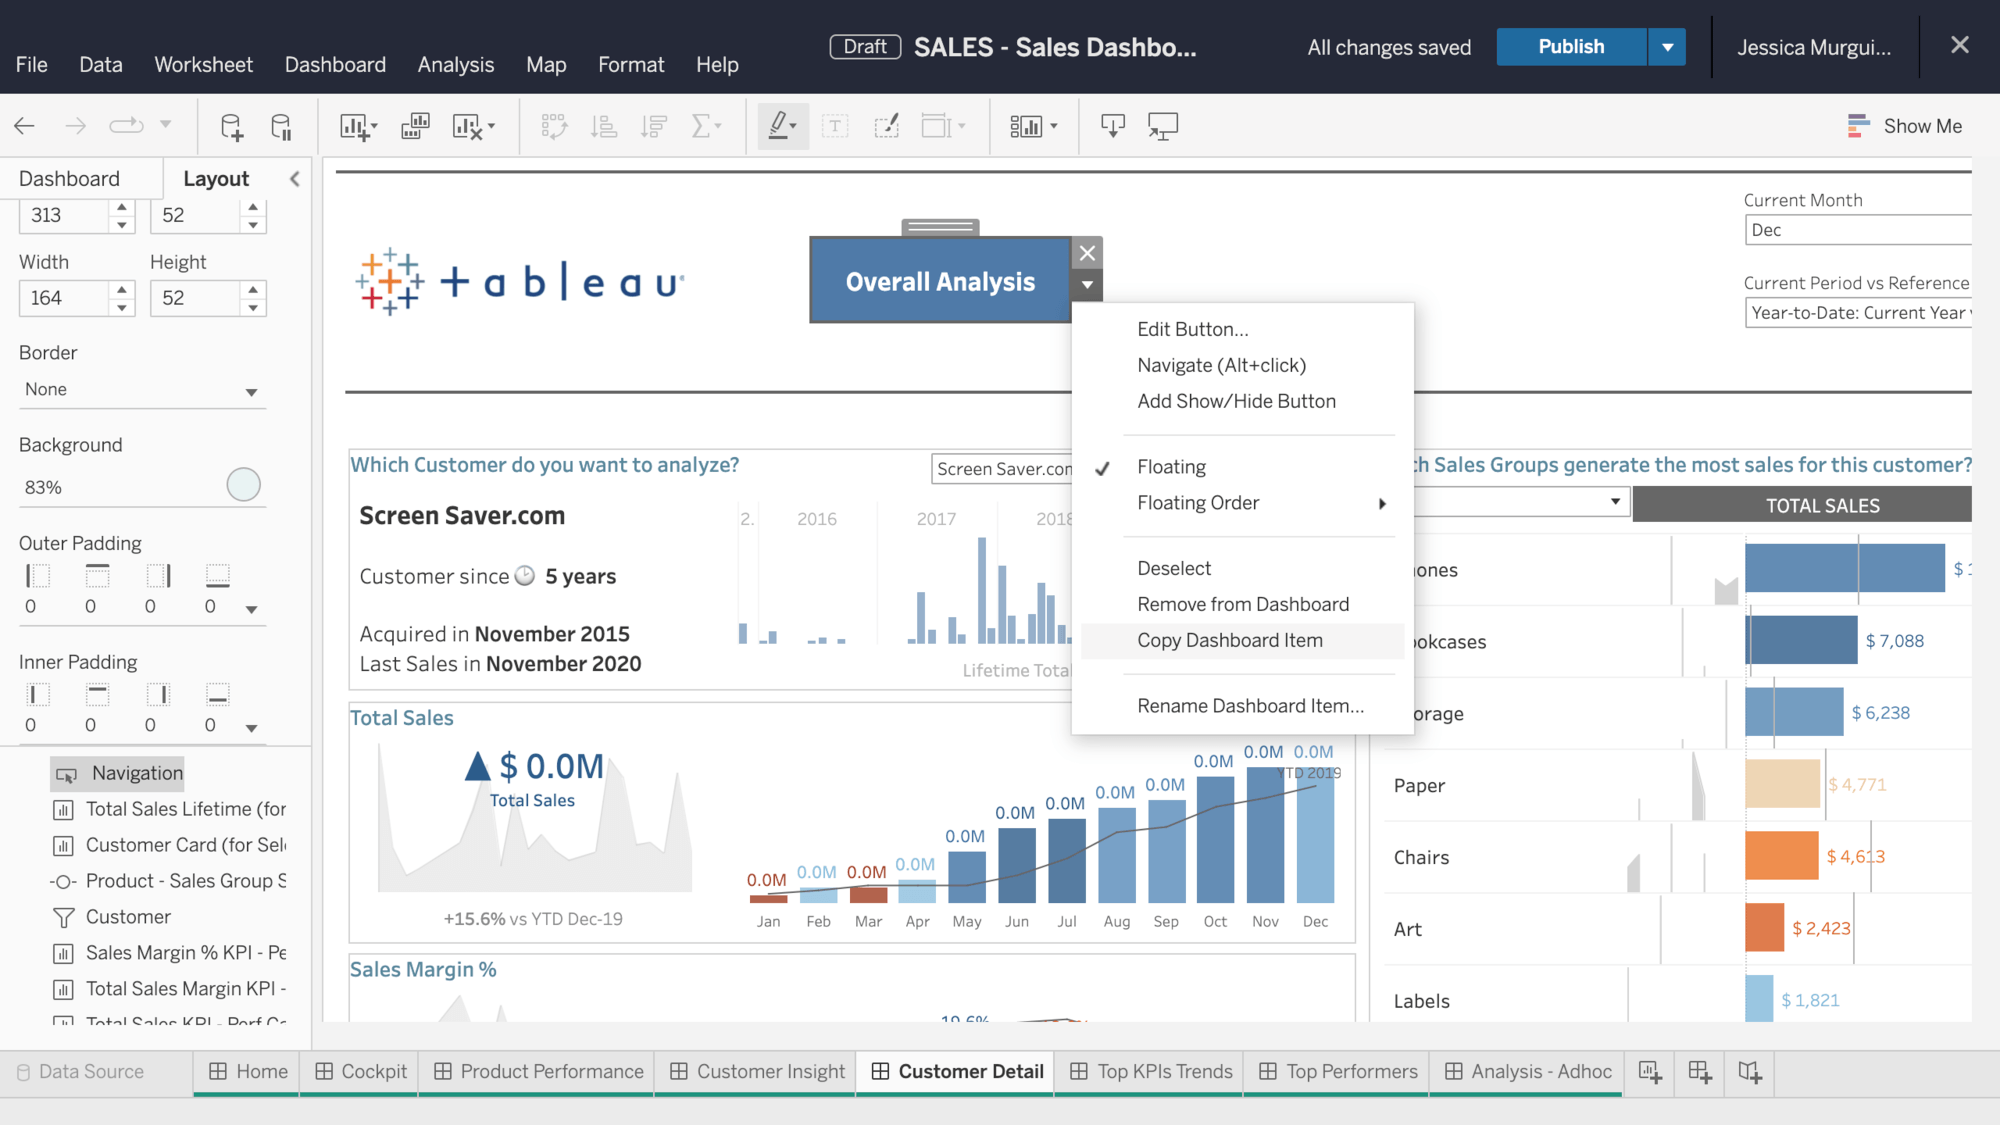
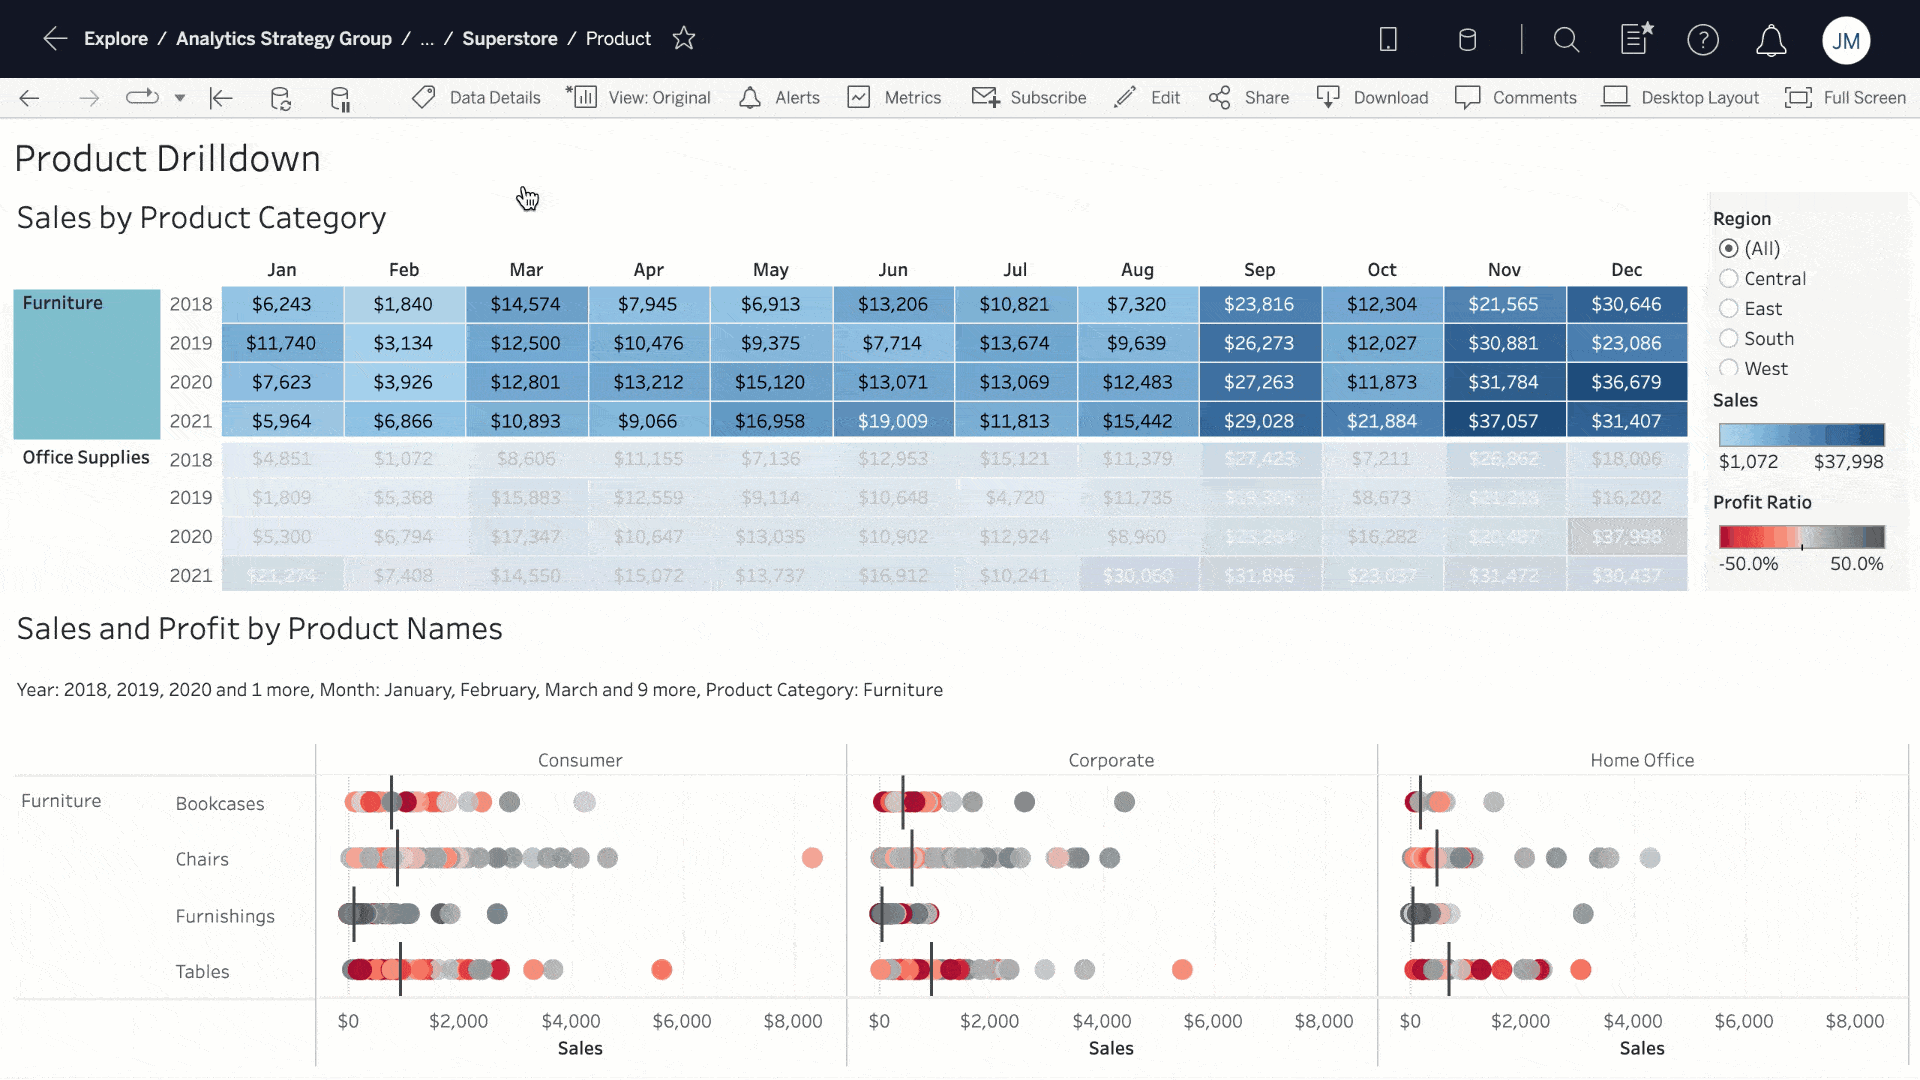
Copy and paste in dashboards
Easily copy and duplicate images, text boxes, and web page containers within the same and across different dashboards and workbooks in Tableau Online, Tableau Server, and Tableau Desktop. This new functionality allows you to build beautiful customized dashboards faster by maintaining and replicating the format, size, and details of already formatted items.

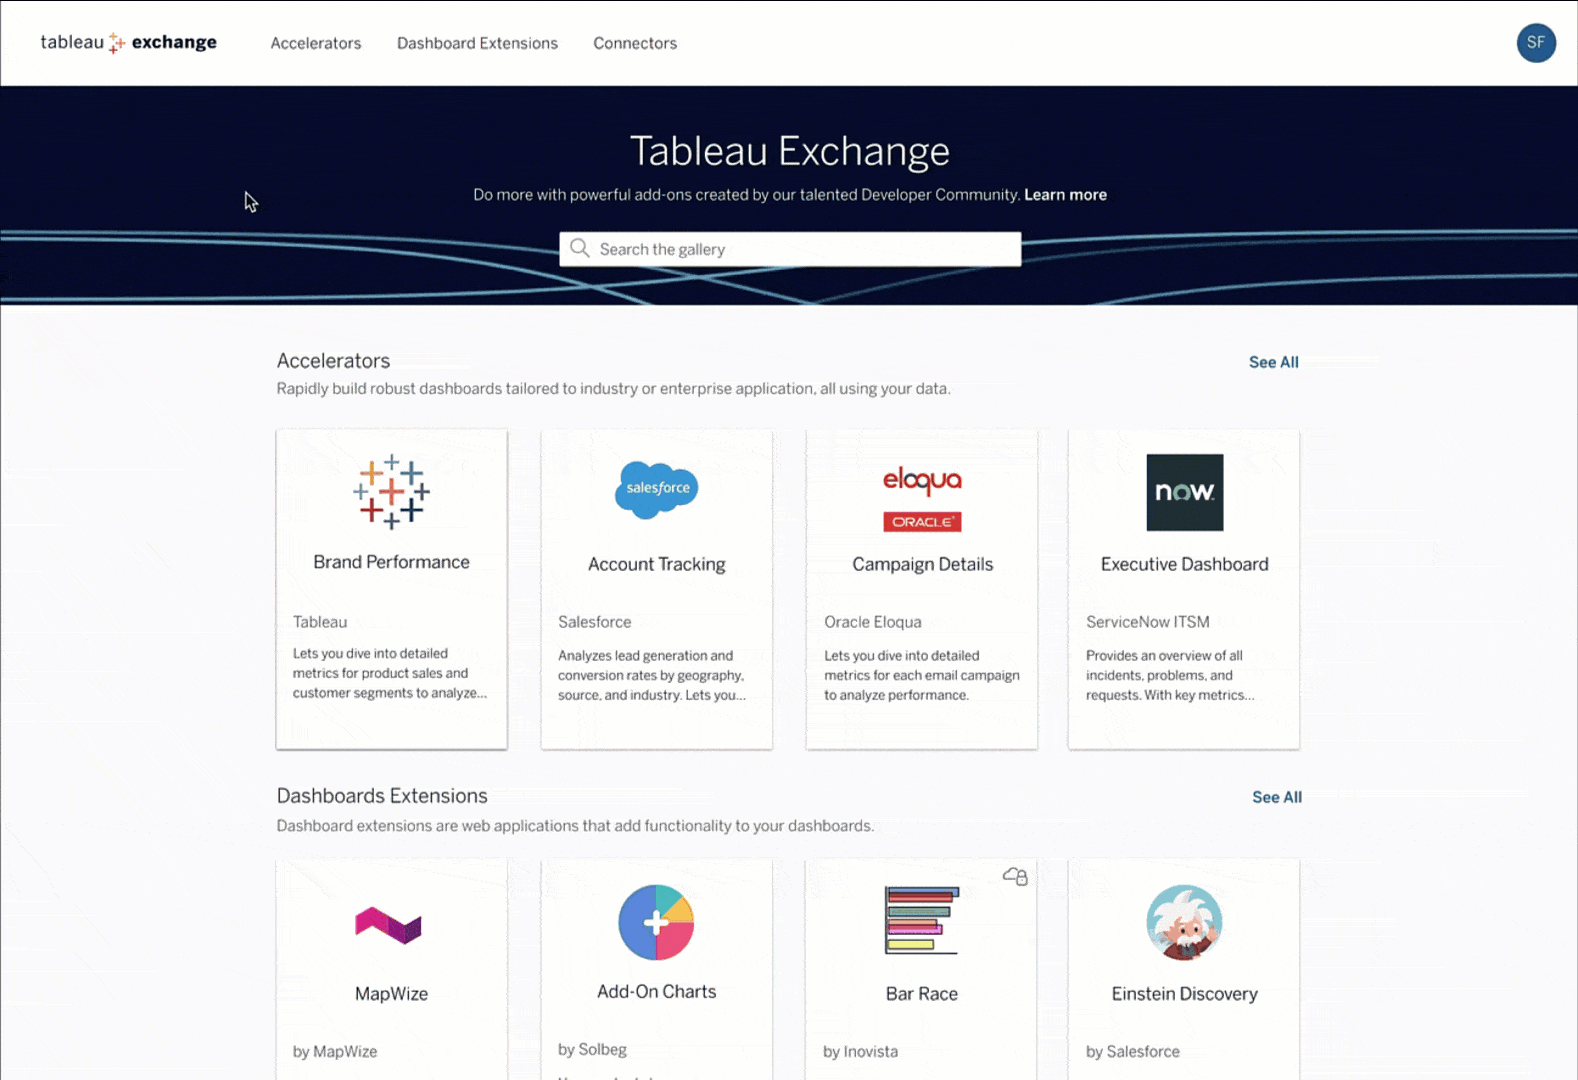
Tableau Exchange
The Tableau Extension Gallery that you know and love is now the Tableau Exchange! The Tableau Exchange is your one-stop-shop for offerings that can help you get a jump start on your data analysis.

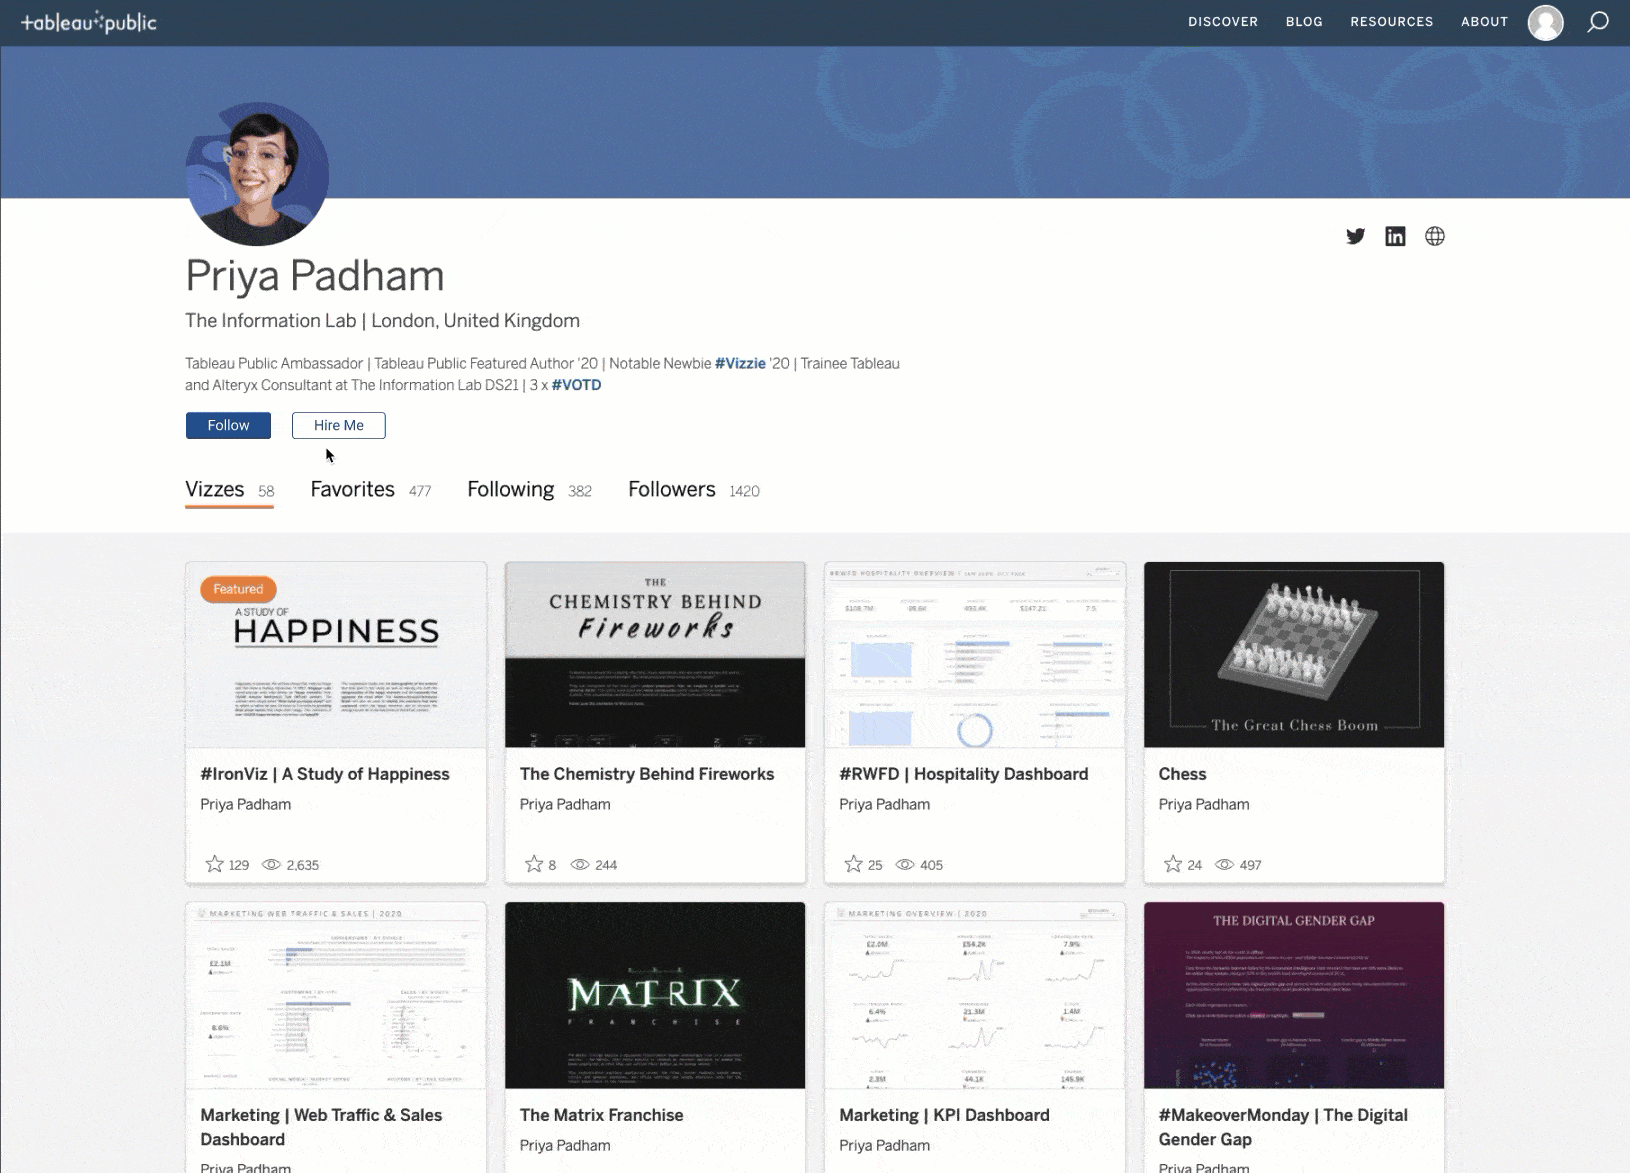
Hire Me button
Tableau Public has become the gathering point for many of the best respected, most influential, and most creative members of the data community. This means that the visualizations found in Tableau Public also include the highest tier of creativity and quality. With the new Hire Me button, we are more enabling authors to indicate that they are available for work and customers to see which authors are available to hire.
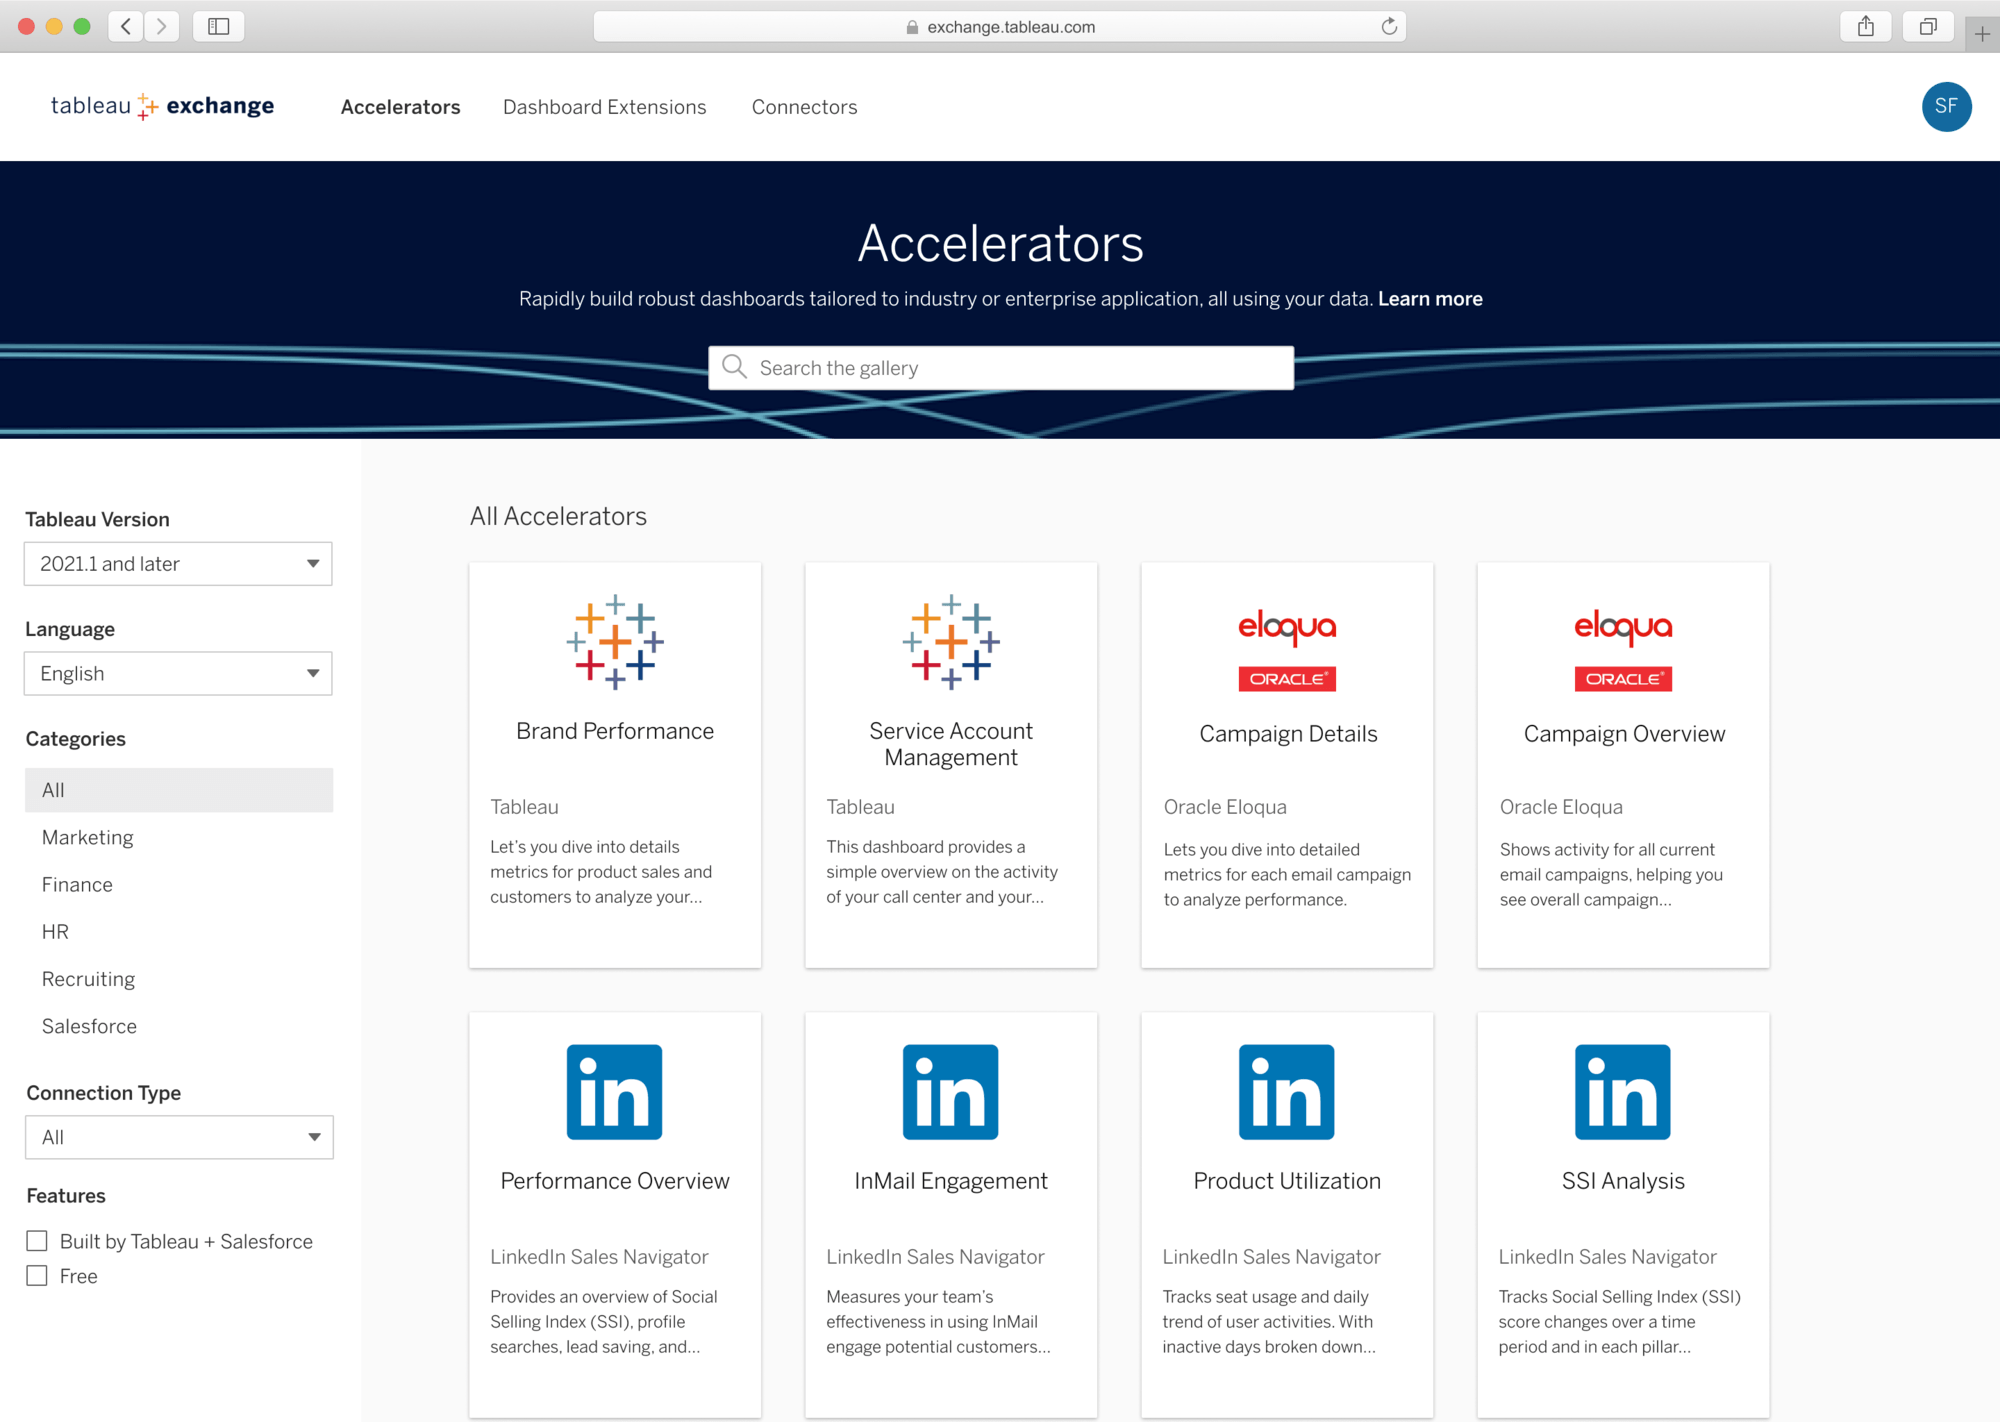
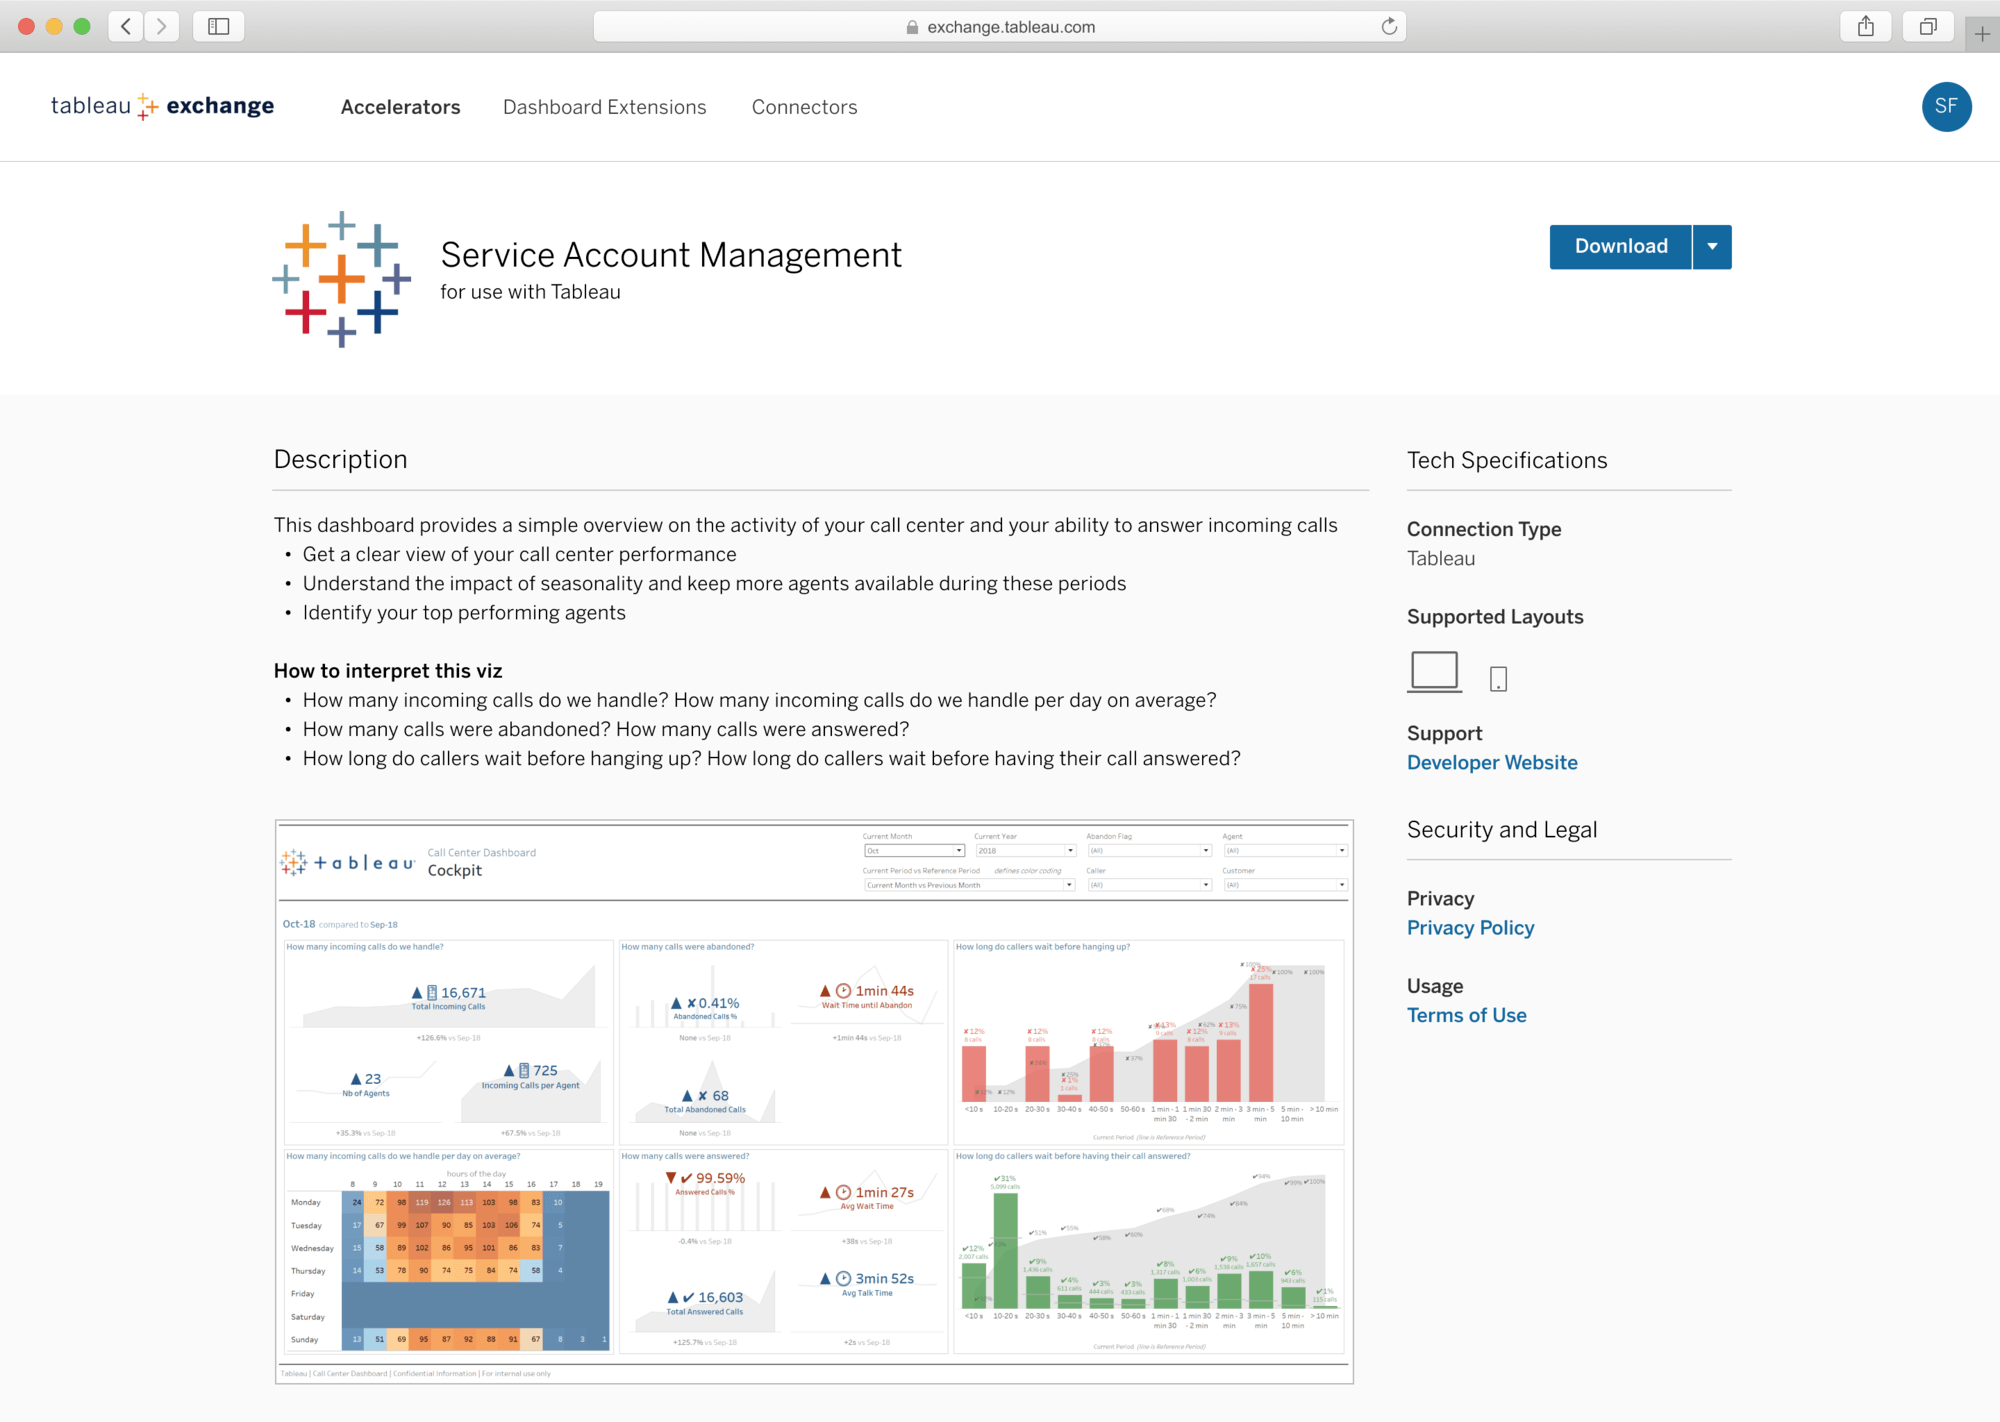
Tableau Accelerators
Accelerators help speed time to value with pre-made, expert-built content that broadly spans industries, lines of business and enterprise applications. They offer a way for our customers to achieve faster time to value and jumpstart their analyses with best-in-class tools.
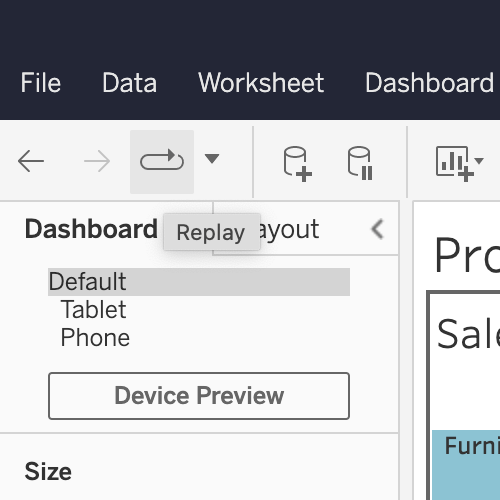
Replay animations
You can now replay data visualizations with animations with a click of a button to see data trends and changes faster. Pairing a data visualization with animation provides repeated exposure to your data, which helps you interpret data, make comparisons among values, focus attention, and spot patterns in your data quickly.
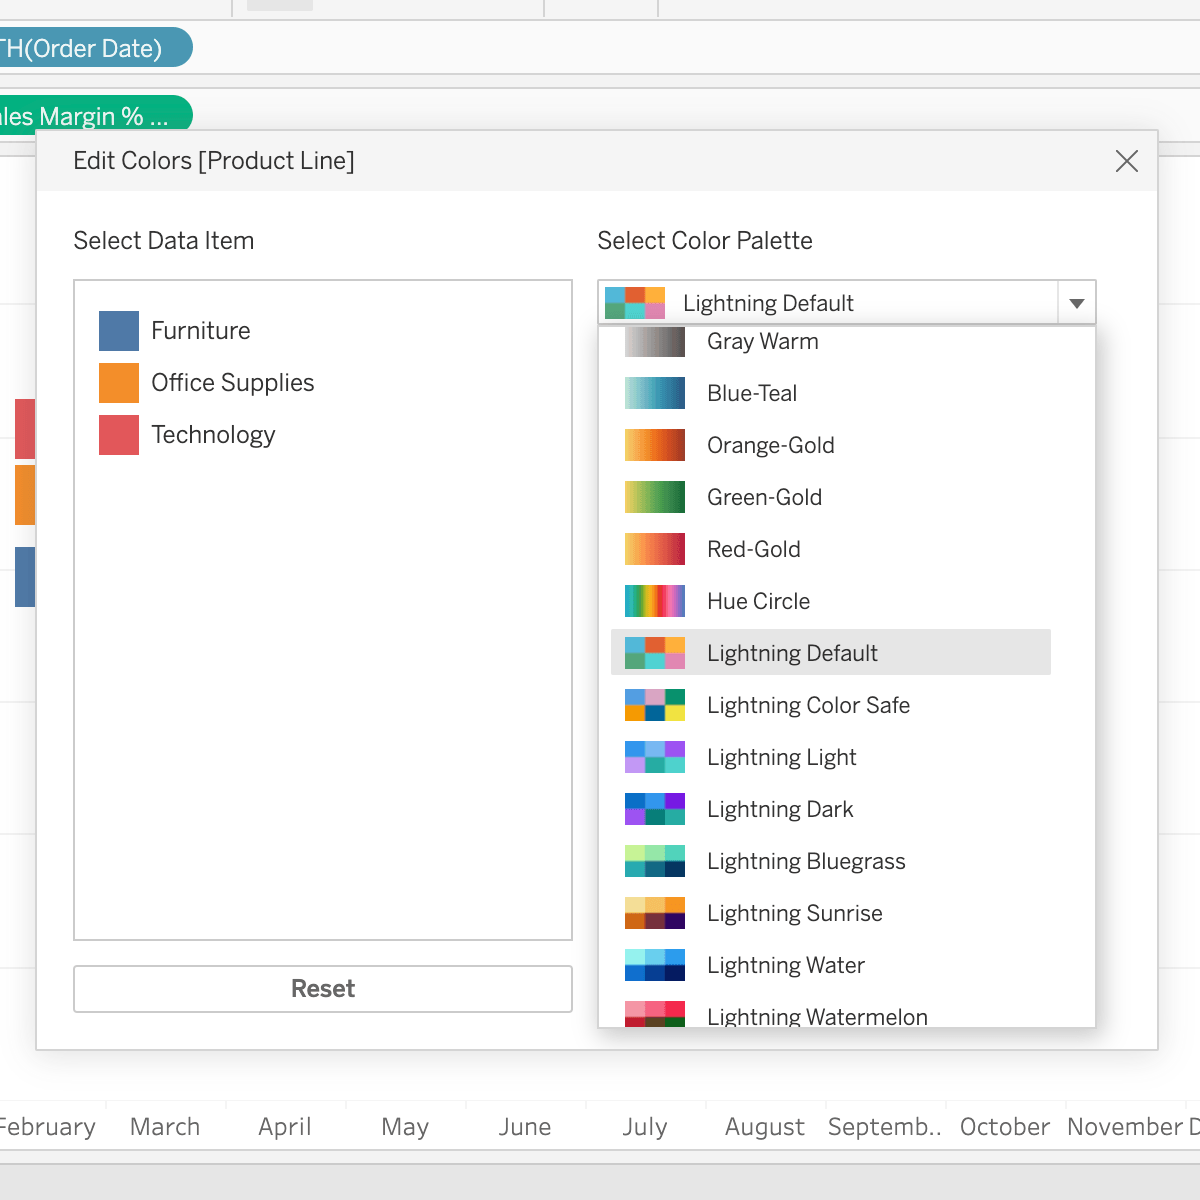
Salesforce style color palette
Quickly apply the same color styles of your Salesforce dashboards to your Tableau visualizations. Streamline the customization process when embedding a Tableau visualization into any Salesforce dashboard by selecting the Salesforce-specific colors, now available as a new color palette.
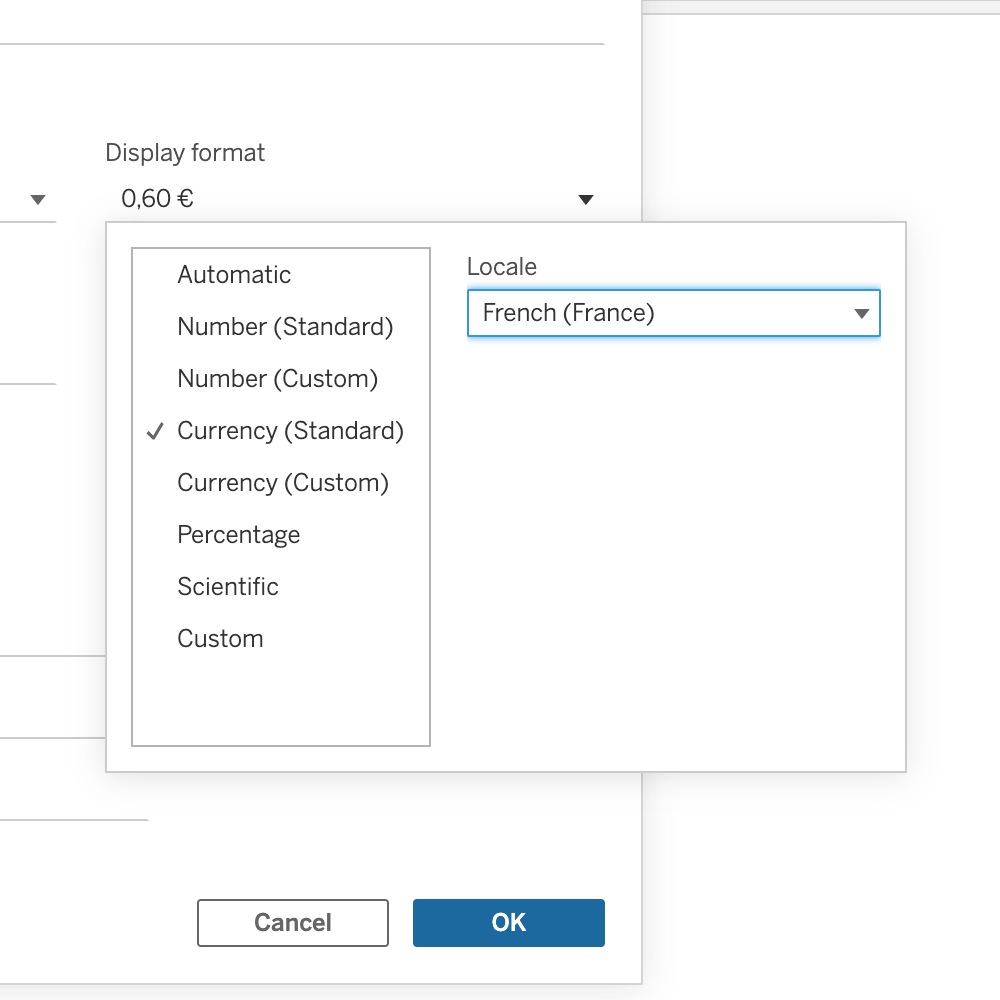
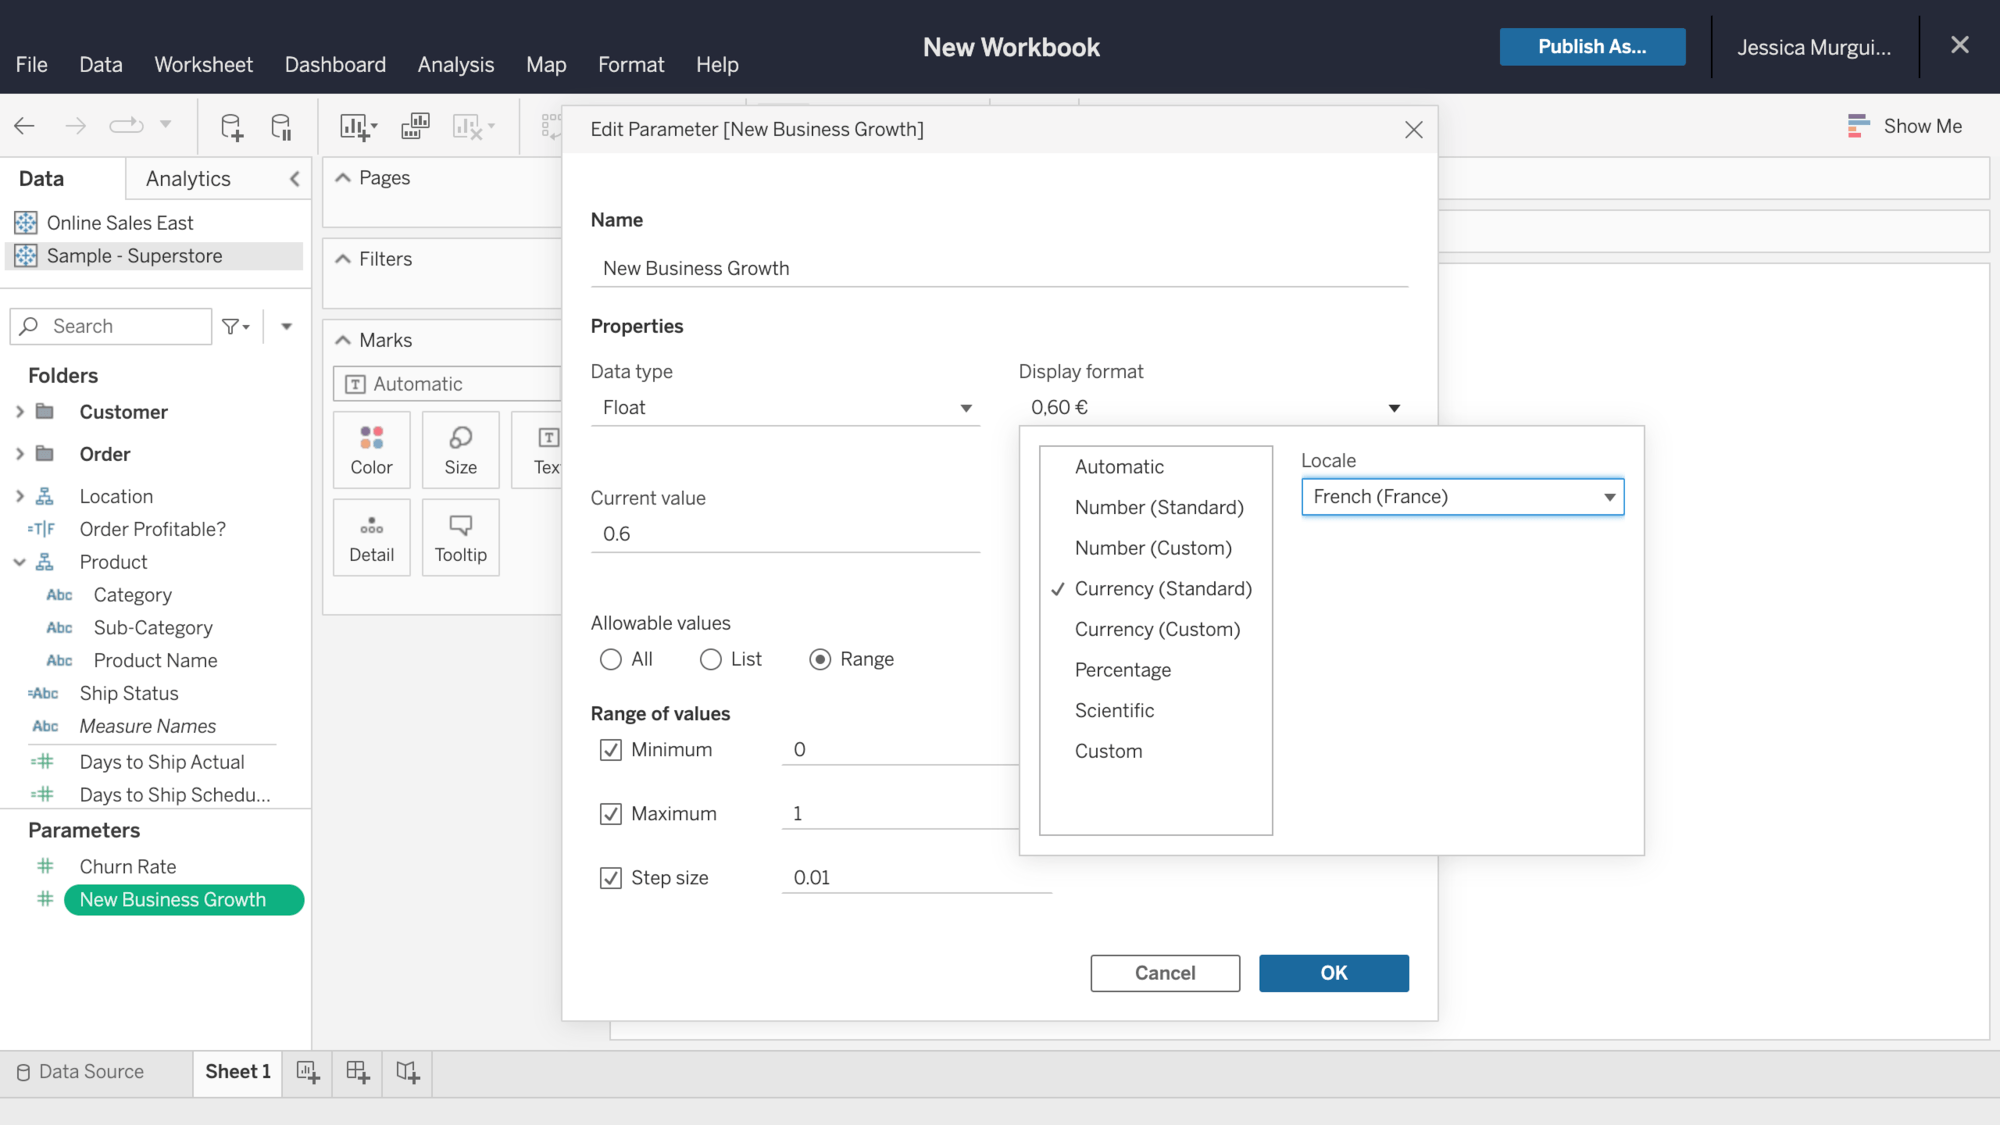
New formatting capabilities
Choose from a variety of number and date formatting options for Parameters on Tableau Online and Tableau Server. For numbers, you can now easily format them to display negative values and localize currency with the proper symbol and value. For date fields, use any common date and time format or quickly customize it according to your company’s standards.
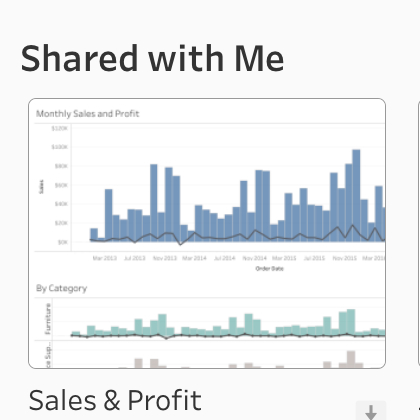
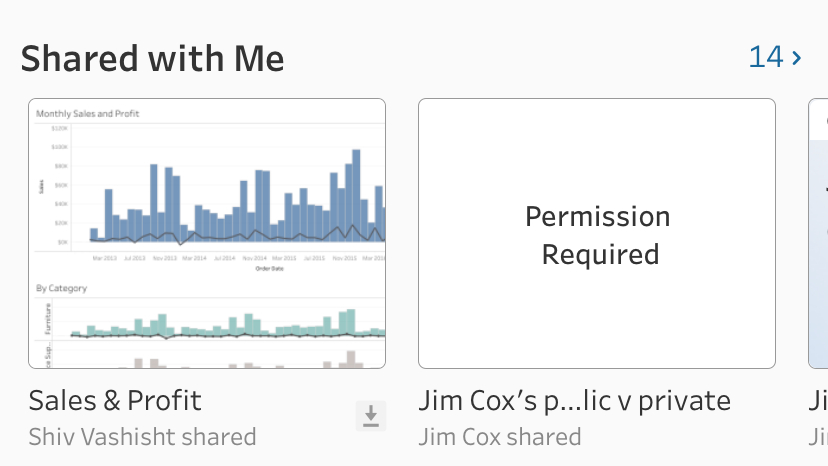
Mobile improvements
Find the data you need faster with Collections and Shared With Me now available in Tableau Mobile.
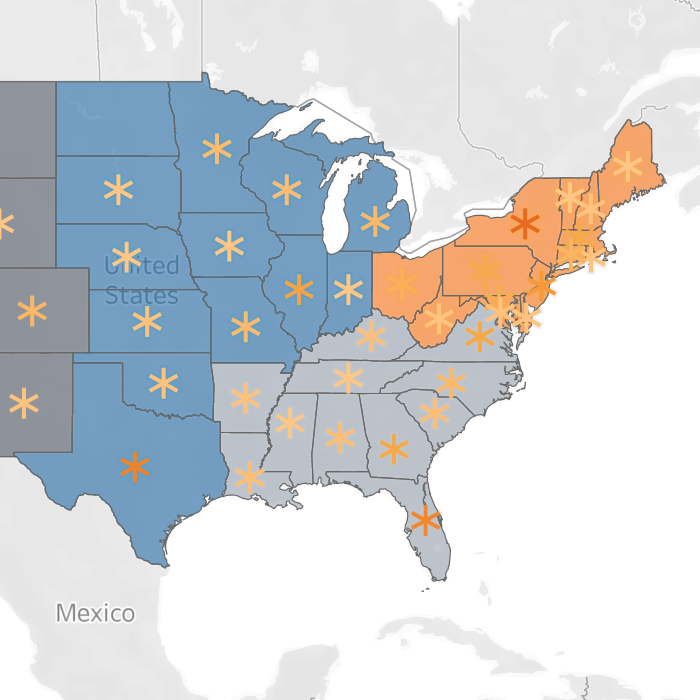
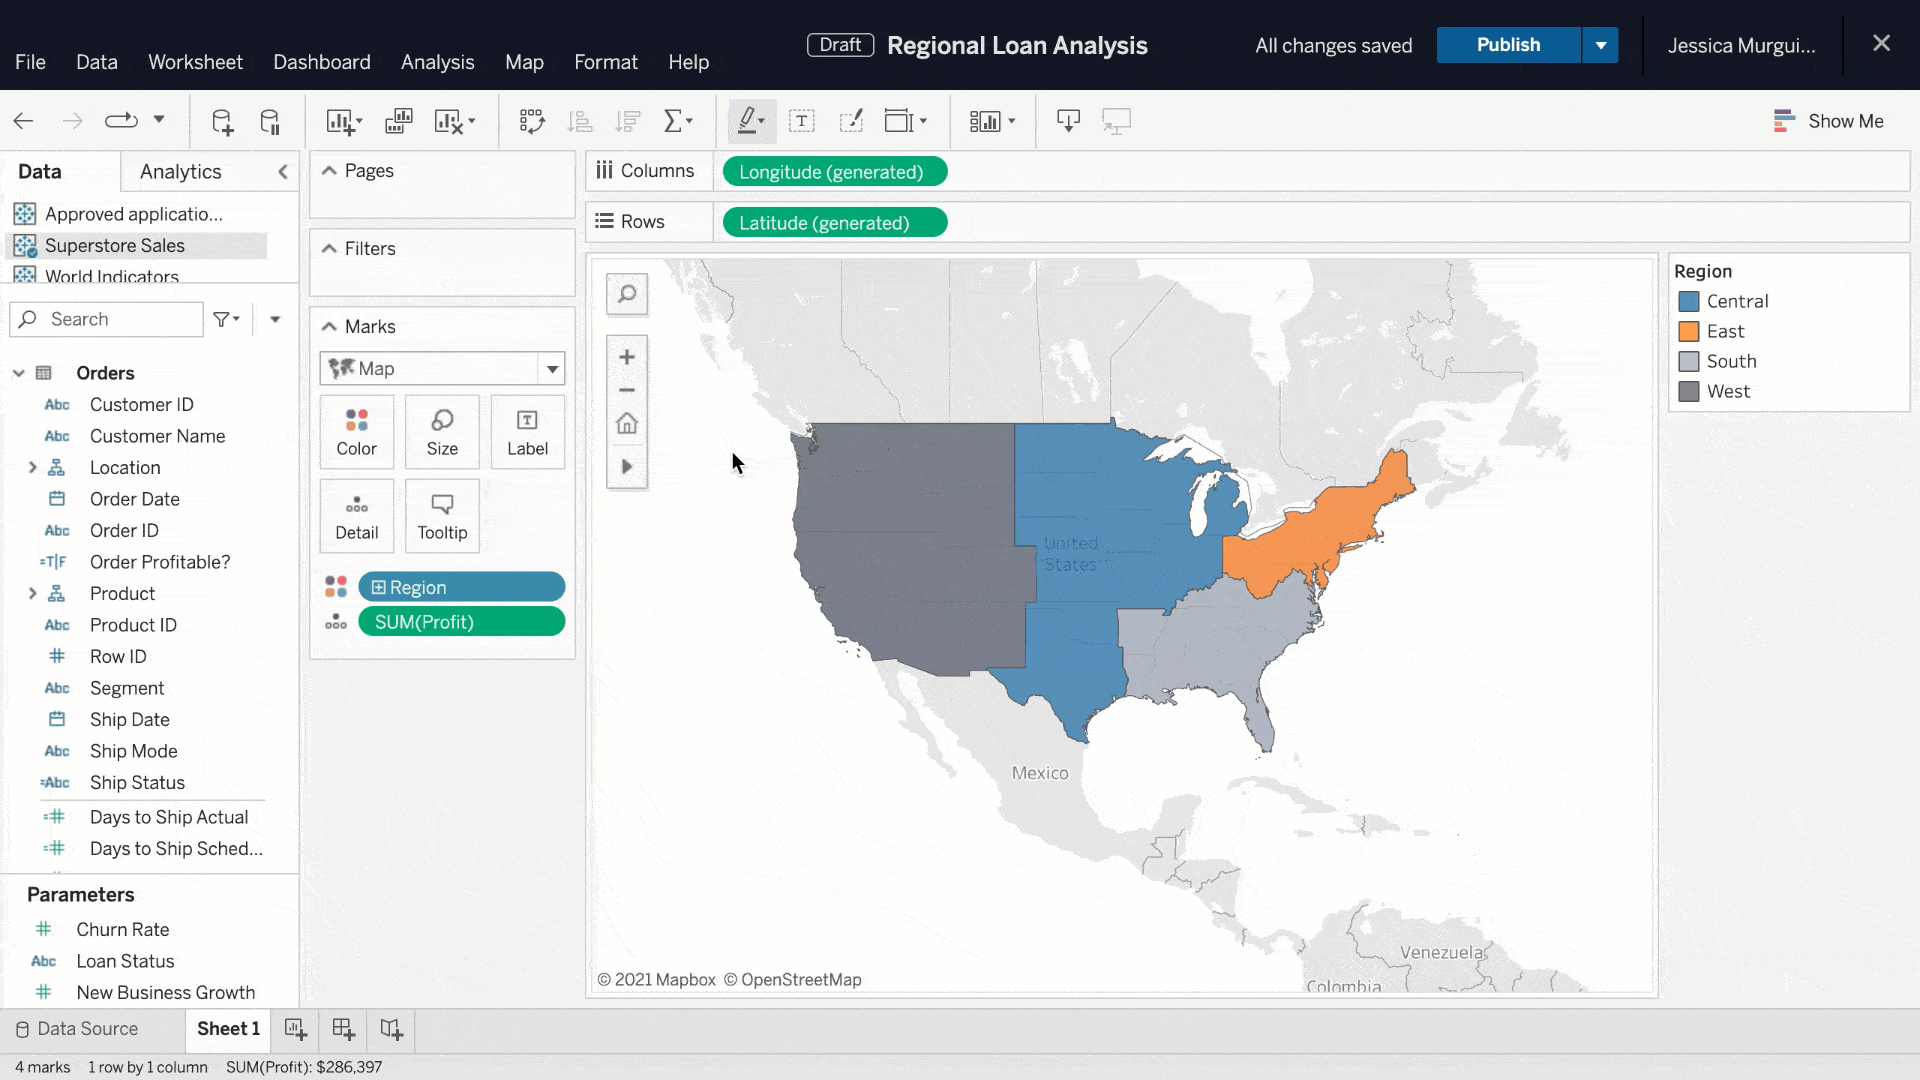
Multi data sources support in map layers
The capability of adding an unlimited number of layers to your map visualization just got more powerful. With support for multiple data sources in map layers, you can now analyze more data in the context of one another. For example, you can build a map that shows your stores’ location, accessibility, population, and revenue - all coming from different data sources.
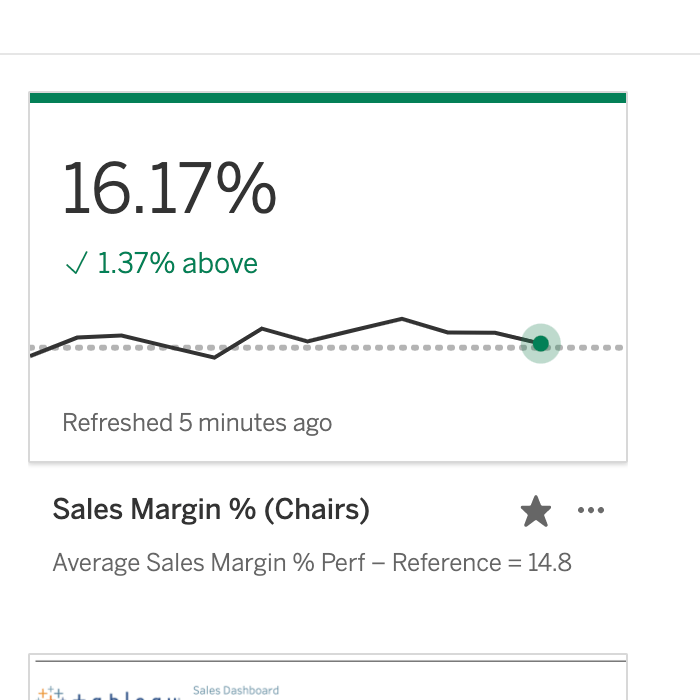
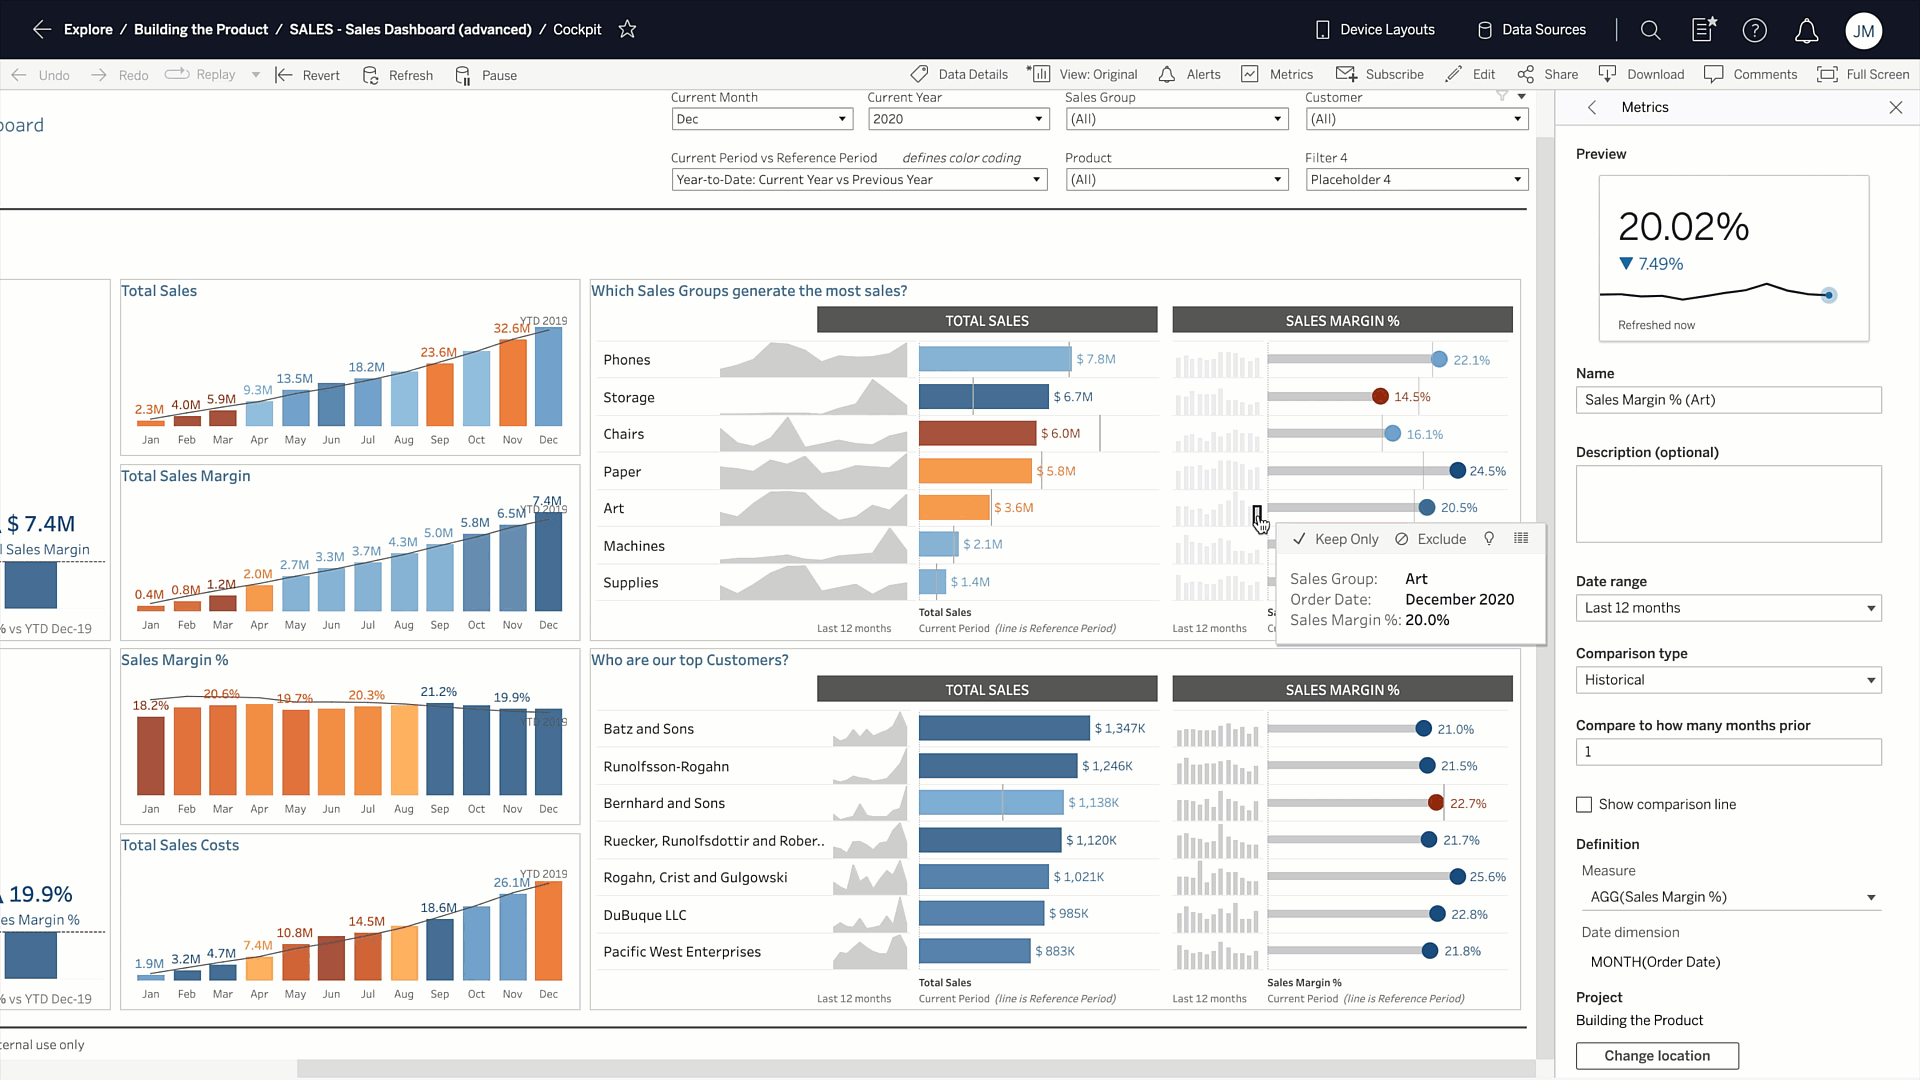
Metrics improvements
Released in Tableau 2020.2, Metrics provides the headlines for users’ data, enabling them to track key data points without having to access their dashboards. With 2021.4, you can now embed Metrics into your analytical apps, corporate portals, or webpages to provide a more personalized experience for different people and teams. Additionally, during Metric creation, you can now set the comparison period, the date range used by the metric, and automatically apply color status indicators, so it’s easier to spotlight a status change.
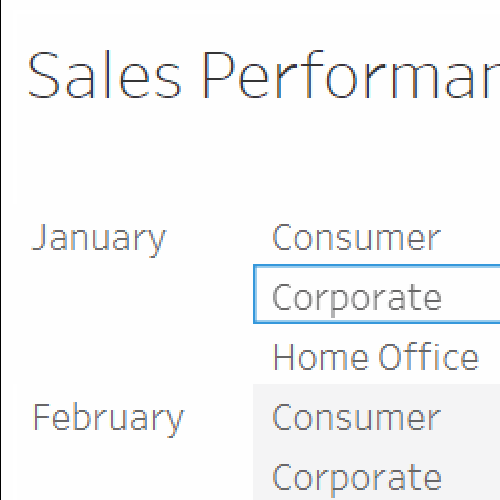
Accessibility improvements
More improvements for keyboard and screen reader accessibility on Tableau Server and Tableau Online. You can easily walk headers to select and access them to ‘View Data’. You can also hear verbal descriptions of all the member names of a field.
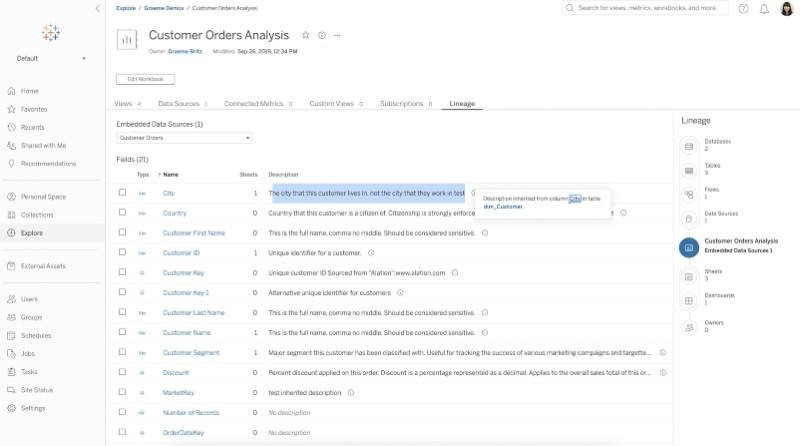
Inherited lineage descriptions
With inherited lineage descriptions, ensure that column-level descriptions from data sources and workbooks are shared downstream. Forget having to visit 10s or 100s of instances. Everywhere that data source or workbook is used, the description will be consistent. This also enables description editing at a single source.

Tableau Bridge Multi-Pool
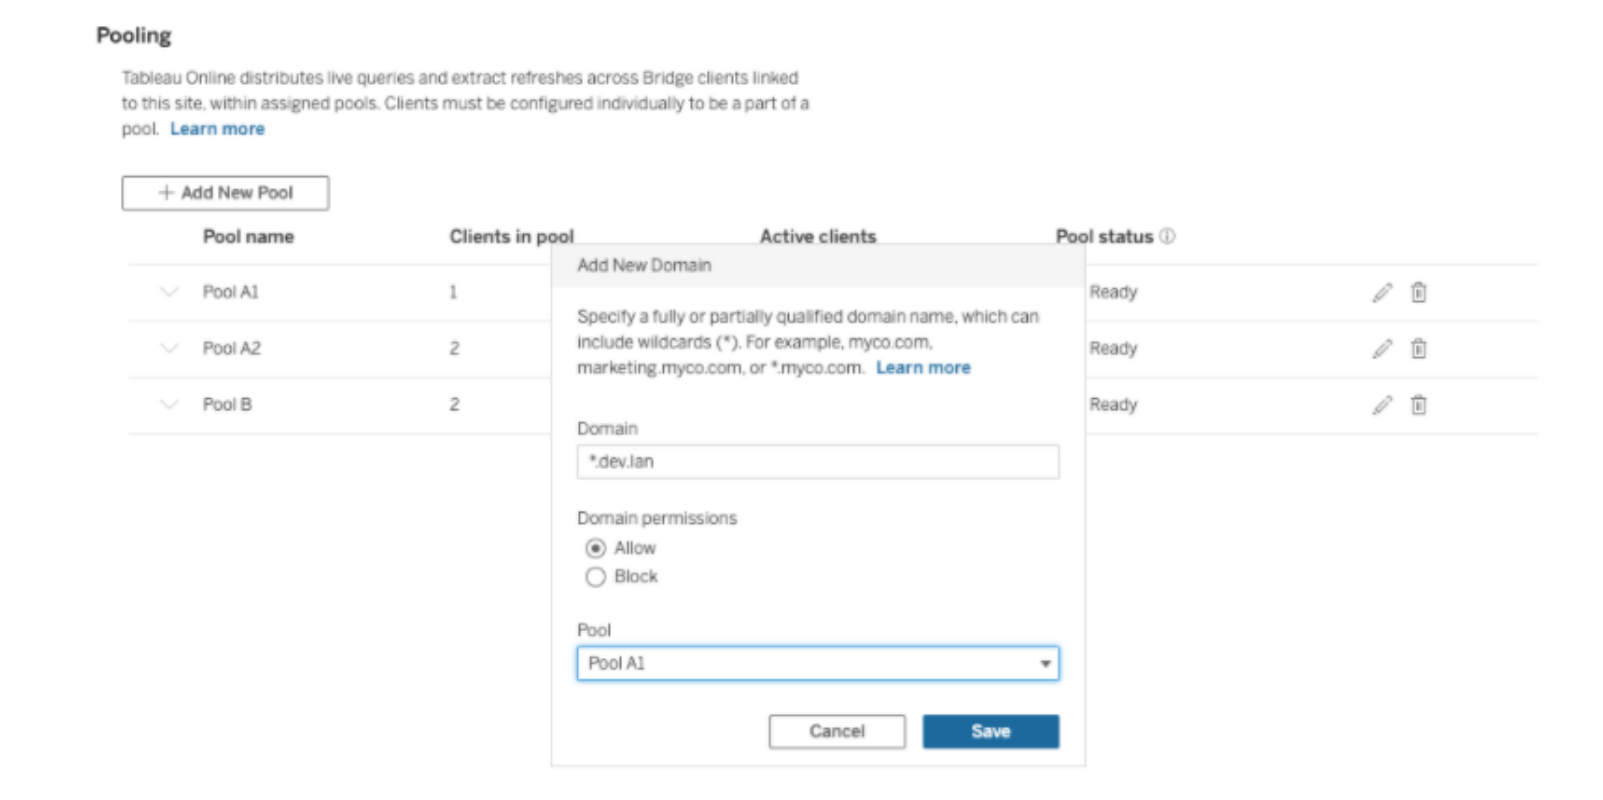
With Bridge Multi-Pool, you can achieve Multi-Network connectivity with Online Schedules. Multi-pool supports Bridge pools for each network so even the largest enterprise organizations can see and understand their private-network data in Tableau Online.

Subscription Emails for Flow Completion
Once you subscribe yourself and your team, flow completion emails will appear in your inbox when a scheduled flow run is complete in Tableau Prep. Now get notified as soon as fresh data is ready for use.


New connectors in Tableau Exchange
Tableau Exchange now has 25+ connectors including new ones for Salesforce Marketing Cloud, Zendesk, ServiceNow and SAP HANA C4C, to help you connect to your data easily and quickly.
We will be adding new connectors on an ongoing basis, independent of the Tableau product releases, so make sure to check out Tableau Exchange.

Support for Linux RHEL 8.3+ for Linux
In 2021.4, Tableau now supports deployments on Linux RHEL 8.3+

Server Authorization to Run (ATR)
Now enabled by default, Server Authorization to Run (ATR) product activation makes licensing Tableau Server in cloud, container or virtual environment deployments easier by removing the need to refresh or deactivate keys and removing reducing maximum activation errors.
Offline activation improvements
Air-gapped Tableau Server deployments will benefit from the removal of single-pass activation for the first license key, clearer error messages, and improved file naming.

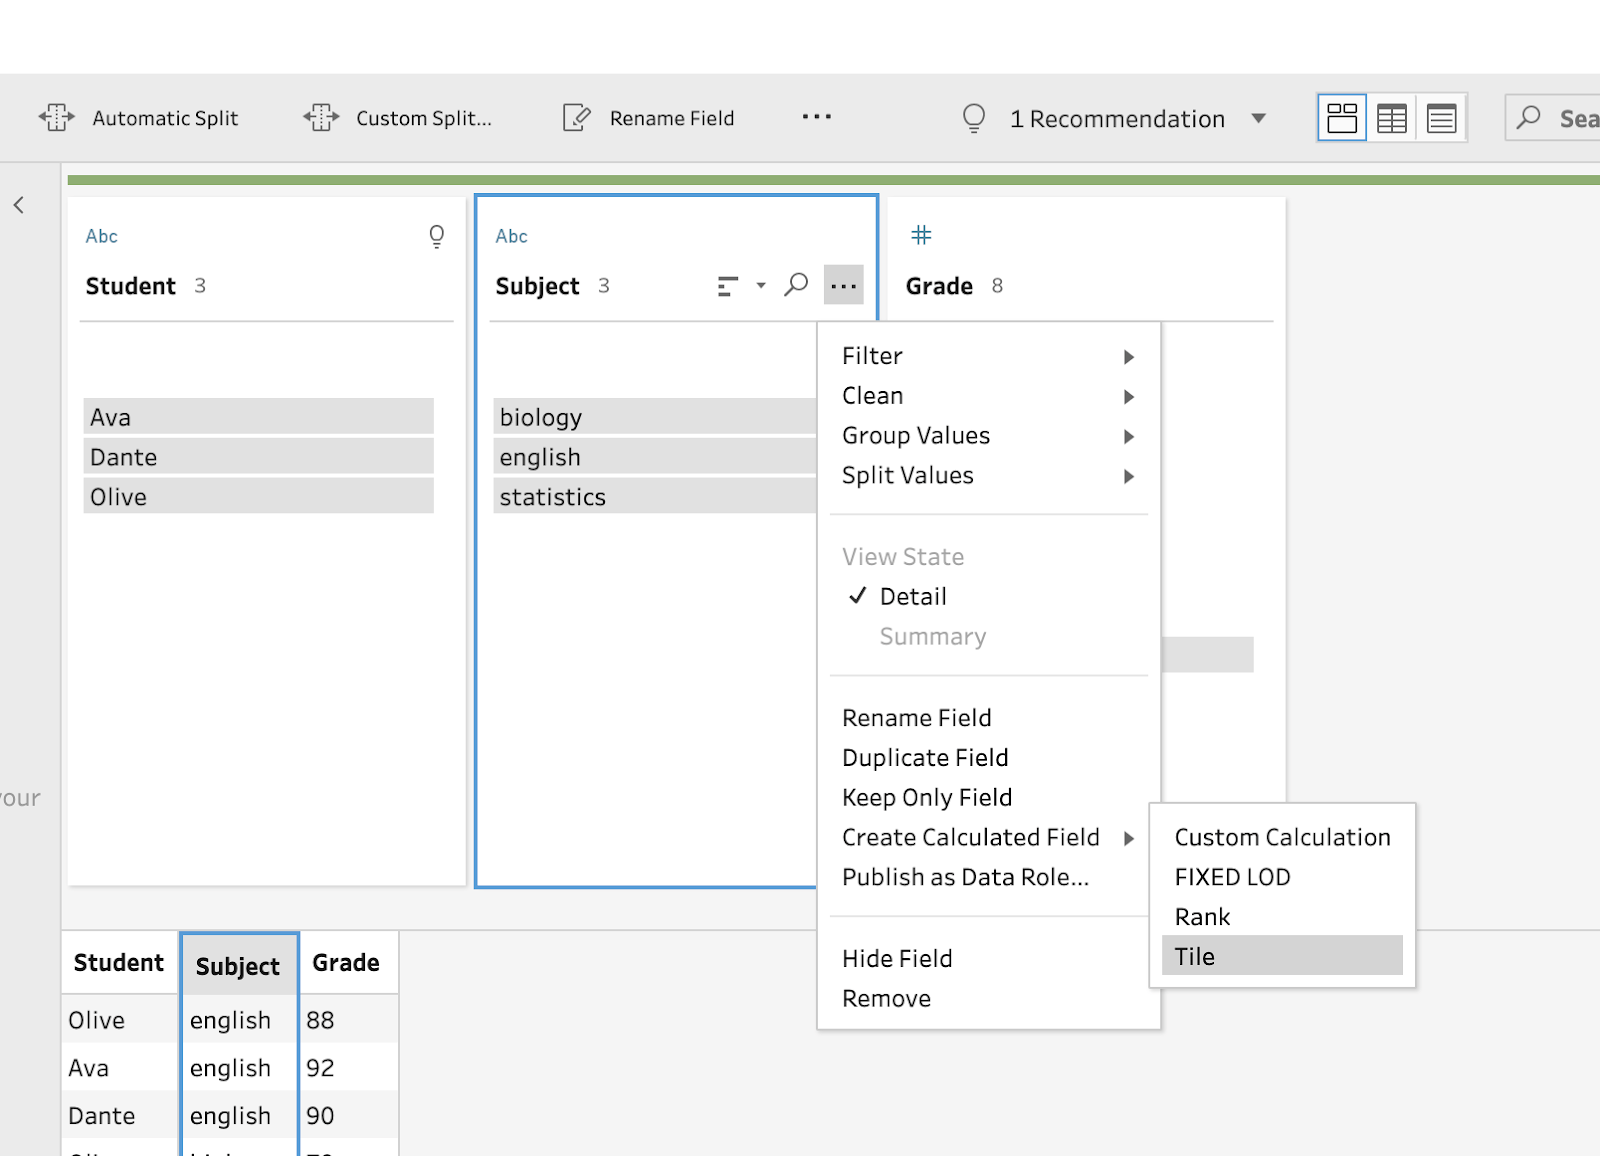
Tiling in Tableau Prep
It's easier to clean up your data your way! Tiling builds on the already existing RANK and FIXED Level of Detail functions in Tableau Prep. It allows customers to distribute rows into a specified number of tiles or buckets based on a specified order by FIELD and GROUP BY or partition field.
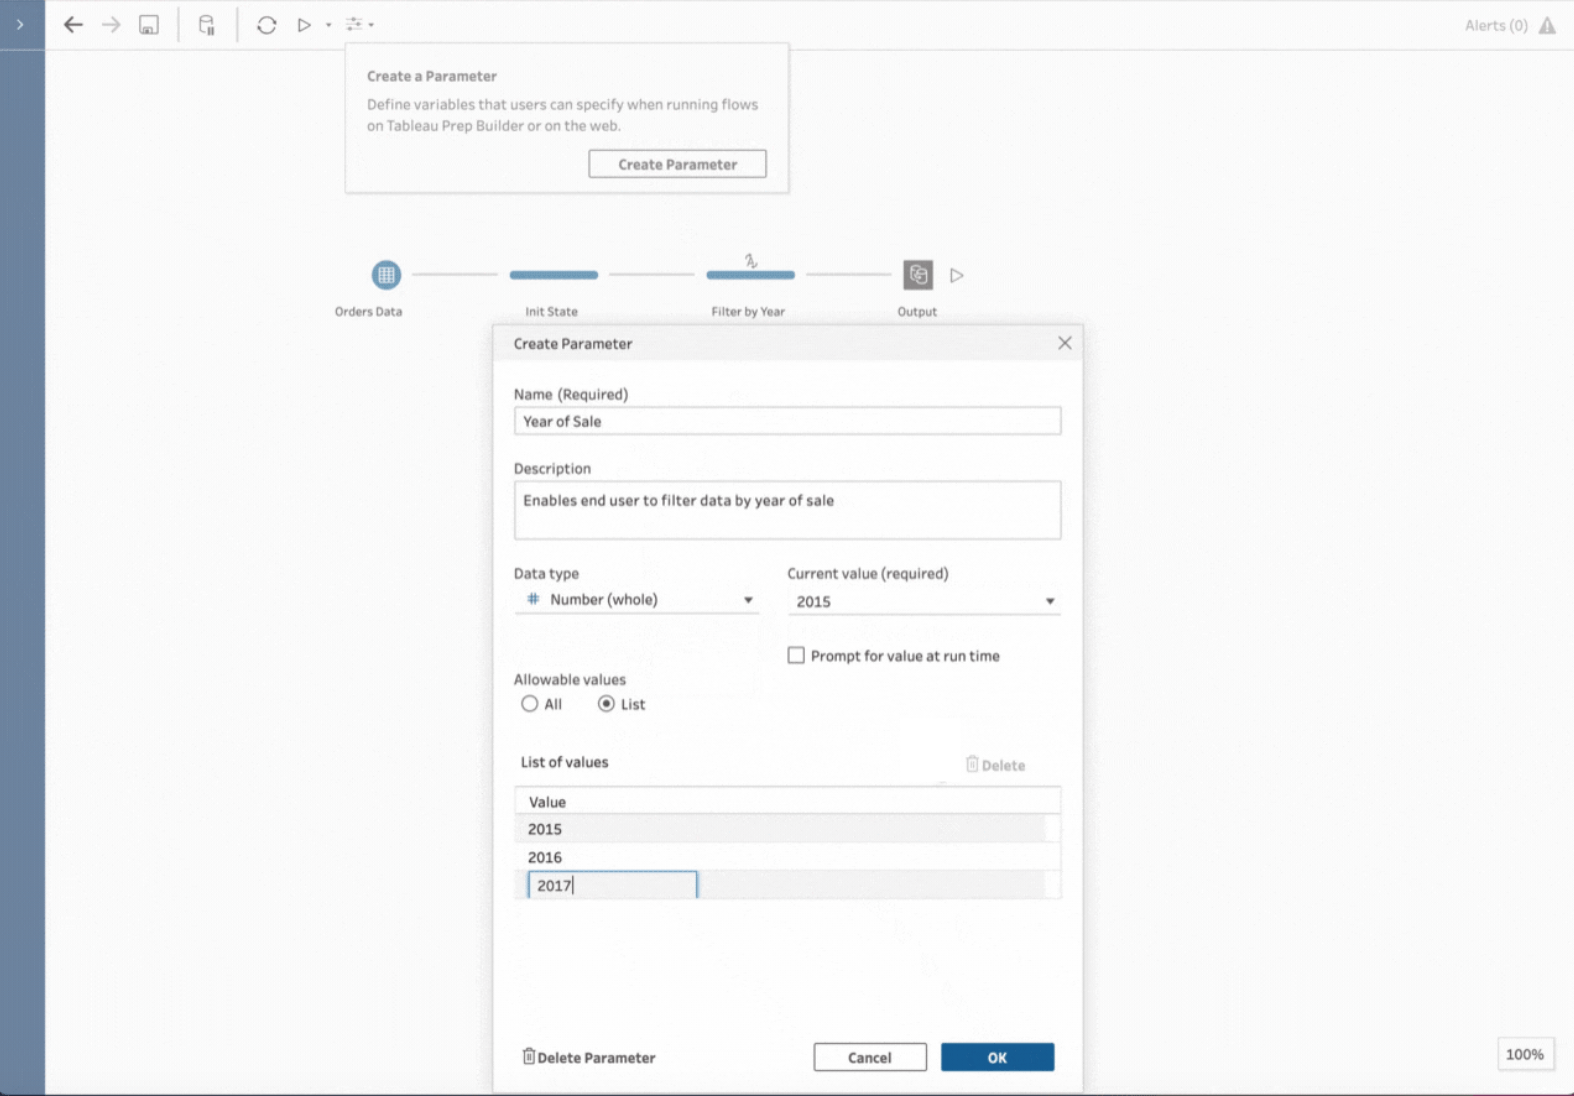

Parameters in Tableau Prep
A parameter is a global placeholder value that can replace a constant value in a Prep flow. Parameters can be specified at run time or schedule time to easily transition a flow to be used on different inputs and outputs with the same schema, as well as quickly edit values used throughout a flow in calculated fields or filters.
Learn More About Tableau Releases