
Tableau 2019.4
Explore the newest features in Tableau 2019.4 including view recommendations, table improvements, and webhooks support
Feature highlights
View recommendations
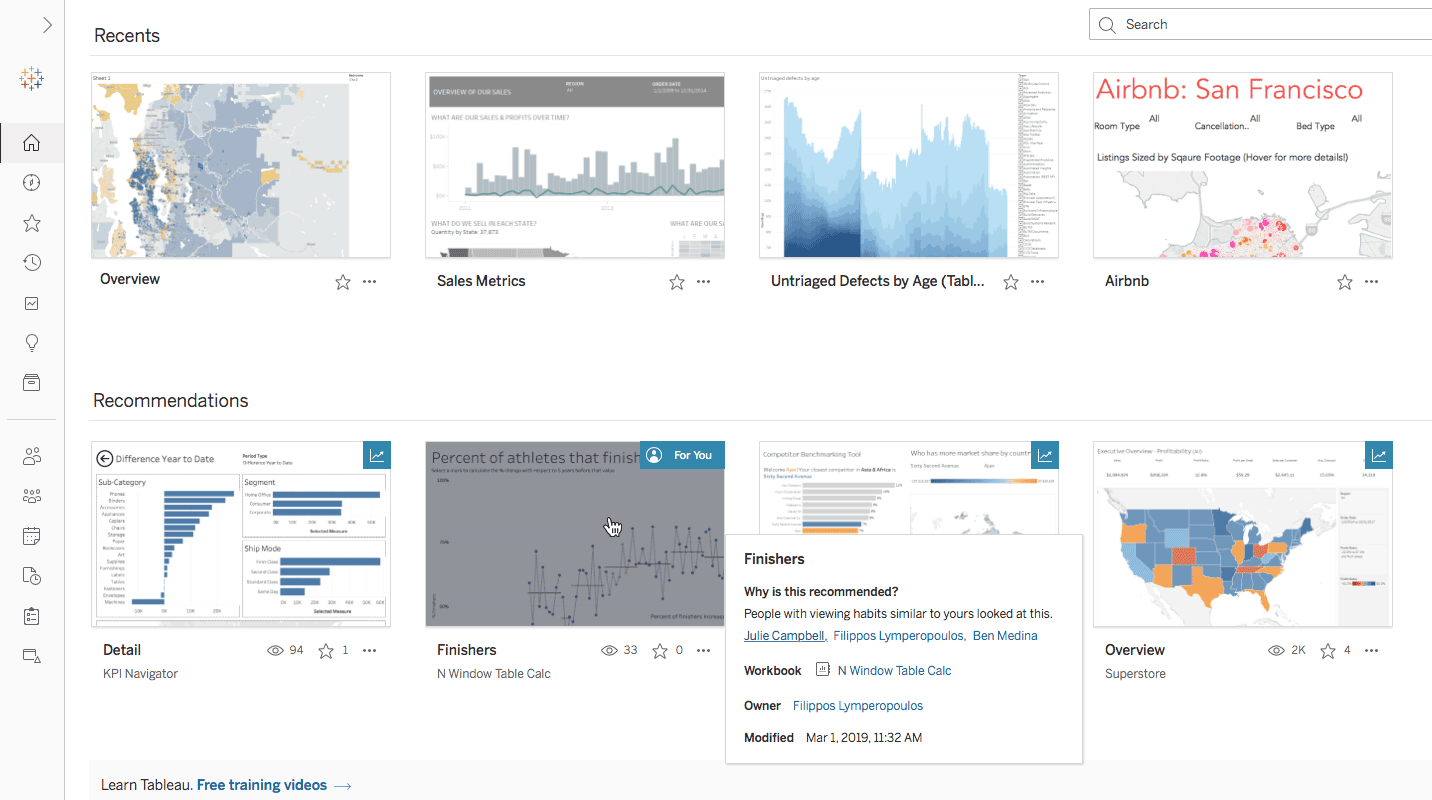
View recommendations are personalized suggestions that instantly connect you to relevant data and content on your site. Powered by machine learning, these recommendations match preferences between users, surfacing content that others like you have found interesting or useful, including what's most popular and recent.
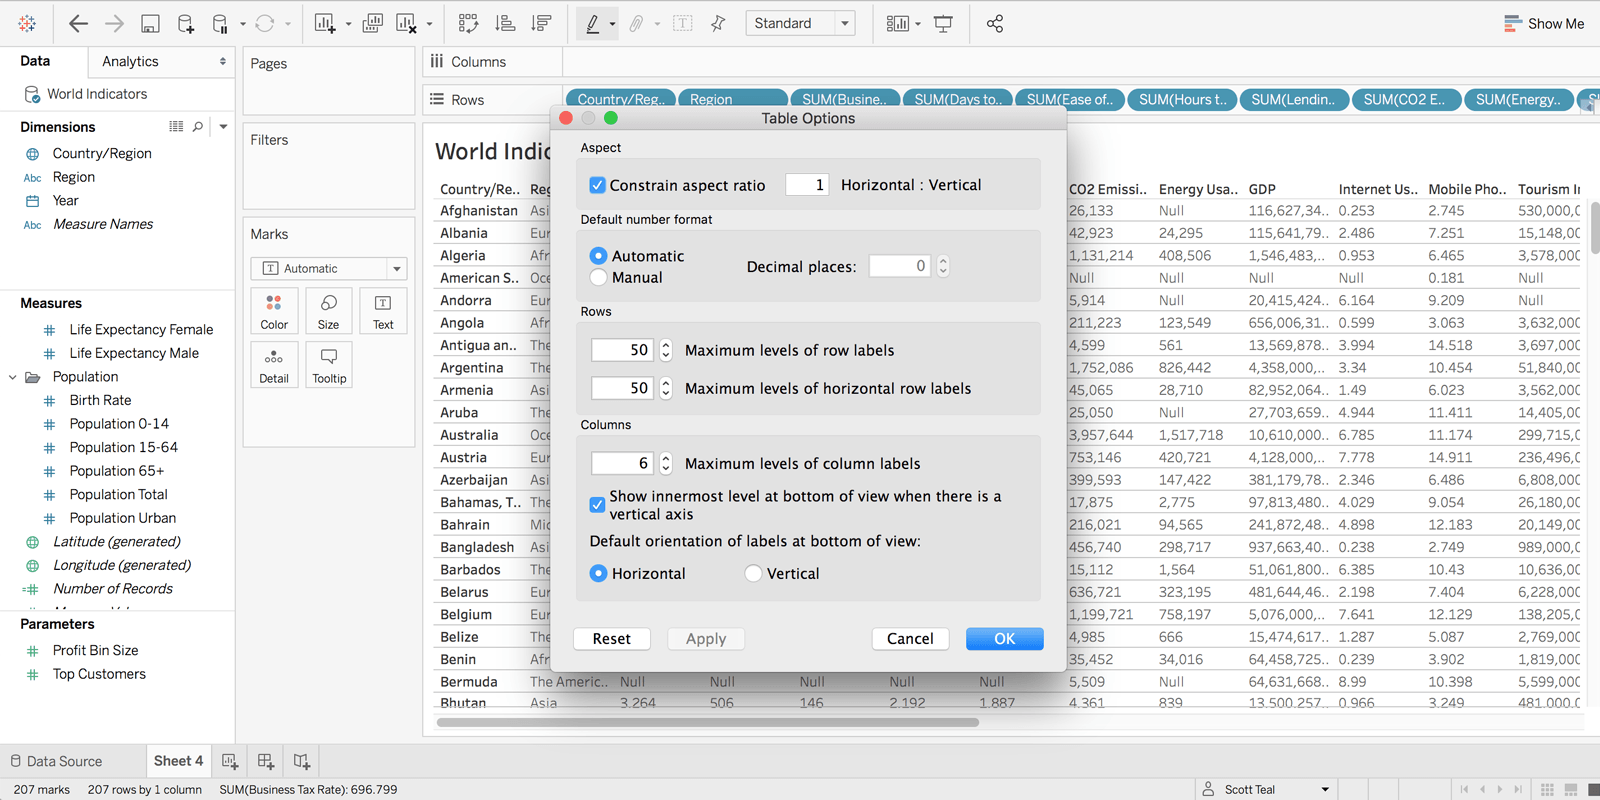
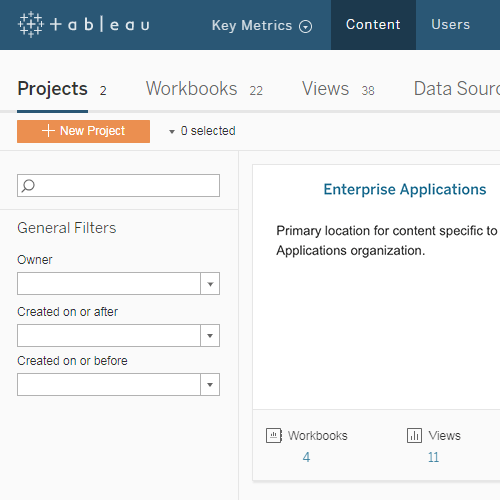
Table improvements
Now you can create tables with up to 50 columns with the ability to scroll horizontally. For flat tables, sort entire columns by dimensions and discrete measures across multiple panes.
Tables are essential to our everyday analysis in Administration and Finance. Now that we can see detail with more than 16 columns and with horizontal scroll, we will be able to understand our tables much better directly in Tableau, without needing to export the data. We are delighted!
Webhooks support
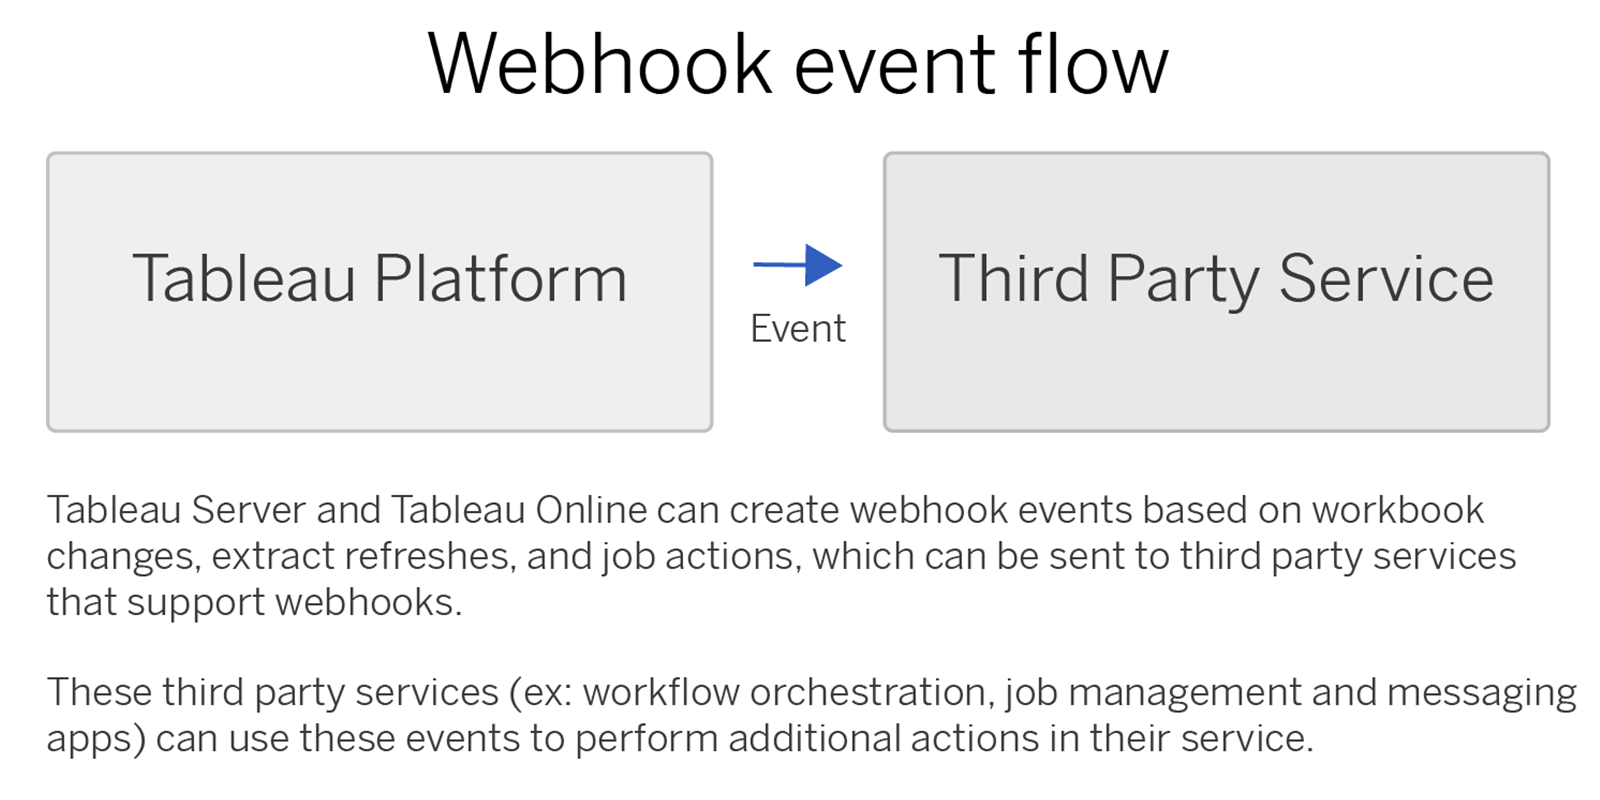
You can now create automated workflows, triggered by events as they happen, with webhooks support for Tableau Cloud and Tableau Server. With webhooks support, the possibilities are endless - you could build workflows that alert users of new content through Slack, or automatically create case tickets within ServiceNow, if an extract fails.
Join the dev program to learn more
Tableau 2019.4 Feature Overview
Tune in for an overview of all the new features included in this release.
Watch nowAll Features


Alibaba Connectors
Now, through a partnership with Alibaba, Tableau customers will be able to natively connect and analyze data in MaxCompute, AnalyticDB, or Data Lake Analytics.
Read more about this partnership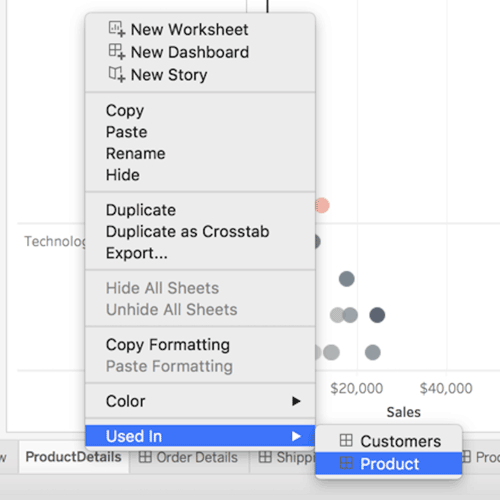
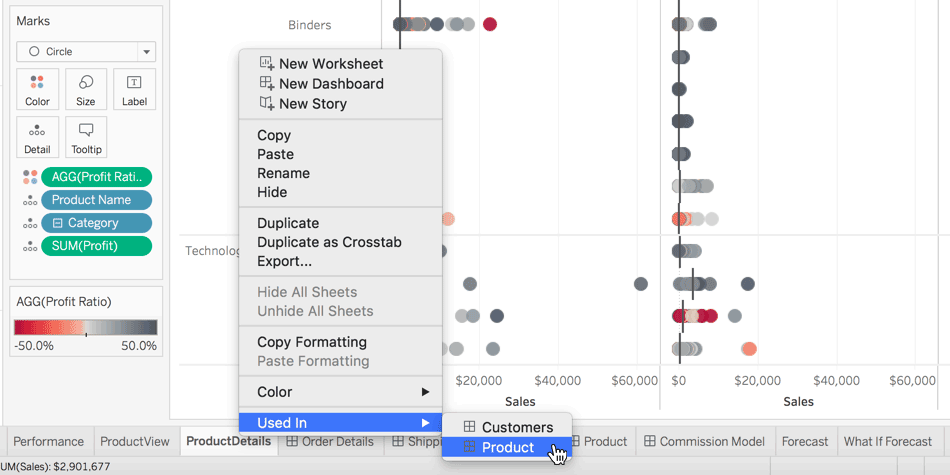
Go to where a sheet is used
We’re making it faster to navigate larger, complex workbooks that contain multiple sheets. Easily view and jump to all locations in a workbook (dashboards, stories) where a worksheet is used.
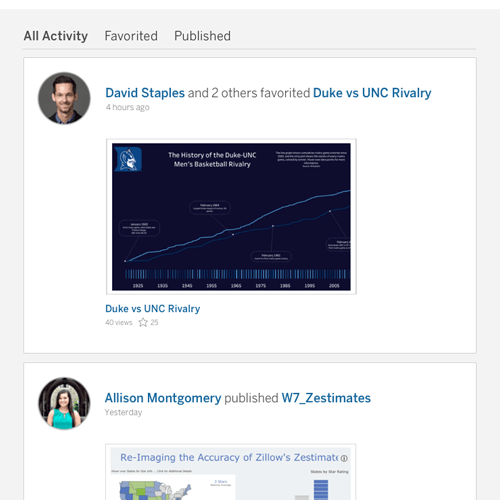
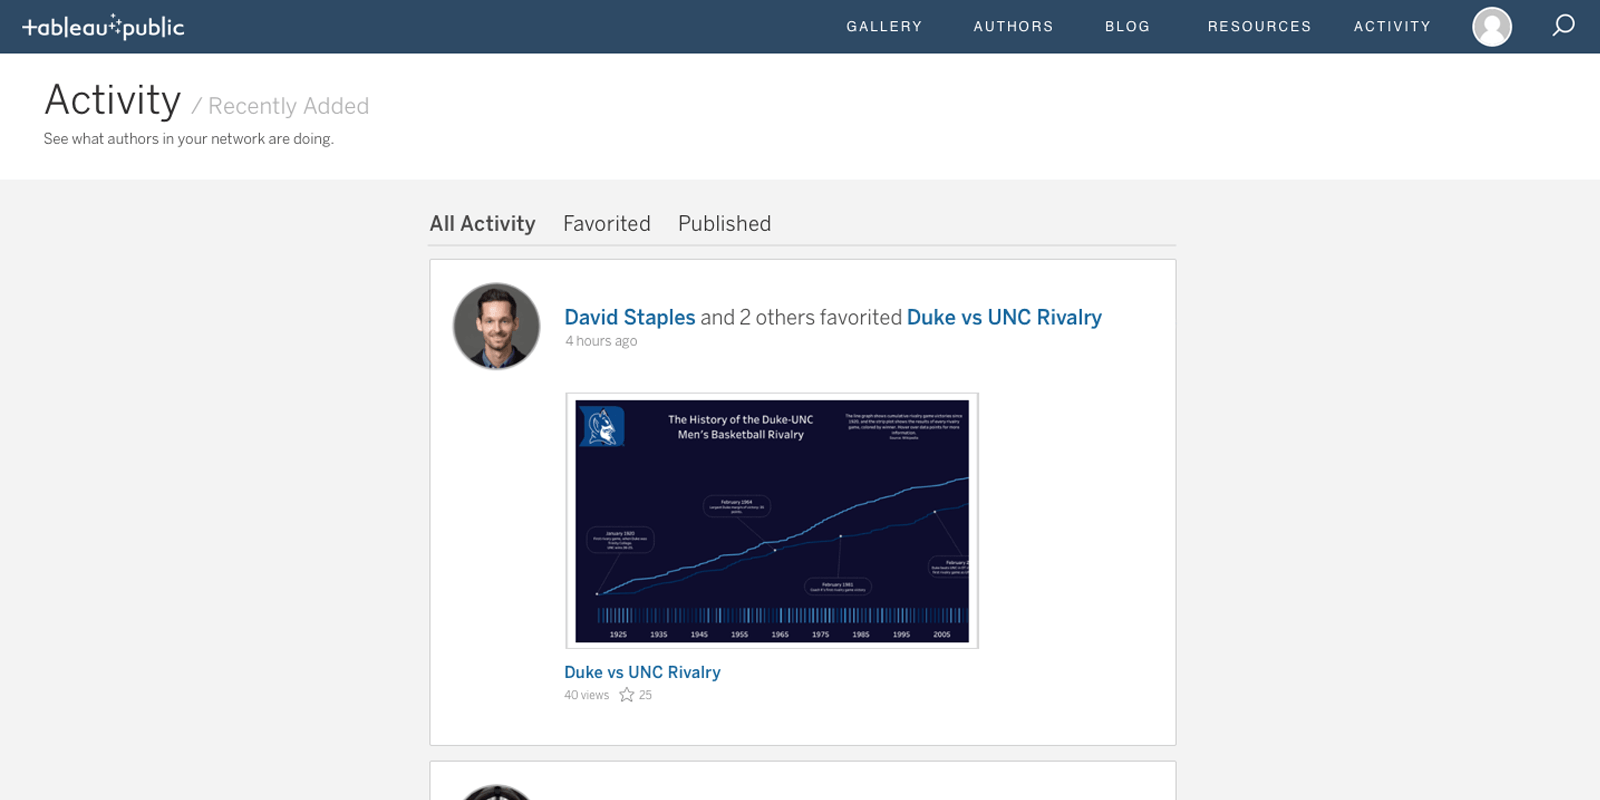
Activity feed improvements
Filter your personalized Tableau Public activity feed by toggling between activity type. Favorites are now grouped together for the same viz.
SAP HANA connector improvements
Now when you connect to SAP HANA, leveled hierarchies utilized in calculation views will automatically be available in Tableau.

Kyvos Connector
For customers using Kyvos, you can now natively connect and start analyzing your data. Available for Tableau Desktop and Tableau Server.

For customers using Presto, you can now take full advantage of the innovation of Qubole as a native connector. Available for Tableau Desktop and Tableau Server.
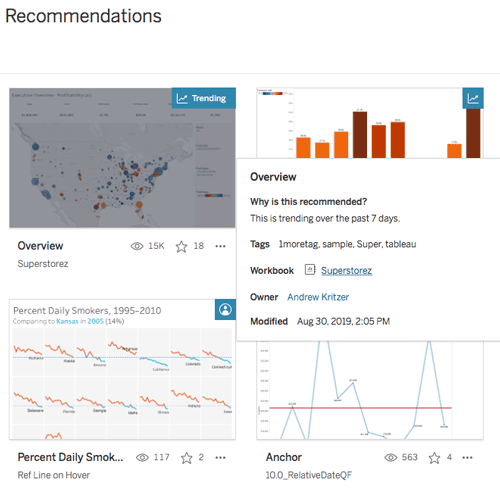
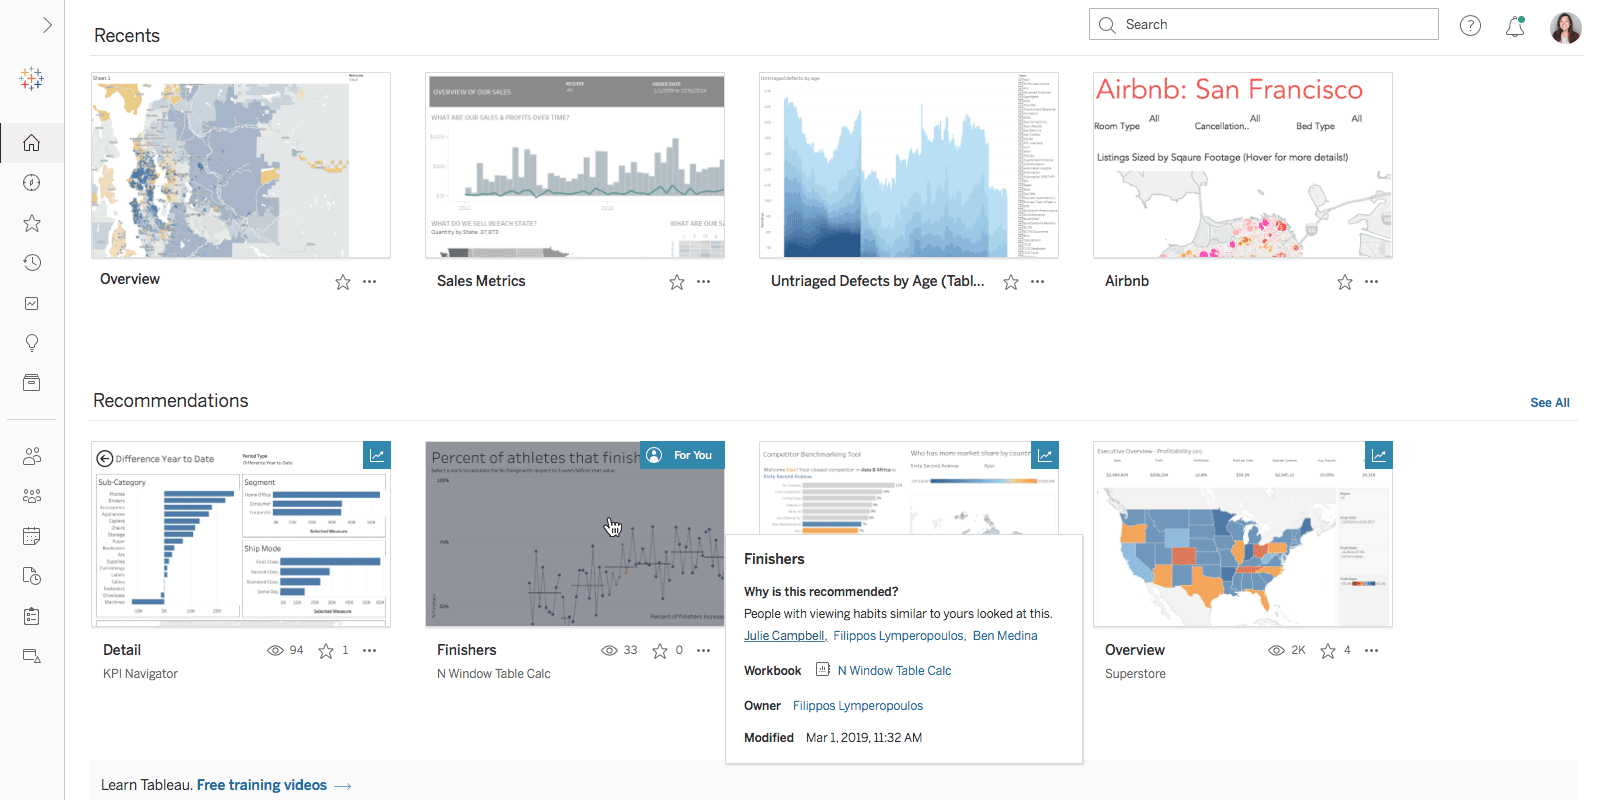
View recommendations
View Recommendations are personalized suggestions that instantly connect you to relevant data and content on your site. Powered by machine learning, these recommendations match preferences between users, surfacing content that others like you have found interesting or useful, including what's most popular and recent.
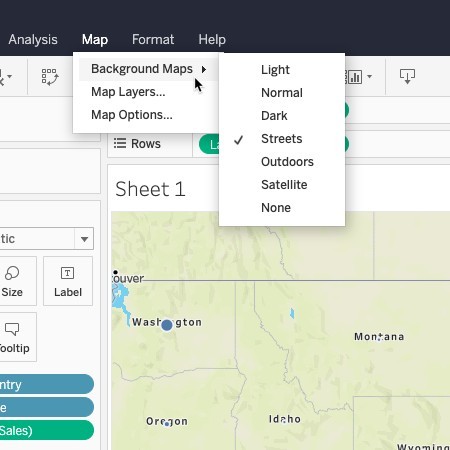
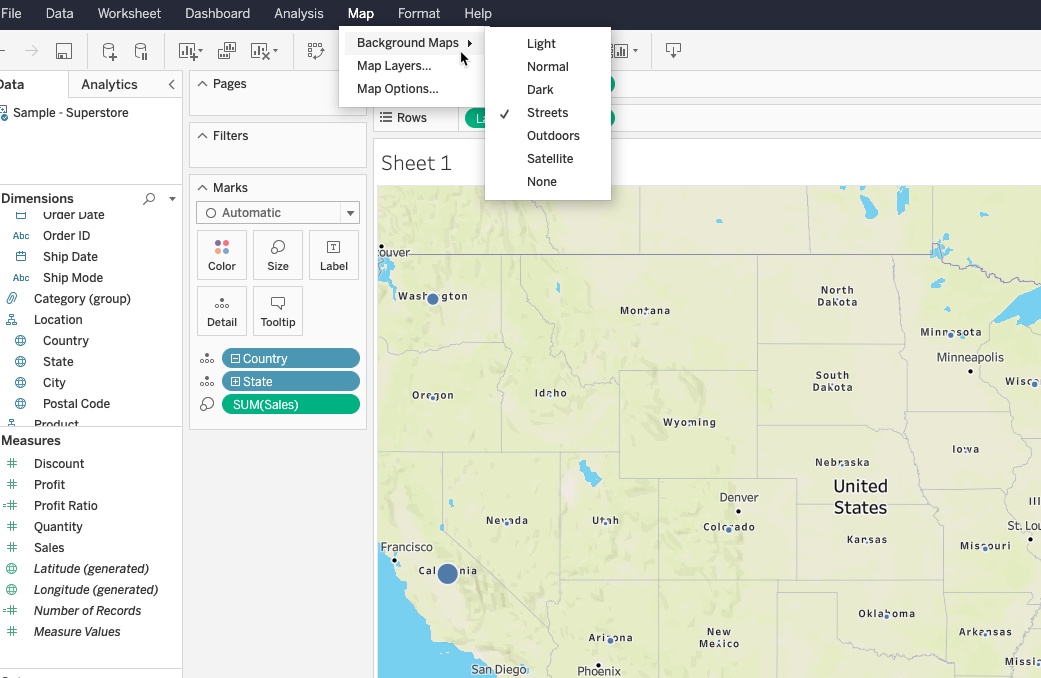
Map improvements in the browser
Update map settings in the browser. Change map backgrounds, styles, layers, and other settings in the browser without having to jump into Desktop.
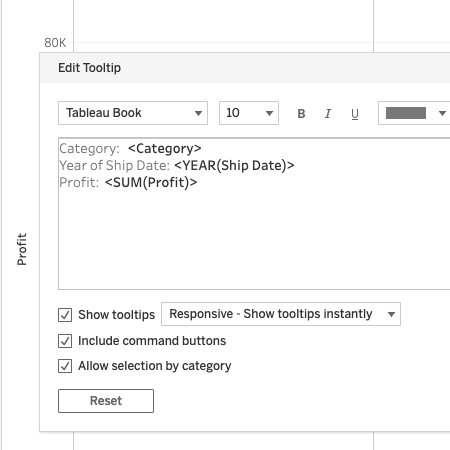
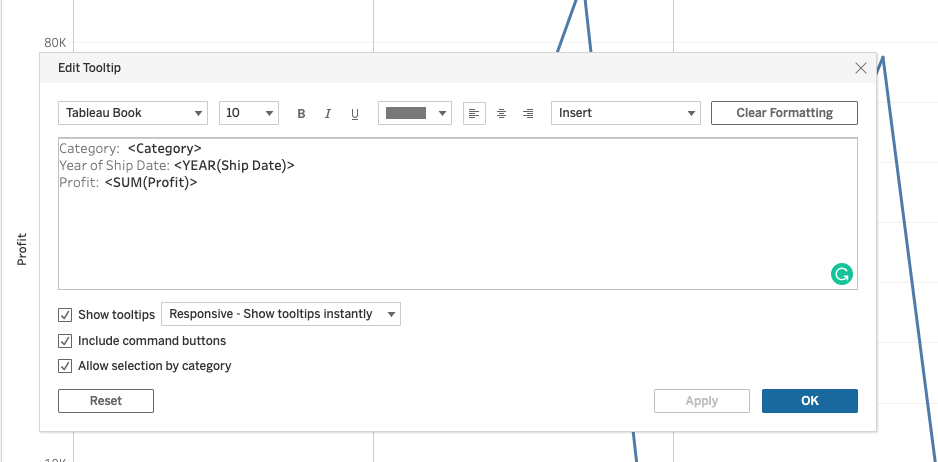
Edit tooltips in the browser
Edit tooltips in the browser. Stay in the data flow, create and update tooltips while web authoring.
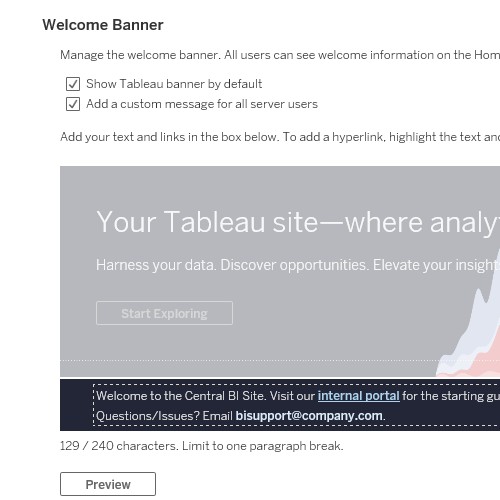
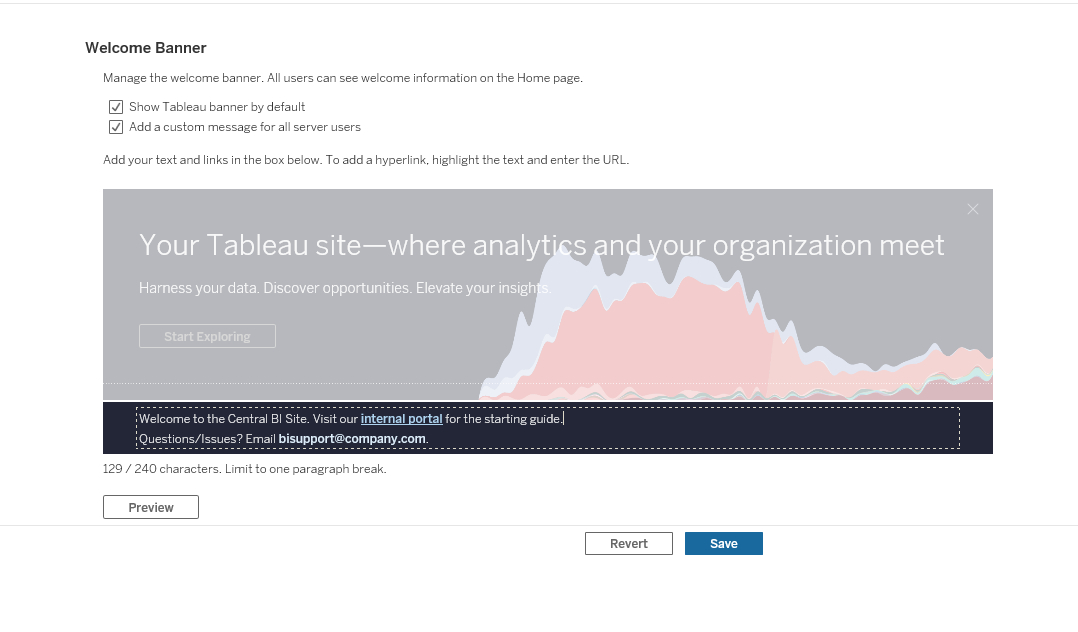
Custom welcome banner for Tableau Server
Ensure your team finds important resources and information by customizing the welcome banner on the Home screen.
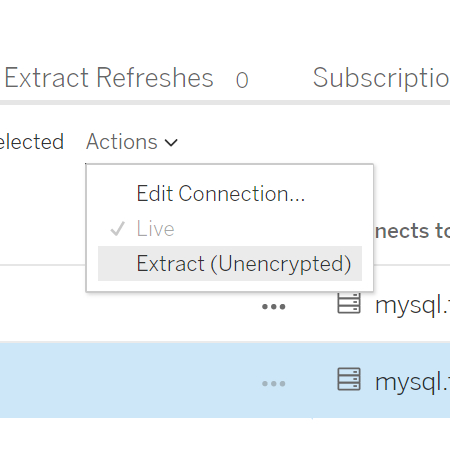
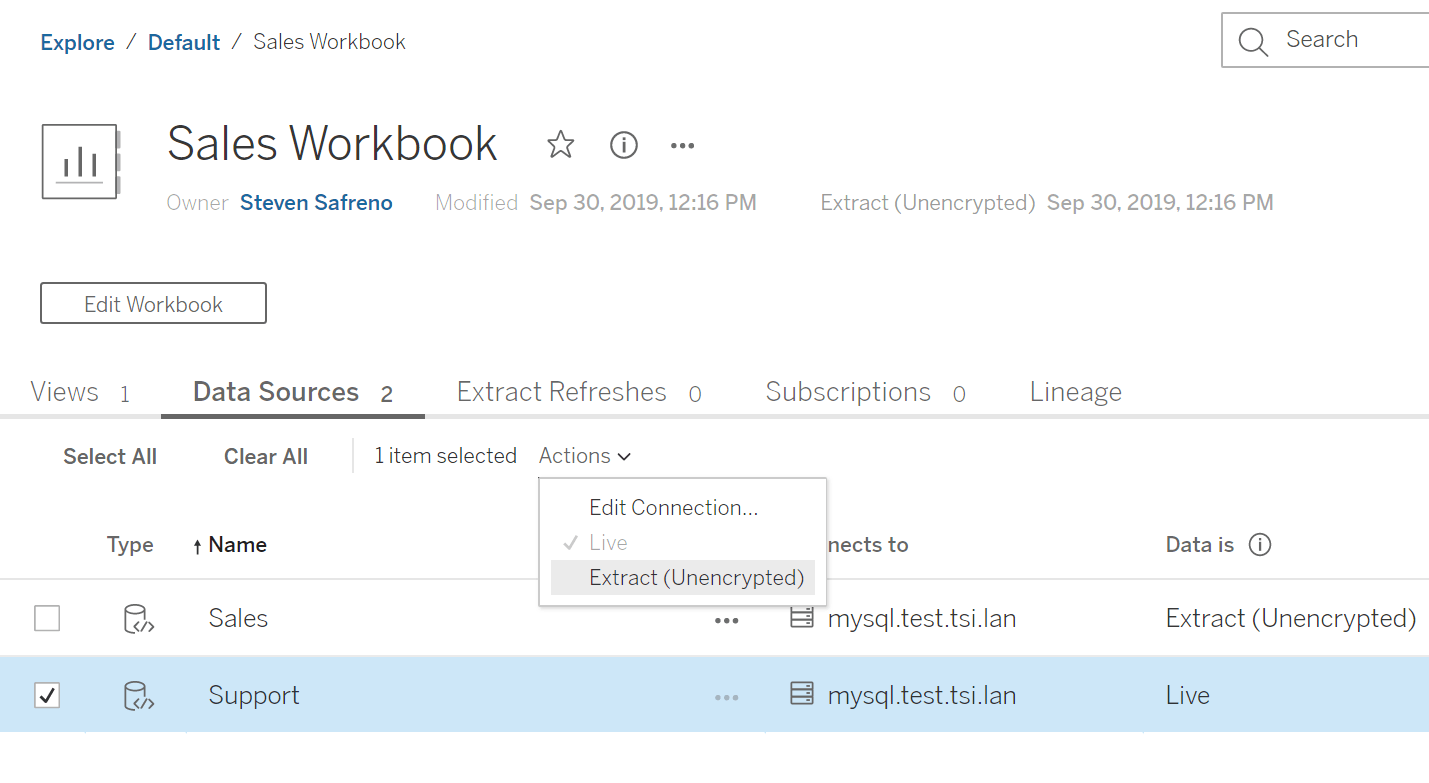
Create extracts in the browser
Skip the Desktop, build extracts right in the browser to save time and give your laptop a break.
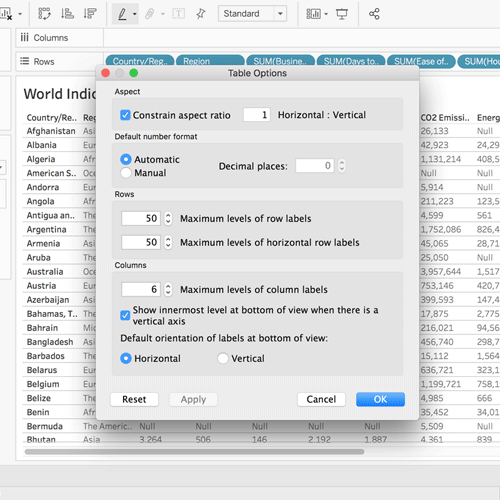

Table improvements
Create tables with up to 50 columns with the ability to scroll horizontally. For flat tables, sort entire columns by dimensions and discrete measures across multiple panes.
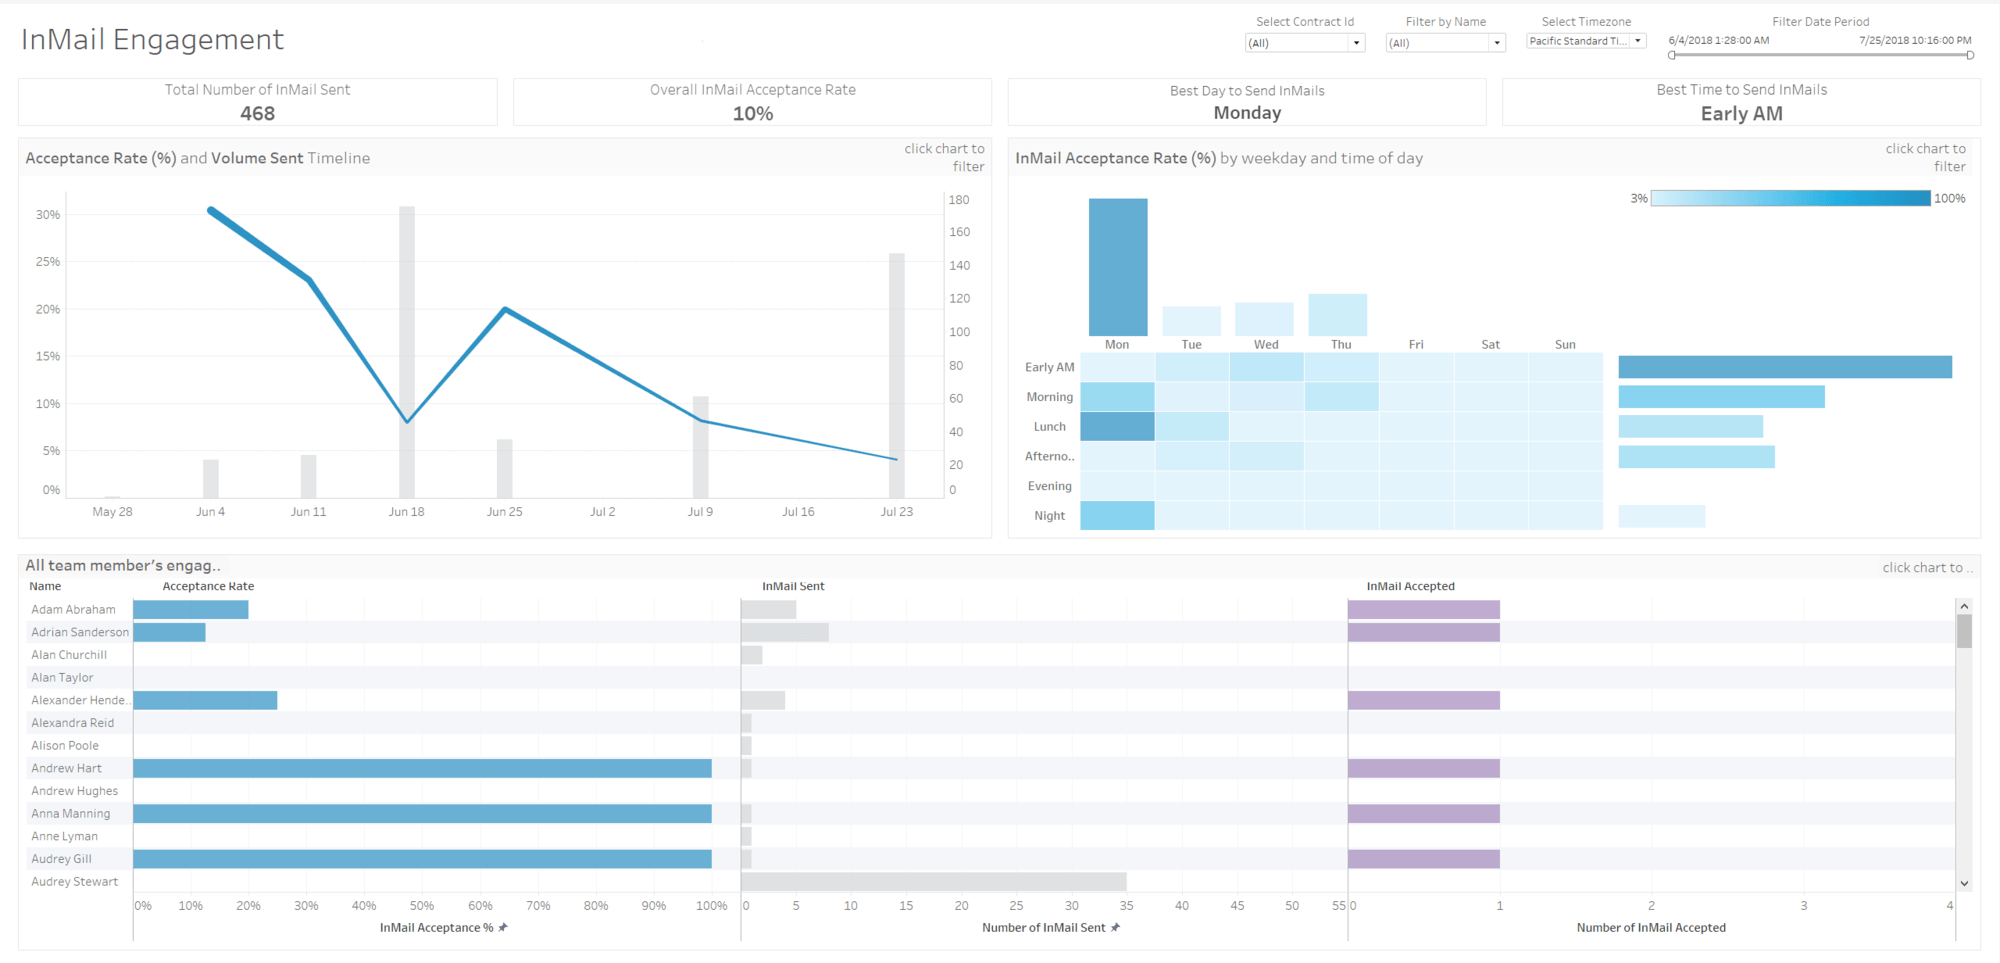
LinkedIn Sales Navigator connector
Gain deeper insights from your Sales Navigator Application Platform (SNAP) data. Connect to and analyze your SNAP data in Tableau, enabling your Sales Operations users to merge, analyze, and visualize social selling data alongside their other sales performance reports.
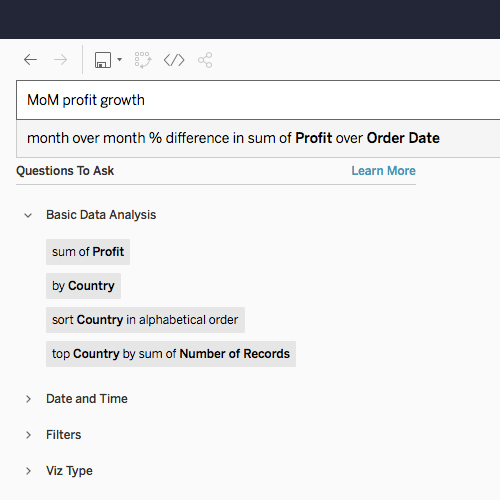
Ask Data improvements
We’re making it easier for you to enable more curated experiences for Ask Data. Admins now have the flexibility to enable or disable Ask Data as the default site setting, helping ensure users are only using Ask Data on a subset of curated data sources. Quickly share Ask Data insights with your team by sending a link, without having to save content to the server. And finally, calculating year-over-year metrics is as simple as typing “YoY profit growth”, helping you quickly answer critical questions of your data.

Level AA accessibility compatibility
With our new Level AA accessibility compliance, we're improving the ability to interact with a viz in view mode on Tableau Online and Tableau Server using common accessibility tools.
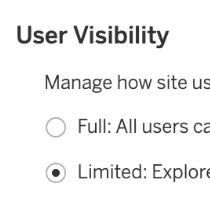
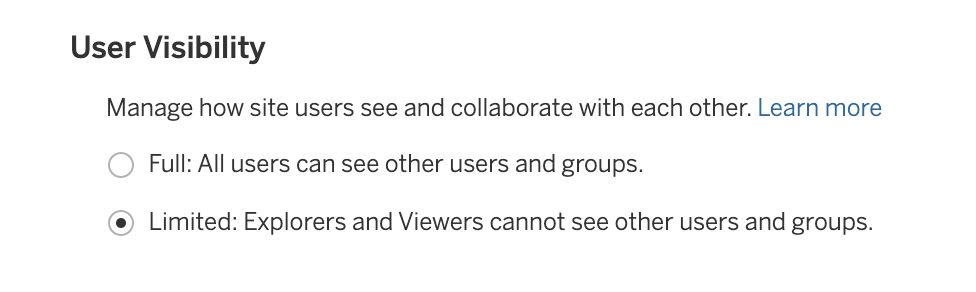
Control user visibility at the site level
With the User Visibility site control, you can limit user-to-user visibility, allowing you to share a single site's content with multiple clients, suppliers, and partners.
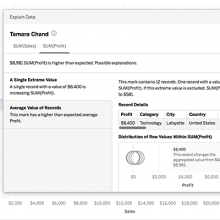
Explain Data improvements
With Tableau 2019.4 Explain Data now supports unvisualized measures and calculated fields, allowing you to inspect your data in more situations.
Webhooks support
Sandboxed extensions
We've made extensions more flexible. Now developers can now create sandboxed extensions, which disables network calls - streamlining the development process from a security standpoint.
Personal Access Tokens
Personal Access Tokens (PAT) provide individual users the ability to create long-lived authentication tokens for running automation and tools against Tableau REST APIs without requiring hard-coded account credentials in plain text or an interactive login experience.
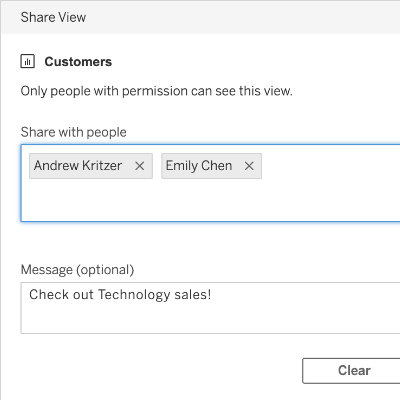
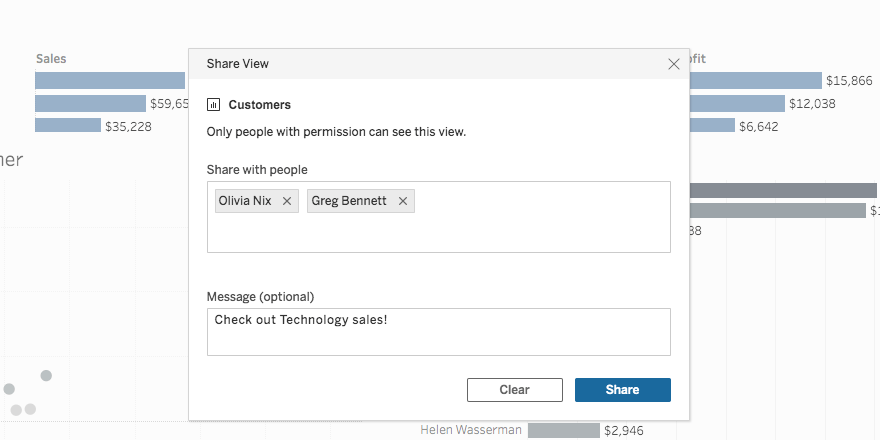
Sharing improvements
When sharing a dashboard or view that been modified (through selections, filters, zooming, panning), sharing will automatically generate a link that includes these interactions. Simply enter in the names of any named users on the site to send them an email with the dashboard or view image and an optional note.
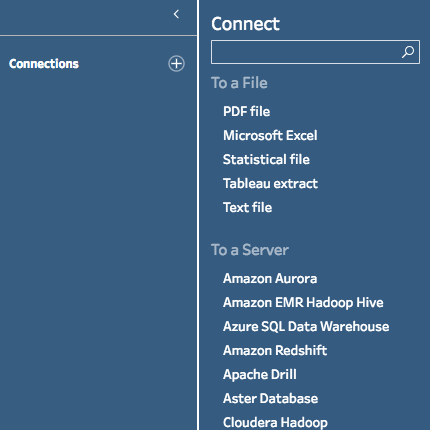
Cloud file connectors for Tableau Prep
Start prepping your cloud-based files from Box, Dropbox, OneDrive, or Google Drive in Tableau Prep Builder, then publish them up to Tableau Prep Conductor.
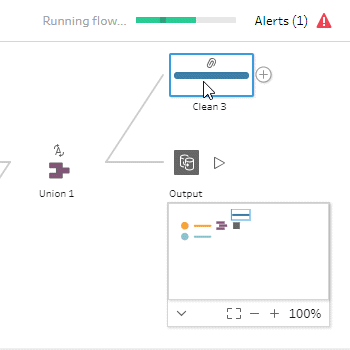
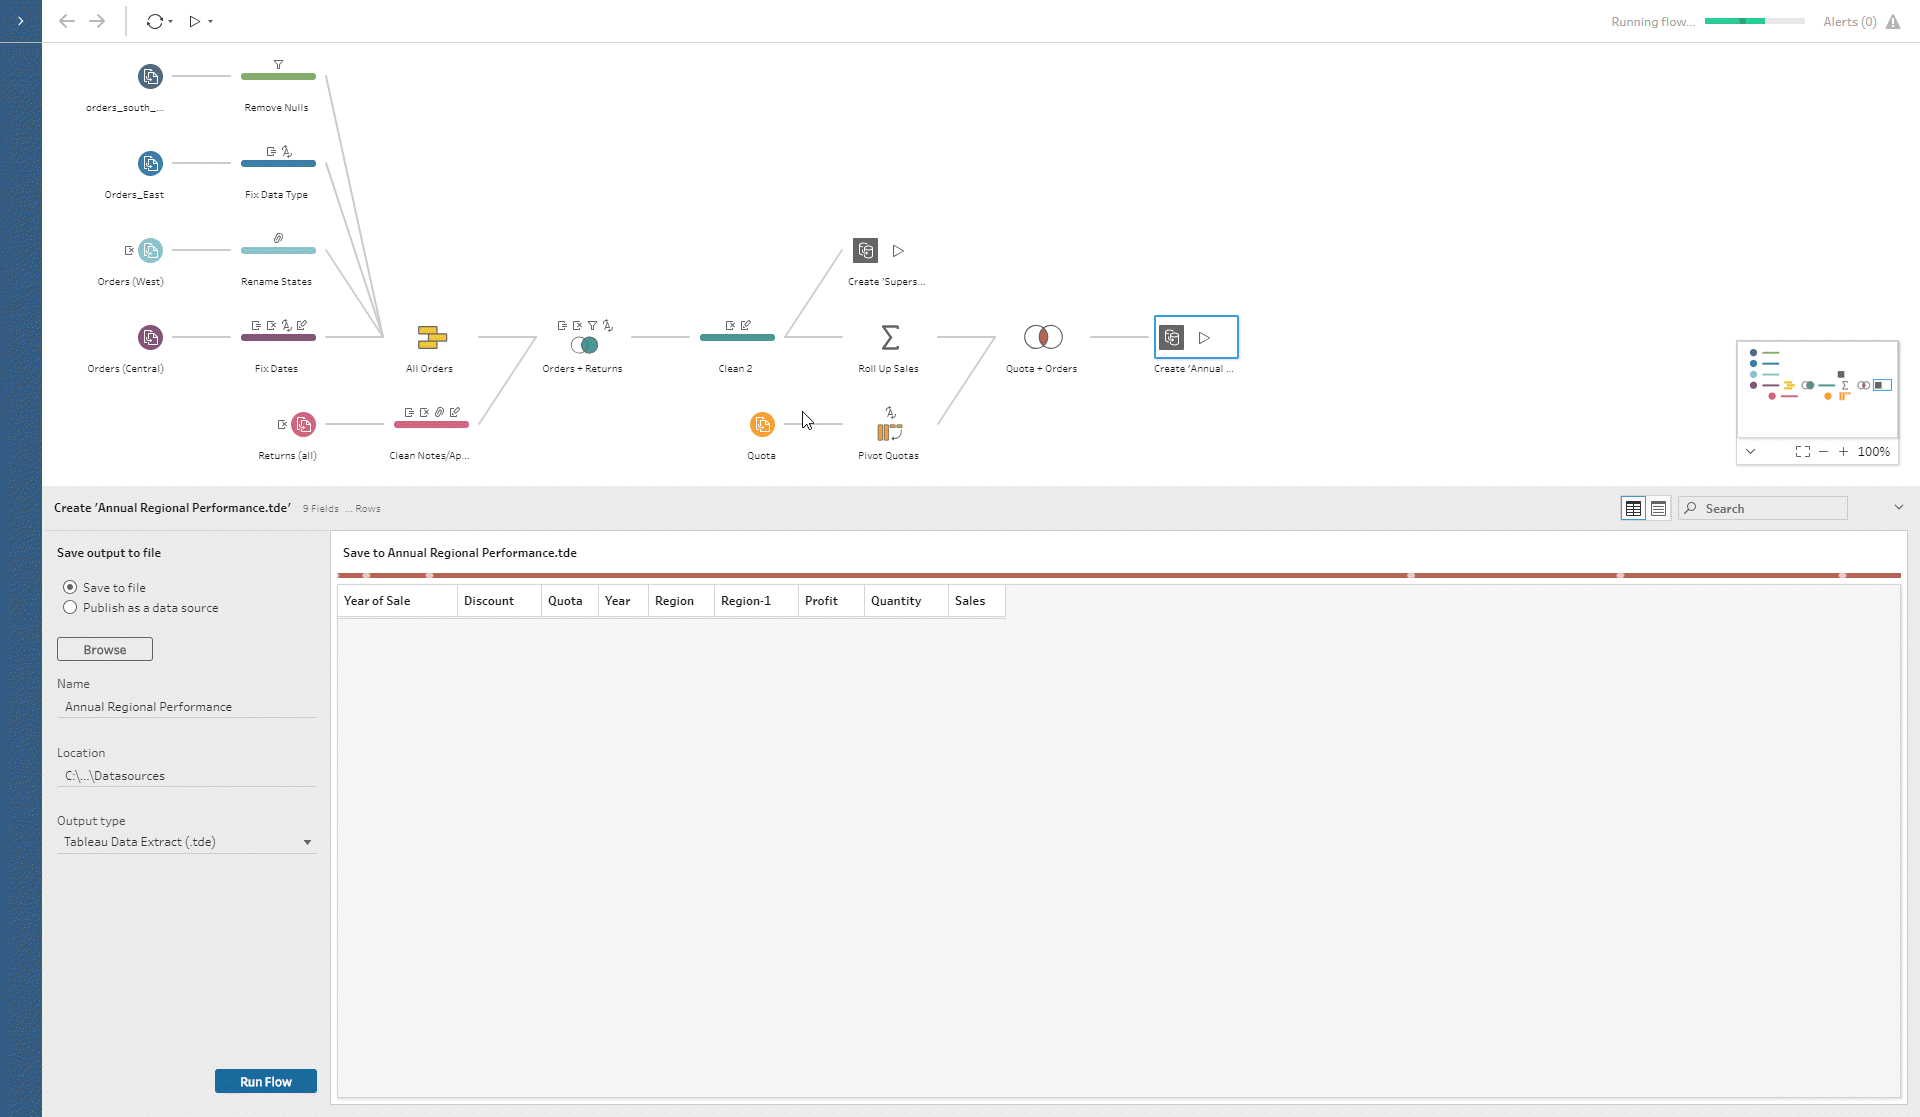
Progress Indicator
Always know the state of your flow. With a progress indicator you'll know what's happening with the flow and how much of the data the flow has left to process.
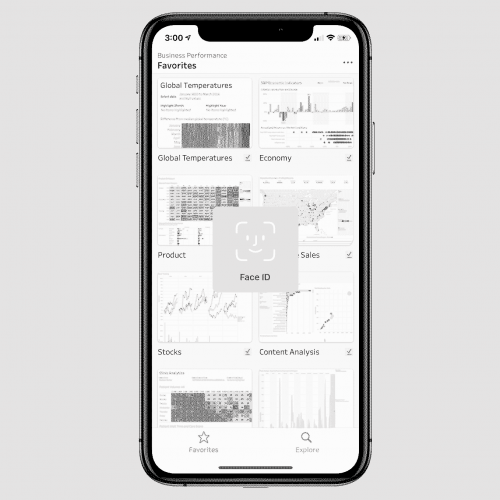
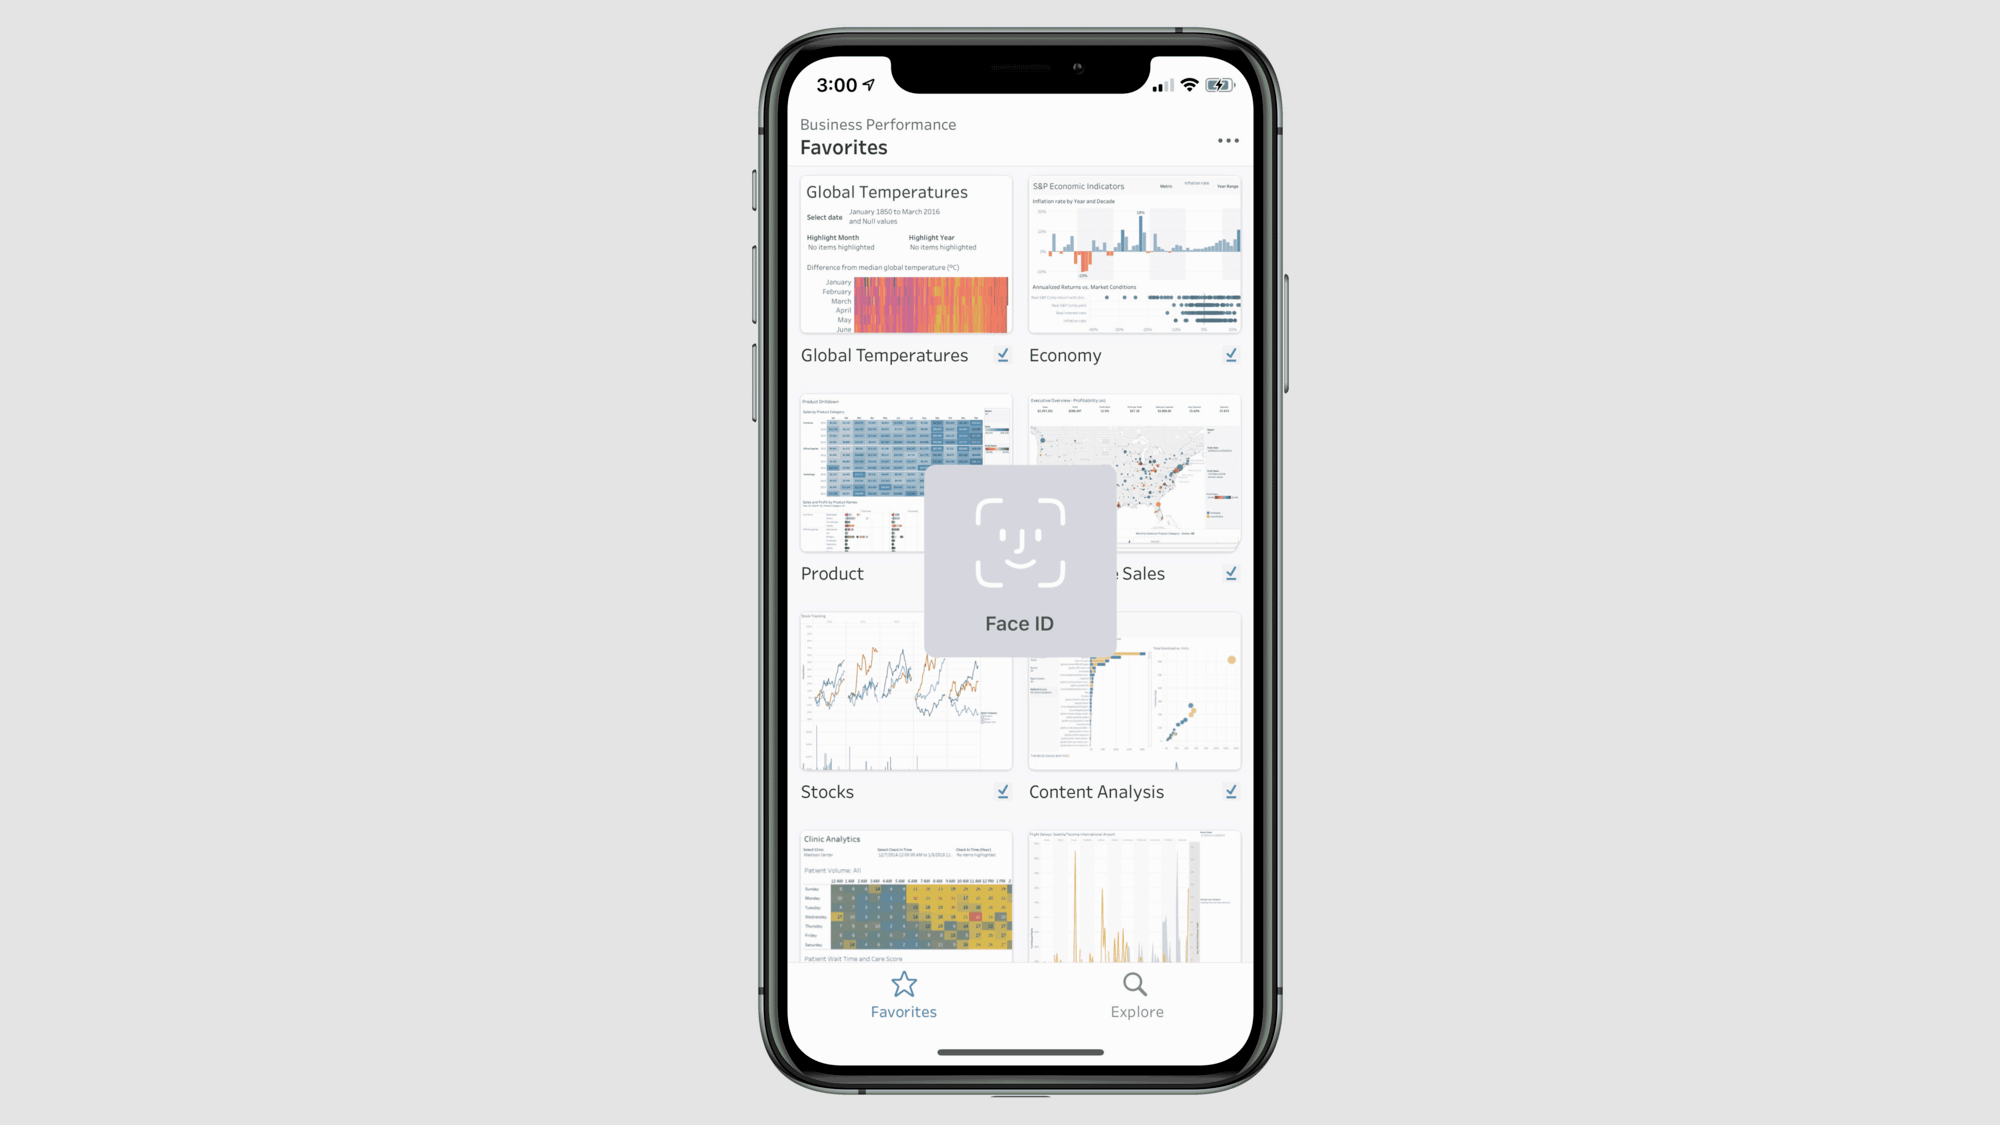
App lock using biometrics
Use biometrics or device passcode with long-lived OAuth tokens for an additional layer of security. Sign in once, and then rely on biometrics or device passcode to unlock the app.
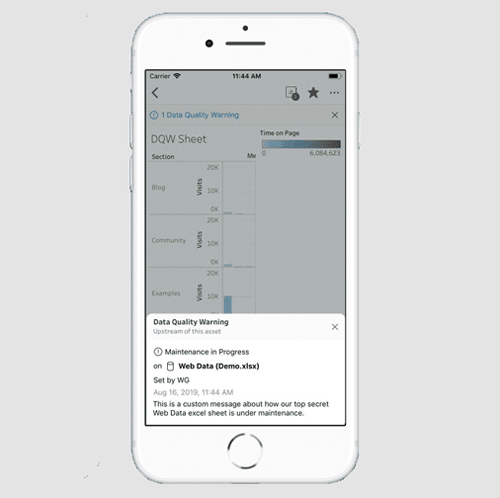
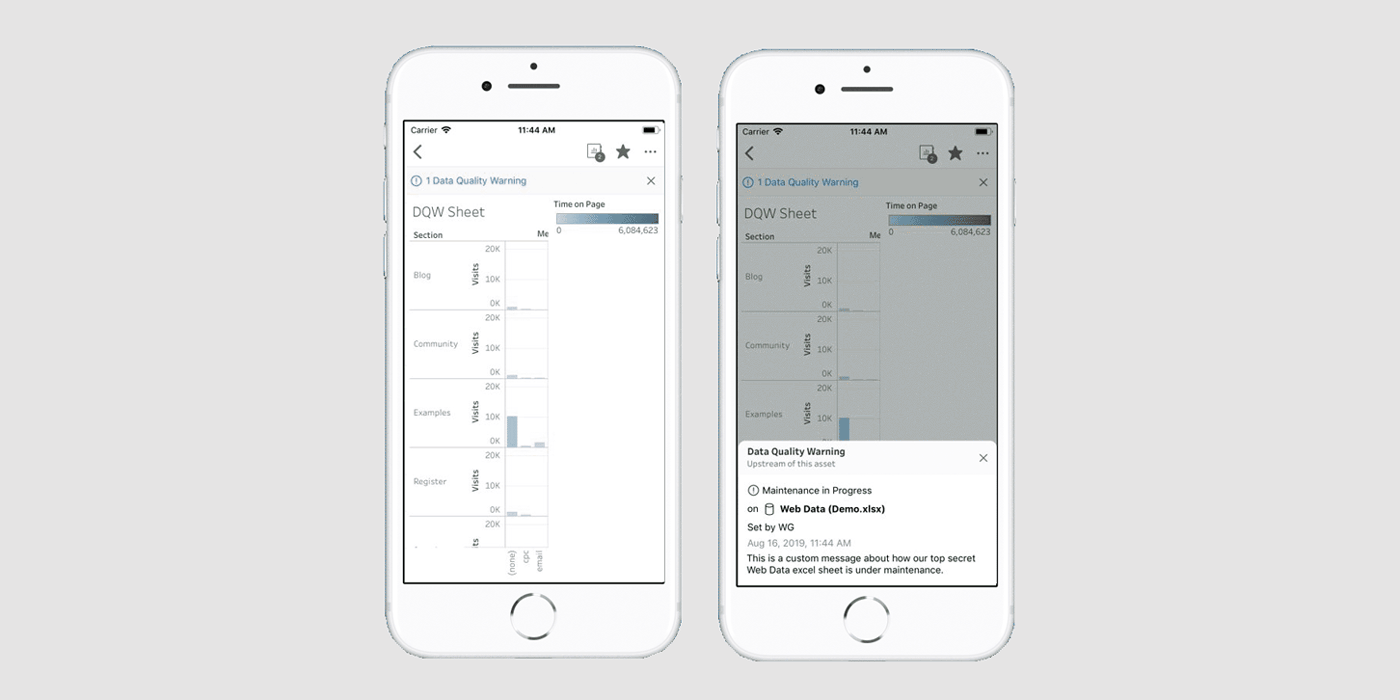
Data quality warnings for Tableau Mobile
Stay on top of the quality of your data that fuels your dashboards, no matter where you are. You can see data quality warnings right from Tableau Mobile (Data Management Add-on required).