
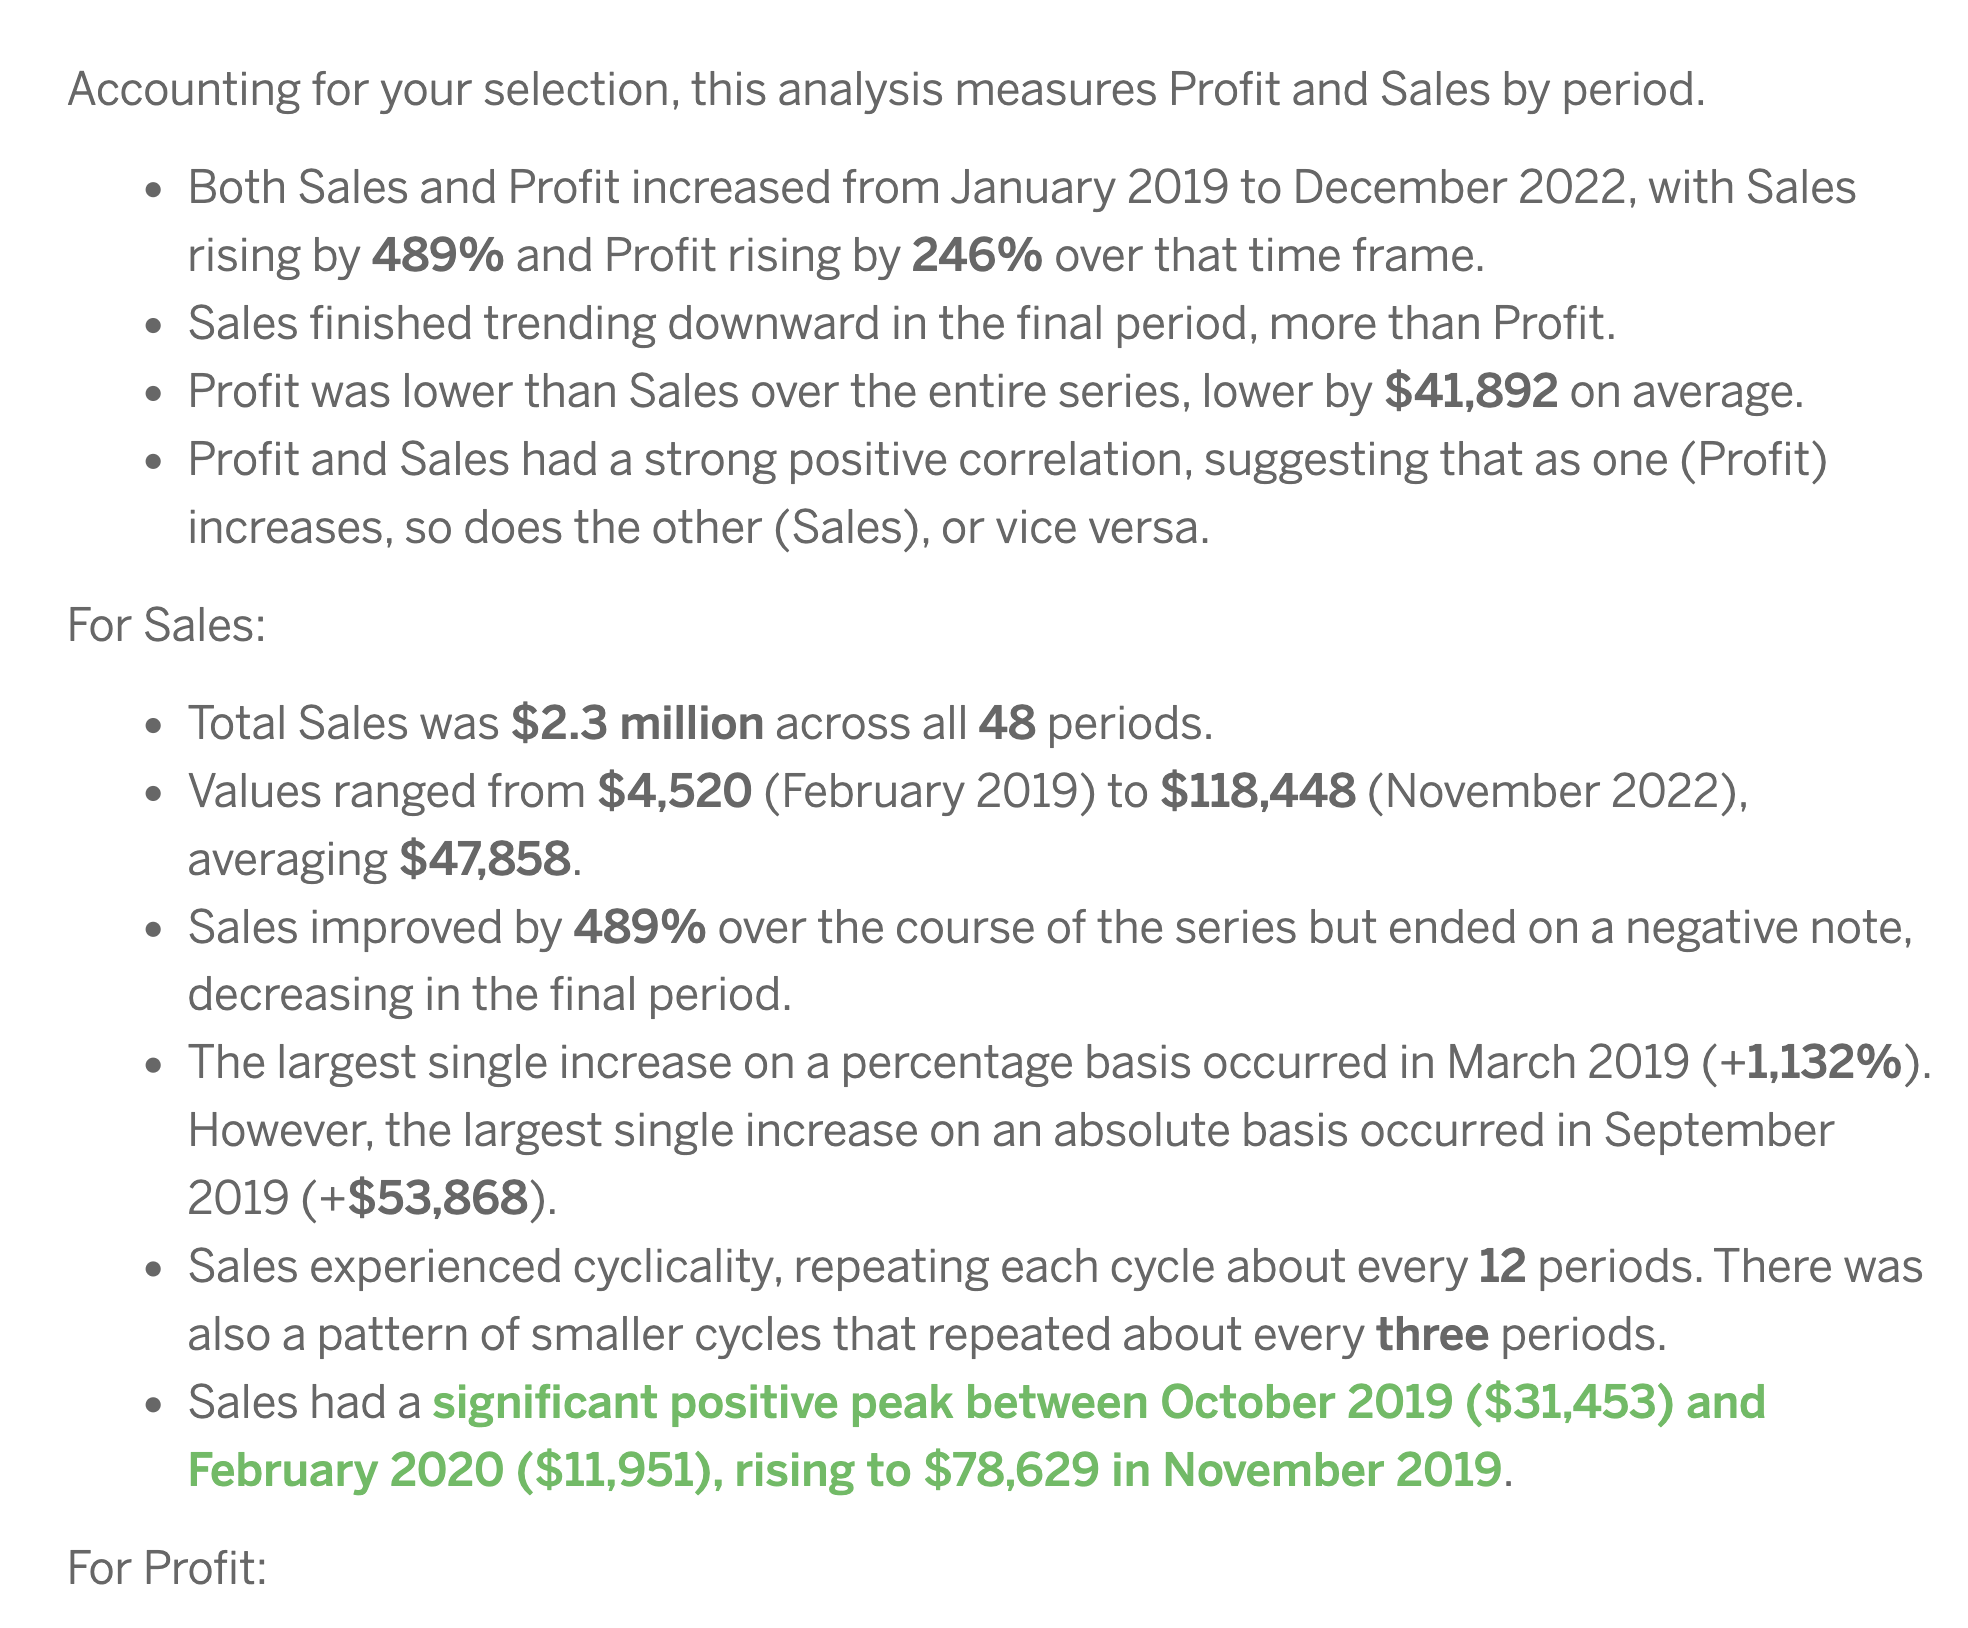
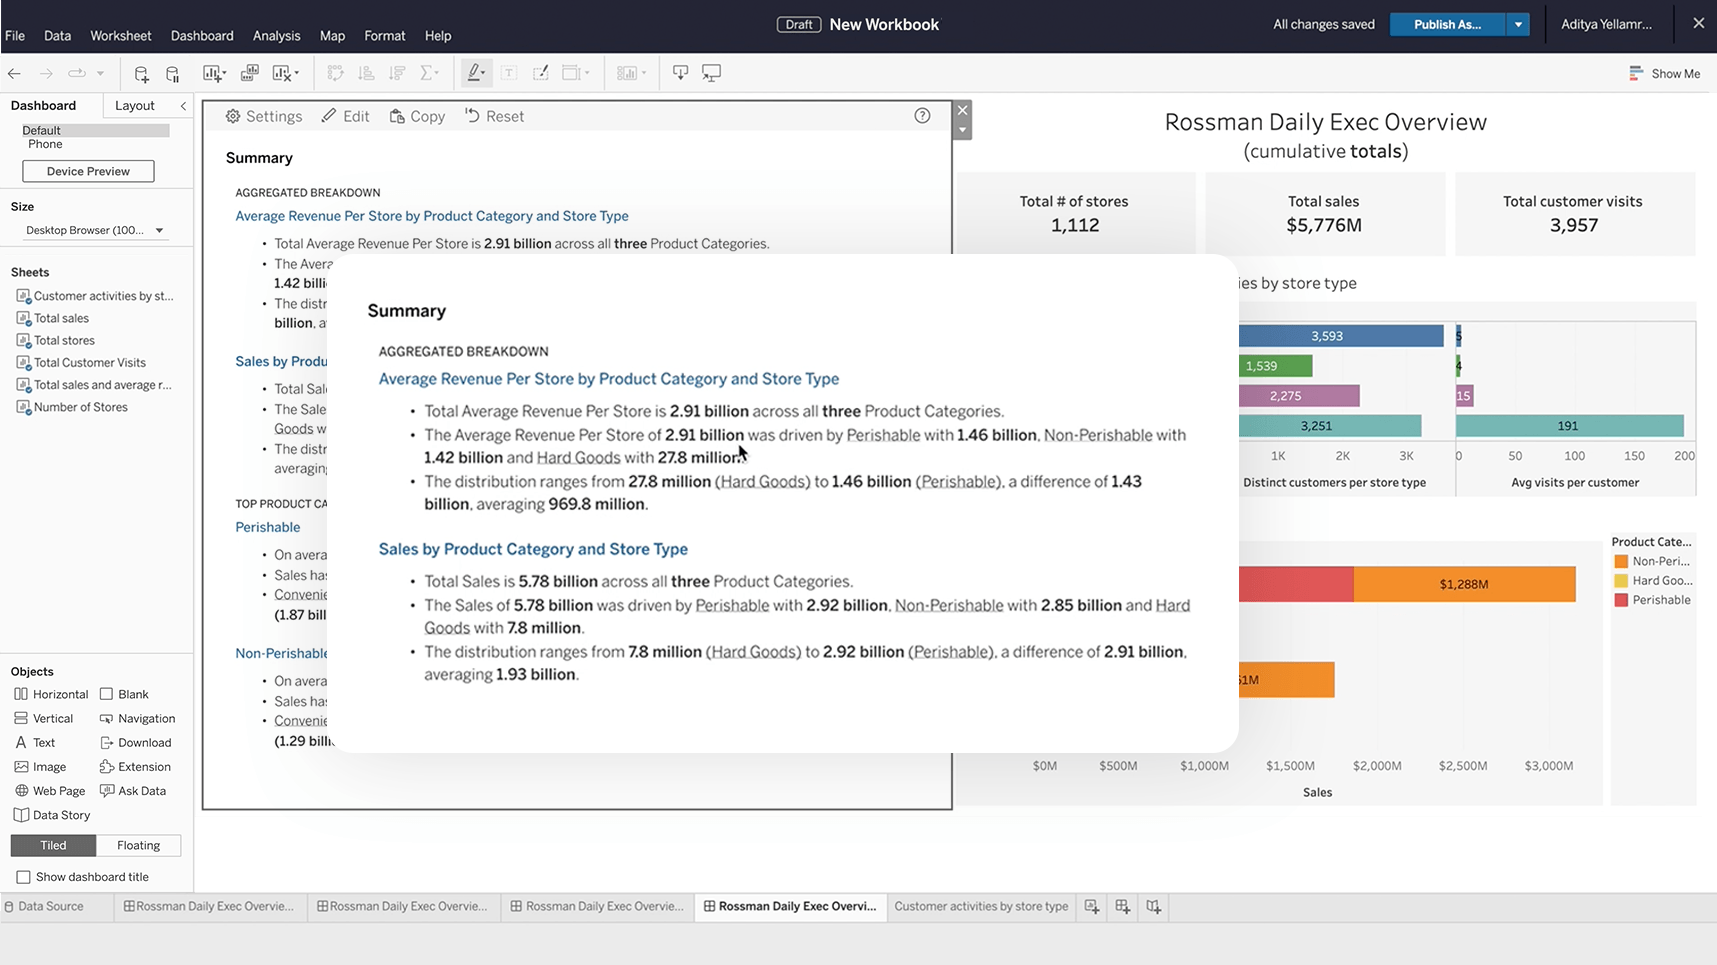
Data Stories
Help any user to confidently access, understand, and communicate with data. Data Stories automate the analysis, build, and communication of insights with plain-language explanations that are easy to read and understand. Data Stories are also fully customizable, so you can tailor the stories based on your audience. Choose which analyses are included, change the confidence interval, rename fields, apply colors to denote positive or negative changes, and more.
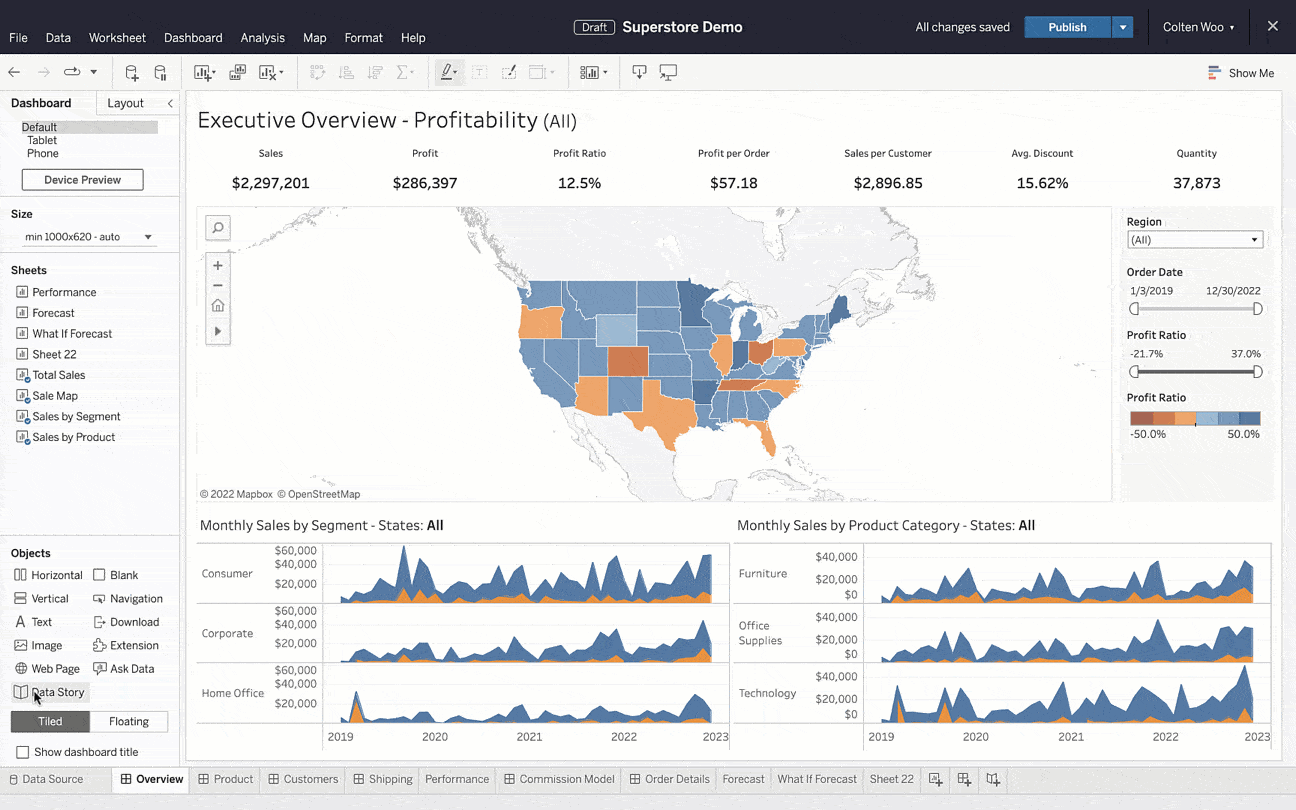
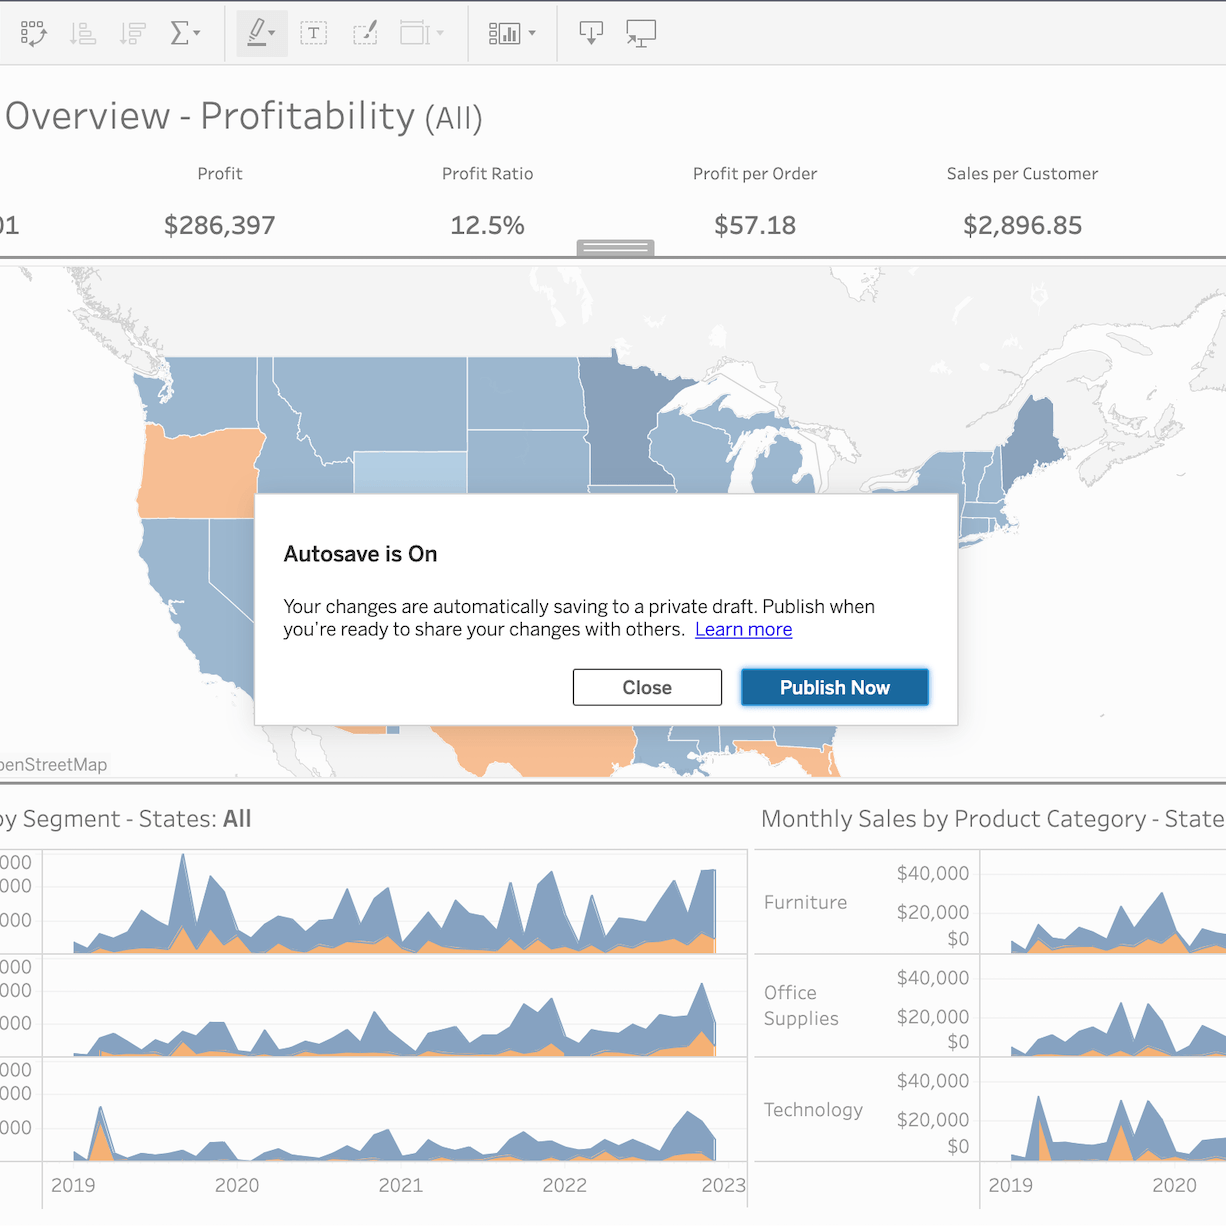
Autosave in the browser
Trust your work won’t be lost. With autosave, you can stay in the flow of analysis and resume work exactly where you left off, every time. As you make edits, they are automatically stored in an unpublished draft on the server. Once finished, you can publish the draft to commit your changes so you don't break things or share changes with other workbook users prematurely.
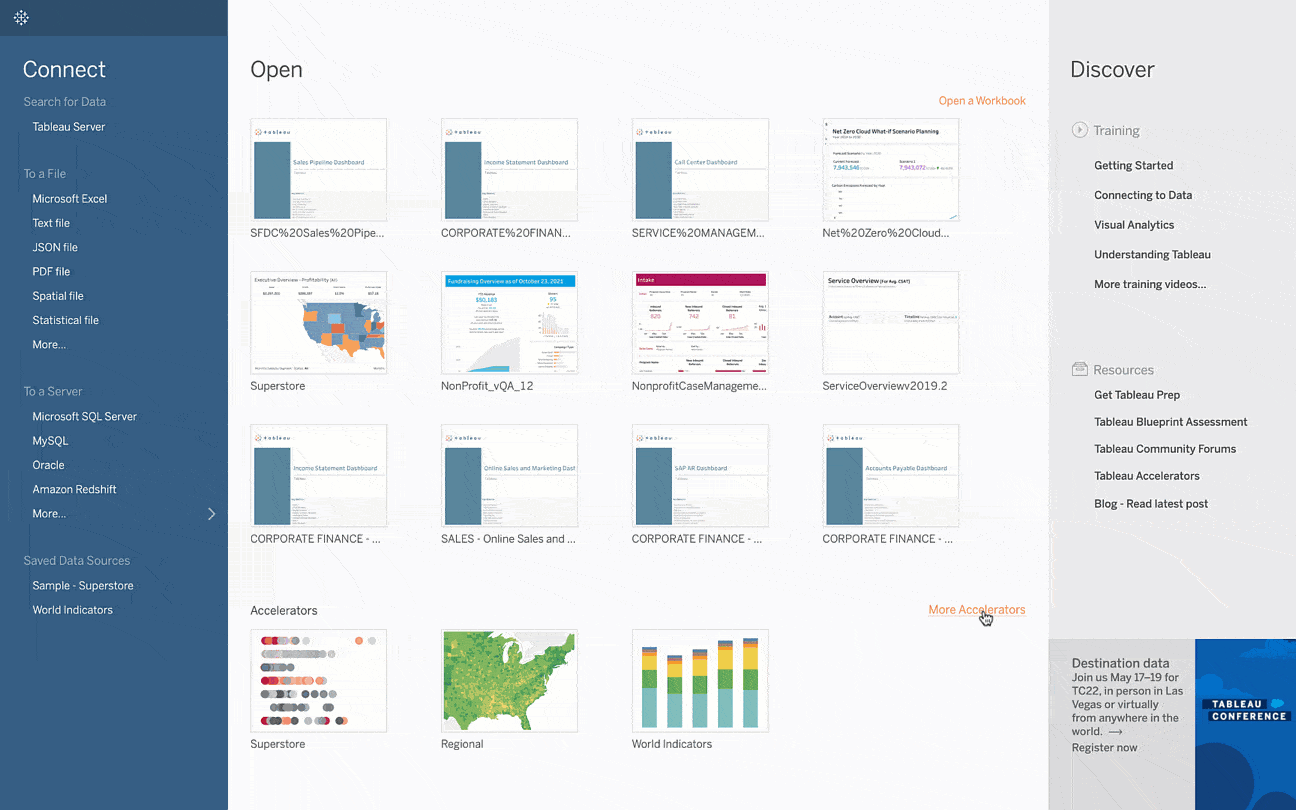
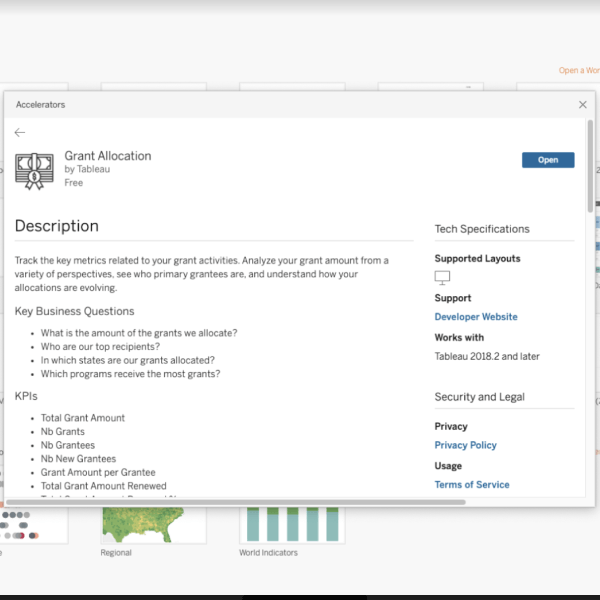
In-product Exchange
It is now even easier to leverage trusted offerings from the Tableau Exchange right where you work in Tableau. Dashboard Extensions and Tableau Accelerators from the Tableau Exchange are accessible directly in Tableau Desktop as part of the core authoring experience. Jumpstart your analysis with powerful, expert-built offerings.
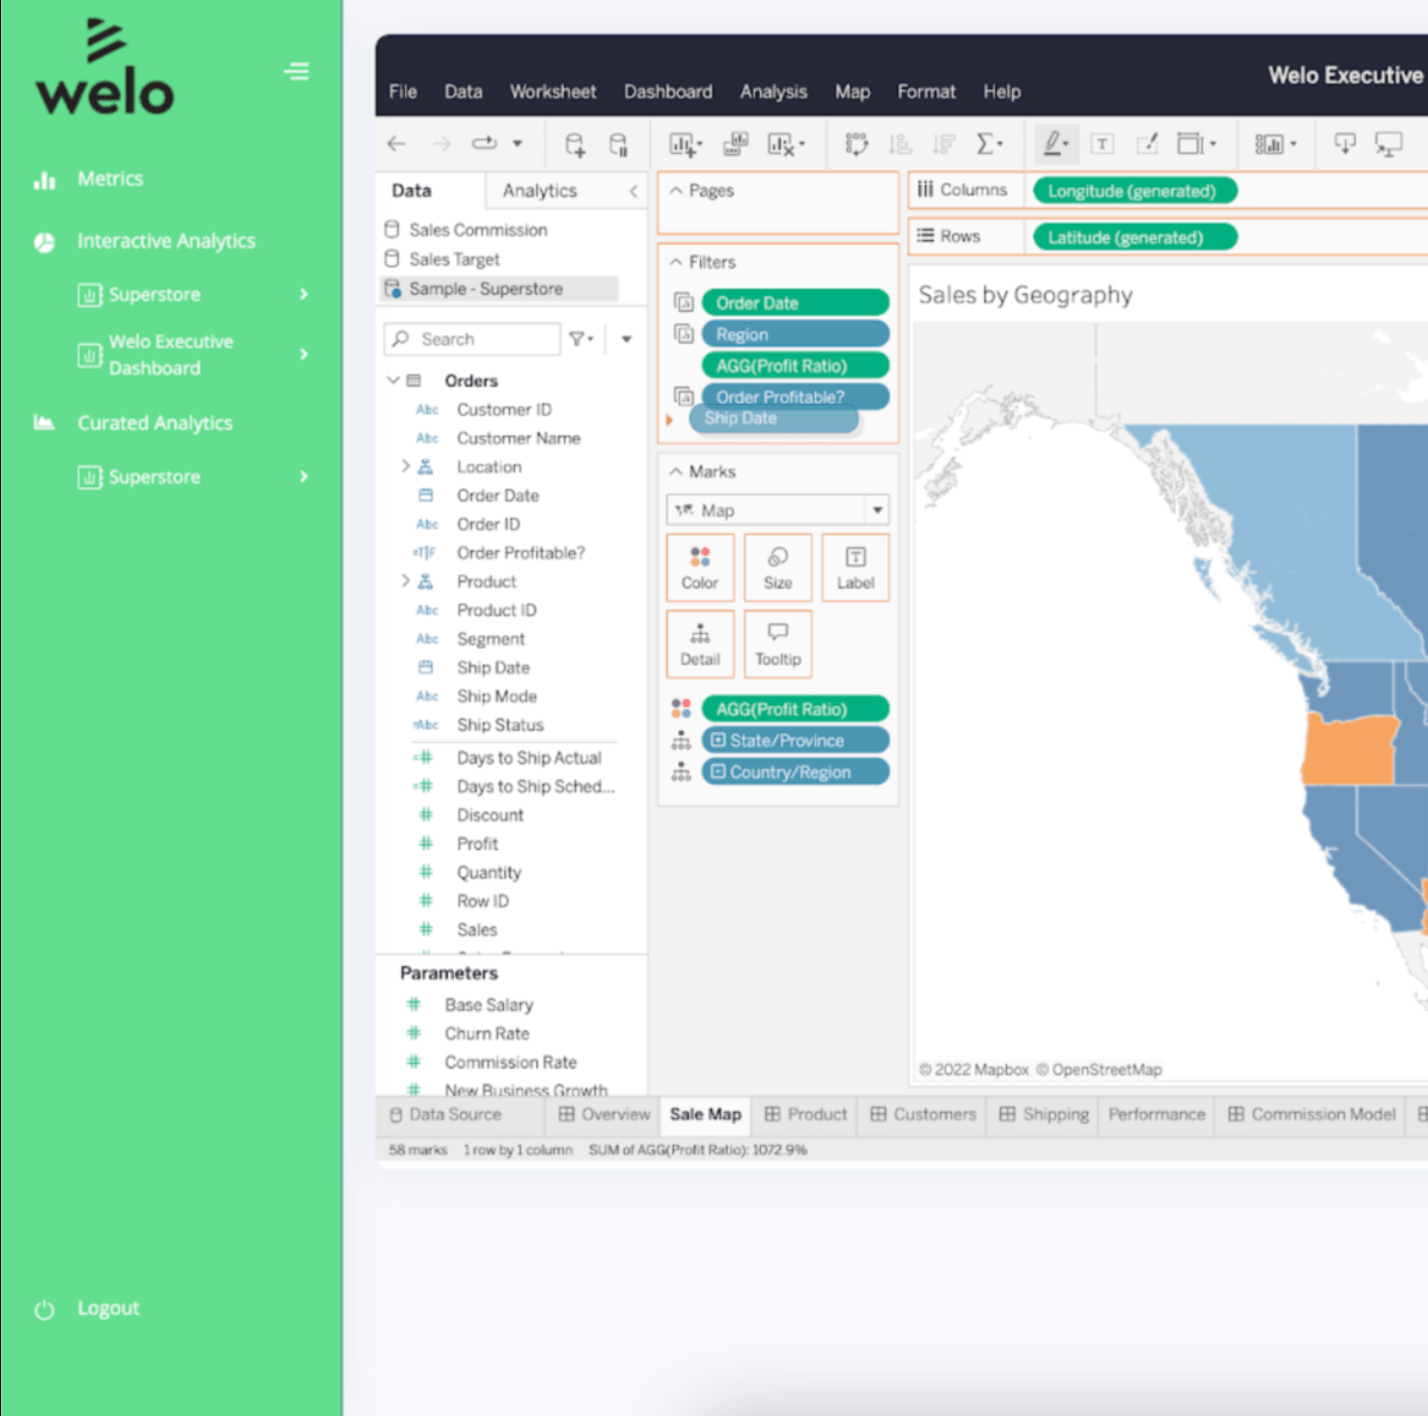
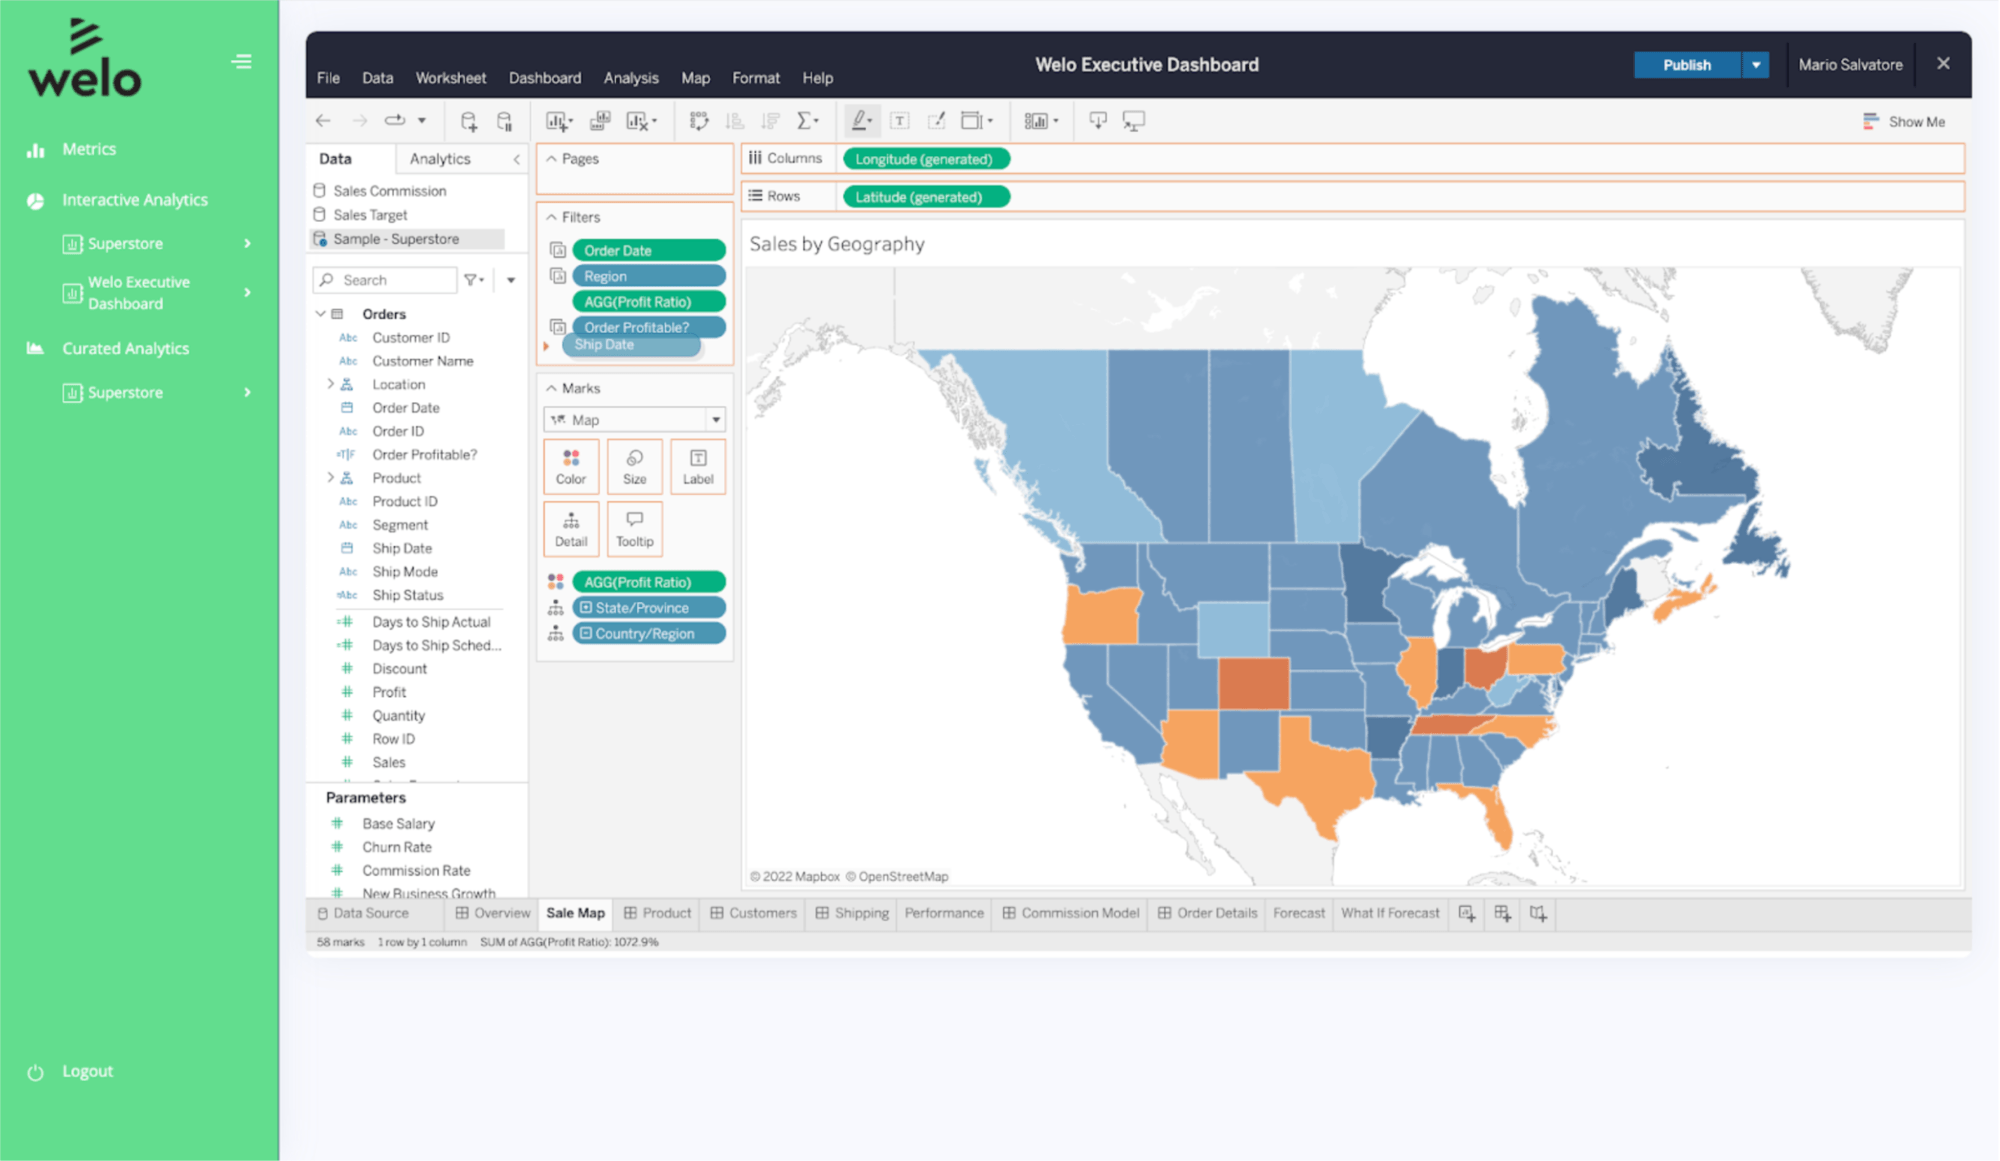
Advanced Management for Tableau Cloud
Advanced Management for Tableau Cloud makes it simple to manage, secure, and scale mission-critical Tableau Cloud deployments. We're enhancing the administrative experience while ensuring end users have access to relevant data so they can make data-backed decisions. Advanced Management for Tableau Cloud provides new operational insight features, enterprise encryption capabilities, additional site capacity, and the Tableau Content Migration Tool.
Tableau 2022.2 Feature Overview
Tune in for an overview to hear about the latest features from 2022 Tableau Visionary, Anya Prosvetova. She will walk you through the new features included in this release.
Watch nowExplore latest features and Tableau Accelerators
All Features
2022.2
Data Stories
Help any user to confidently access, understand, and communicate with data. Data Stories automate the analysis, build, and communication of insights, but are fully customizable, so you can tailor the stories based on your audience. Choose which analyses are included, change the confidence interval, rename fields, apply colors to denote positive or negative changes, and more.
Autosave
Trust your work won’t be lost. Autosave lets you edit an existing workbook in a draft until you’re ready to publish so you won't lose your changes or share them prematurely with other workbook users.
In-product Exchange
It is now even easier to leverage trusted offerings from the Tableau Exchange right where you work in Tableau. Dashboard Extensions and Tableau Accelerators from the Tableau Exchange are accessible directly in Tableau Desktop as part of the core authoring experience.
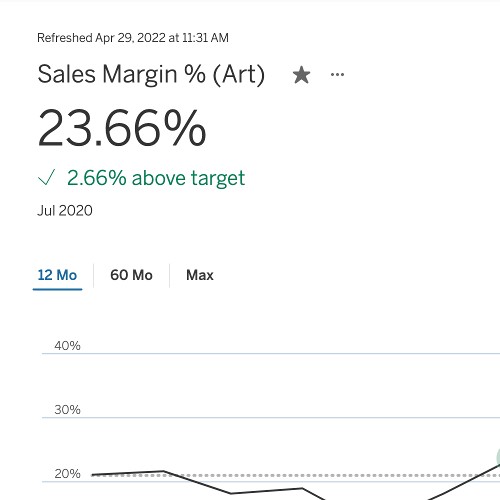
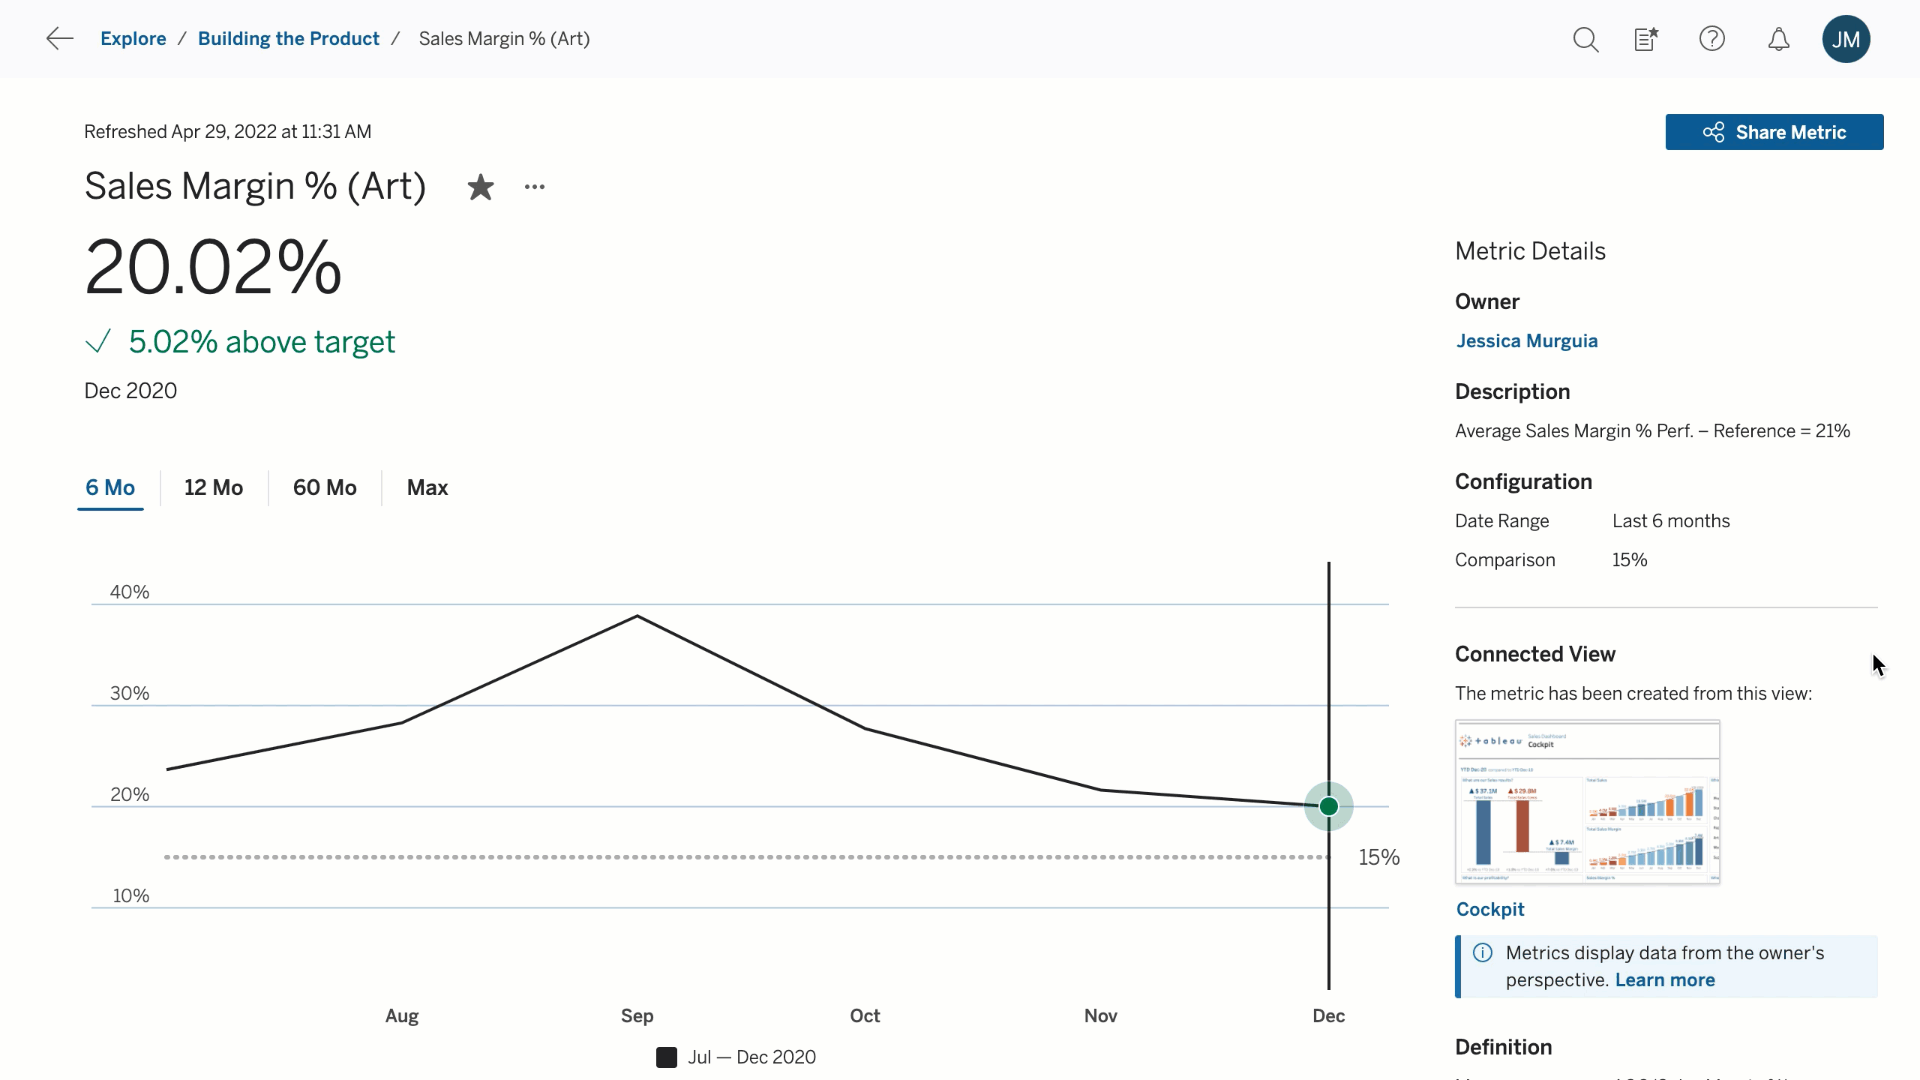
Metrics improvements
Create metrics to track key data points without having to access your dashboards and edit them at any time. You can now come back and edit existing metrics to change the historical comparison period, the date range used by the metric, and the status indicators. Additionally, you can dynamically explore different date windows while analyzing the metric without editing the configuration.
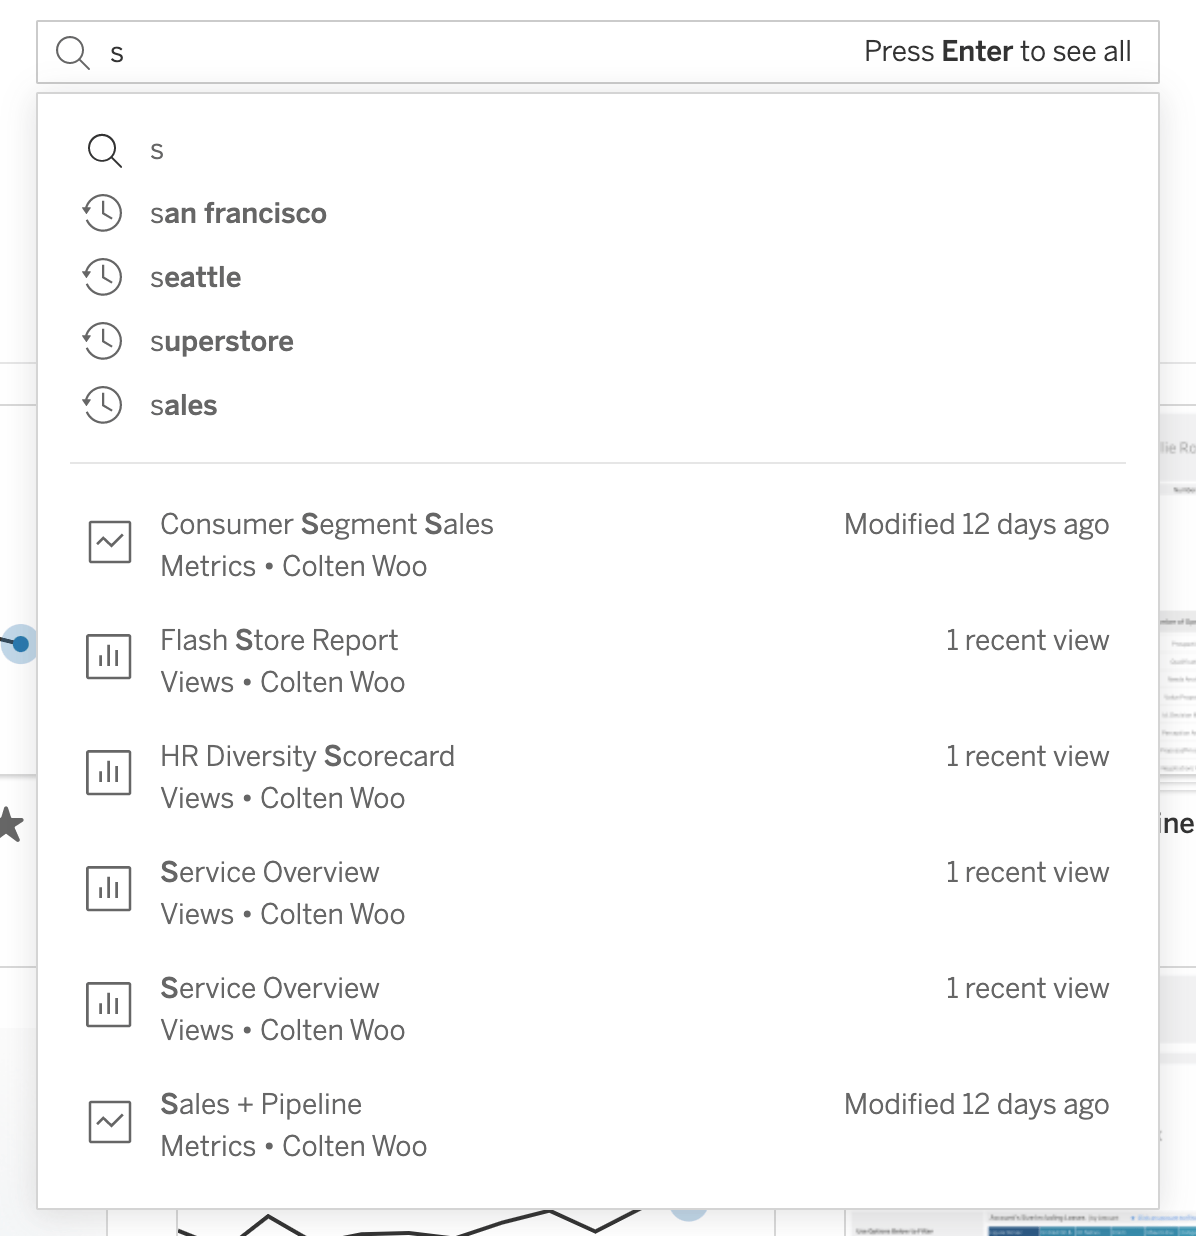
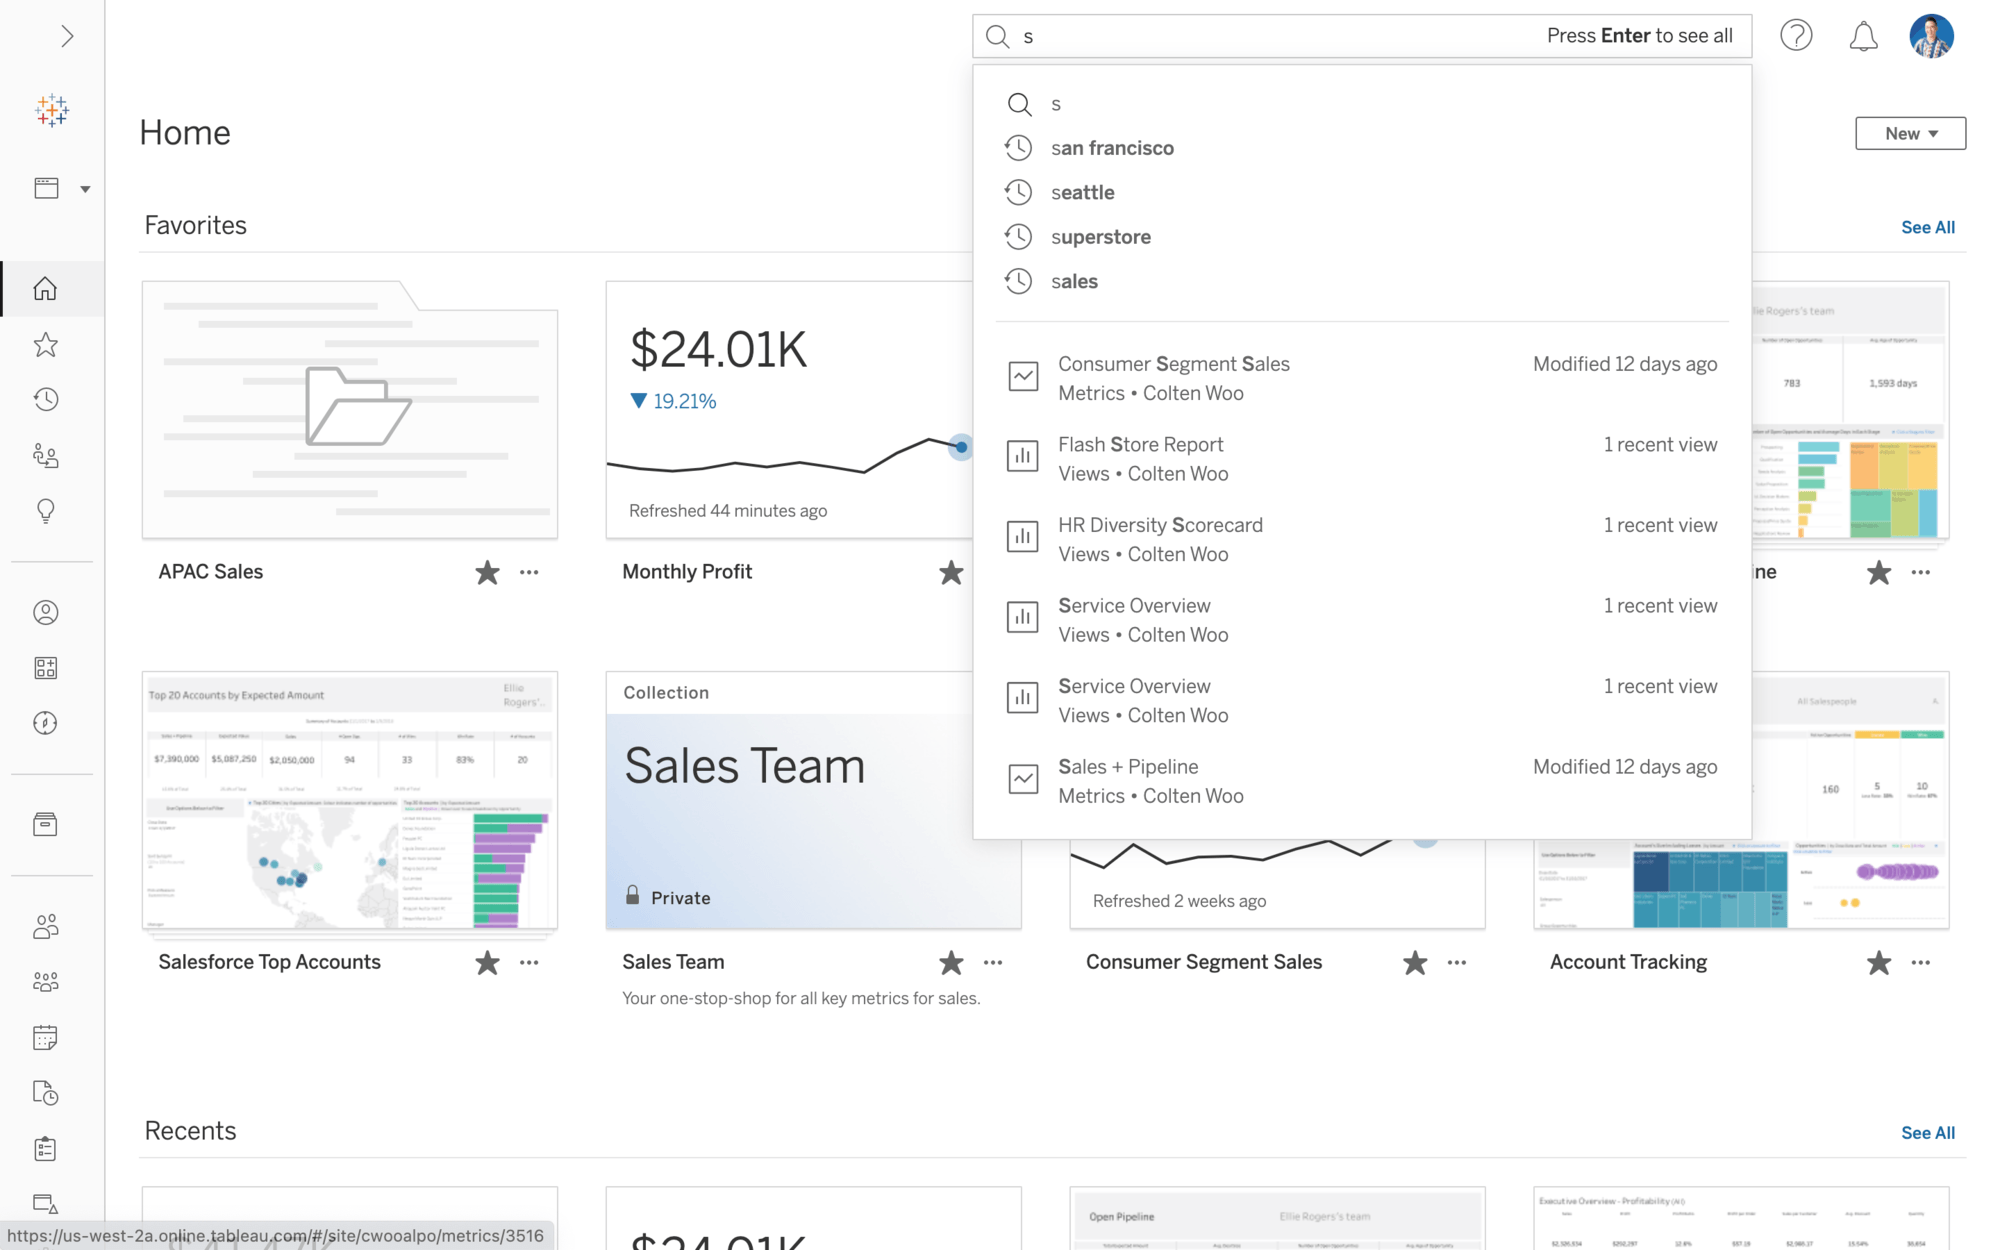
Improved Quick Search
Navigate to relevant content faster and more intelligently in Tableau Cloud. The reimagined Quick Search includes a new suggested content algorithm, a streamlined design, and past searches a click away to save time and speed up your time to insight.
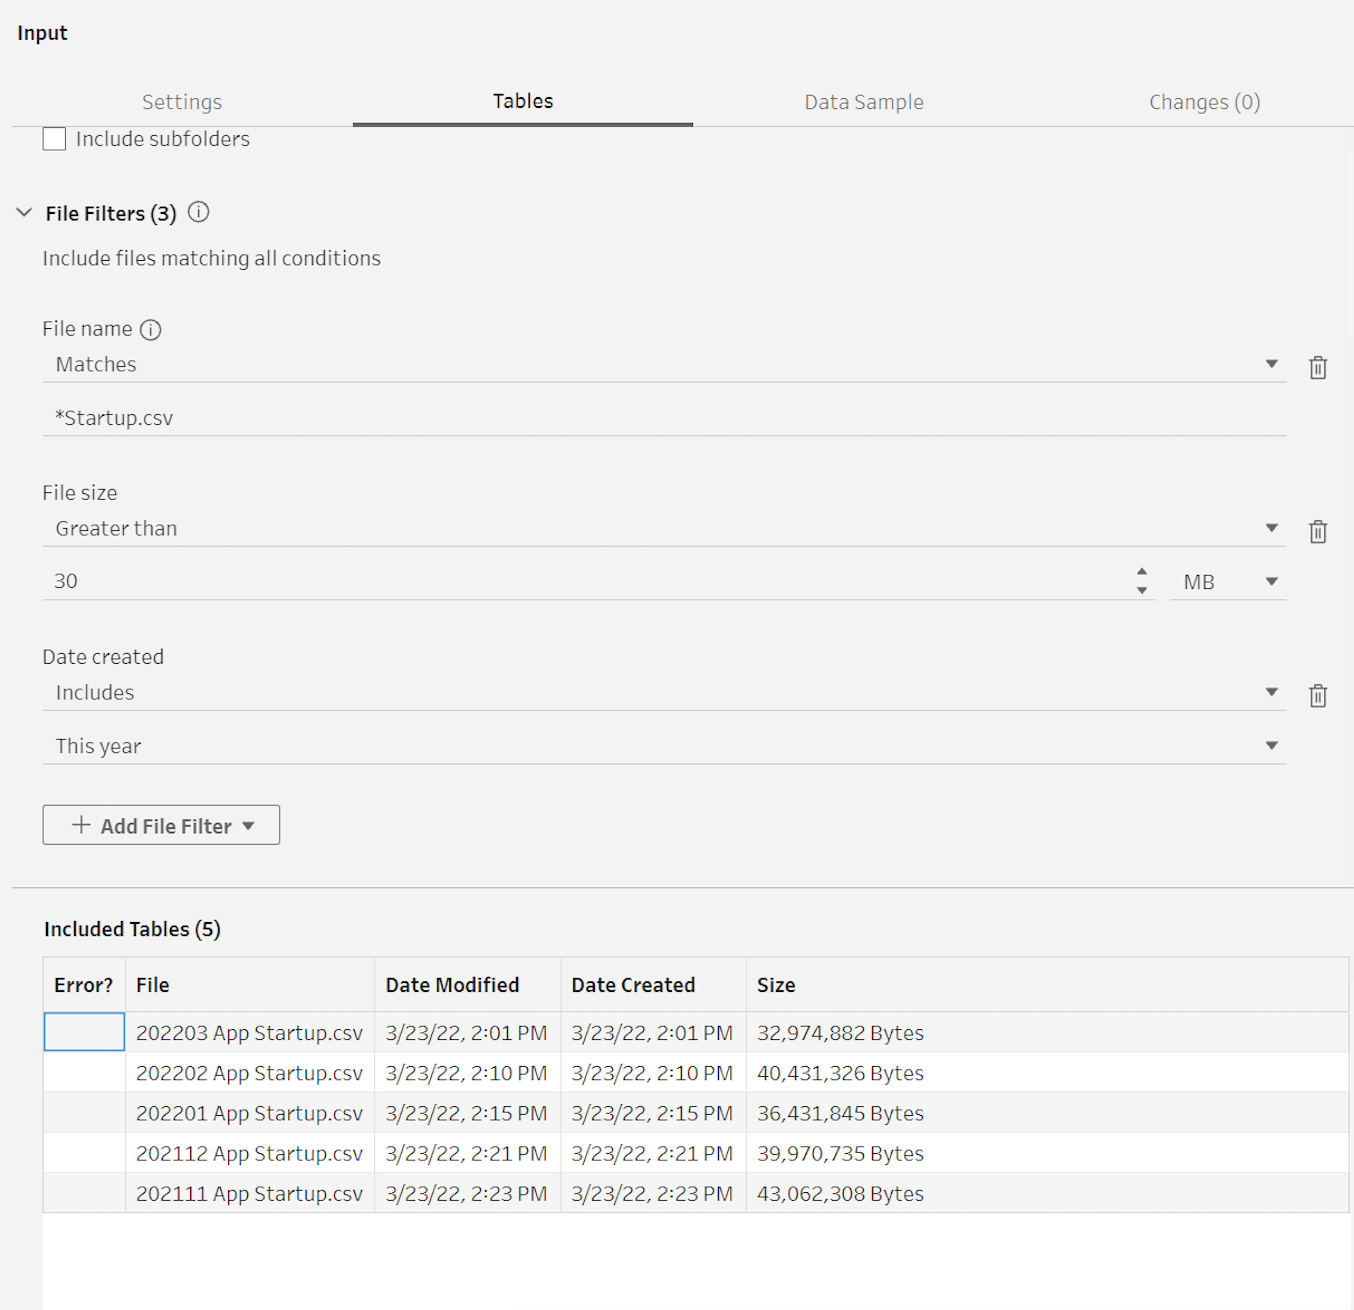
Wildcard Union enhancements in Prep
Select a subset of files from a directory based on a new set of attributes within Tableau Prep. These attributes include file name, creation time, last modified time, last access time and size.

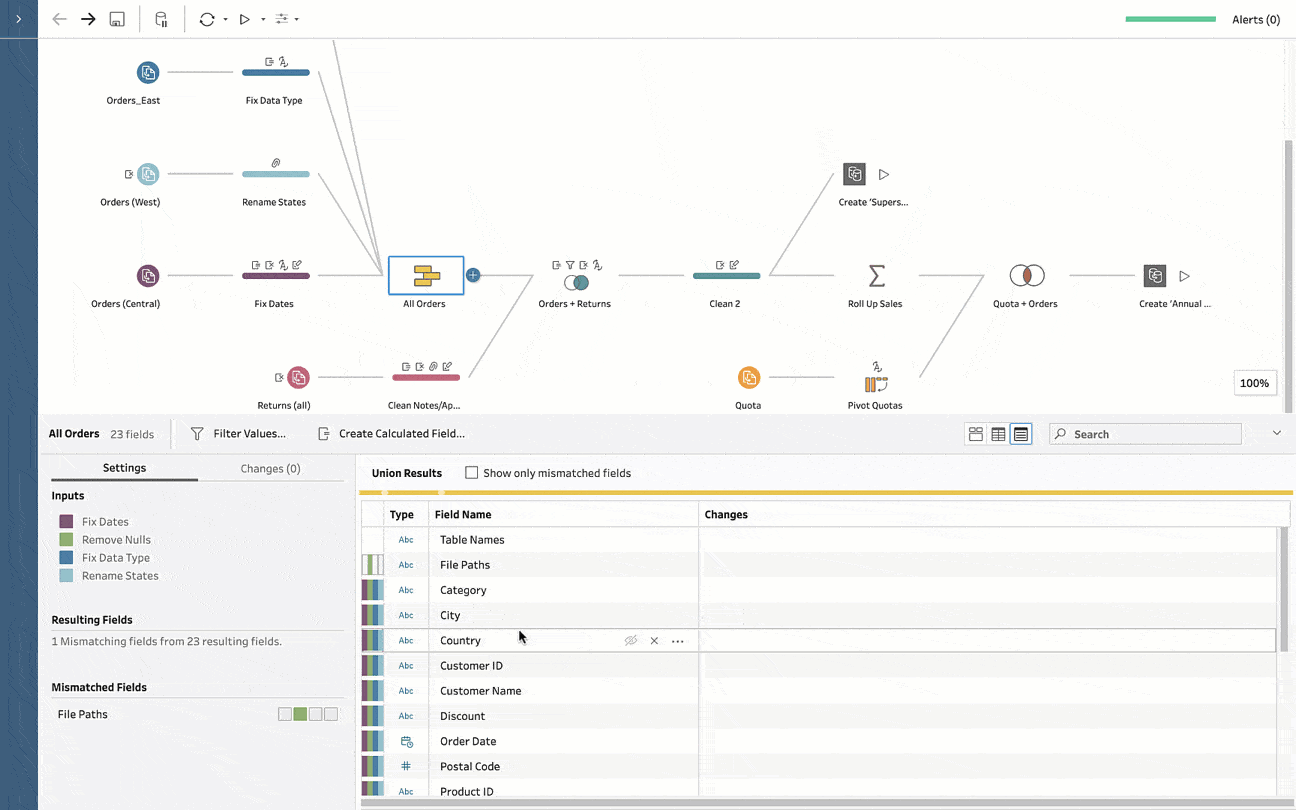
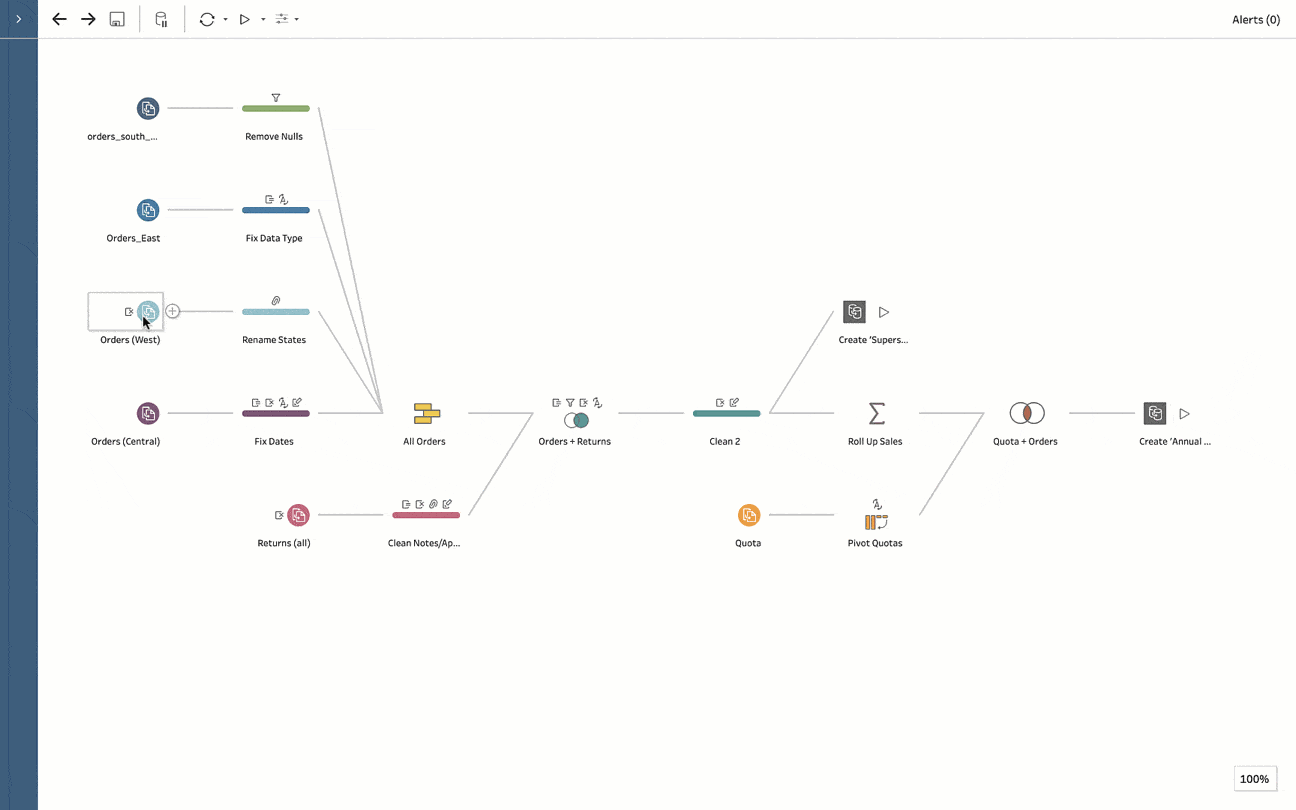
Column reordering enhancements for Prep
When working with really large tables in Tableau Prep, instead of manually dragging and dropping each column in the profile pane, users can now drag-and-drop to sort data columns in the field list view. Once the user has specified their column order, the order is maintained across the entire flow and the final output after the flow is run.
Embedded Web Authoring
Embedding API v3.2 now allows you to bring Tableau’s best in-class authoring experience directly into any application and customize your user experience. Now, users can edit a visualization and add new data sources directly from any application or web portal, allowing them to ask questions and make data-driven decisions in their flow of work.

Embedding API v3.2
Embedding API v3.2 enables more of the functionalities developers use in the Javascript API v2 while adding new features.
This update to the Embedding API will add:
-
The ability to create custom menus, add menu items, and pass marks the user selects in a view
-
Embedded Web Authoring
-
Additional support for Tableau events and filtering
-
Support for Tableau parameters and view export
-
And much more
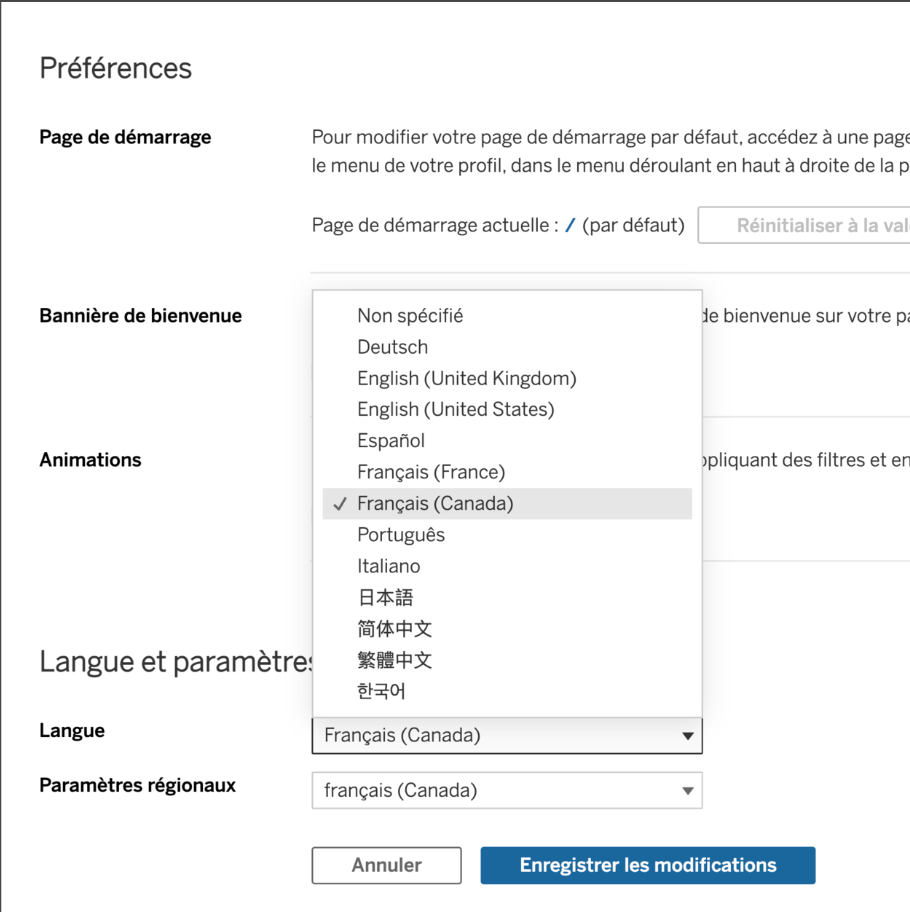
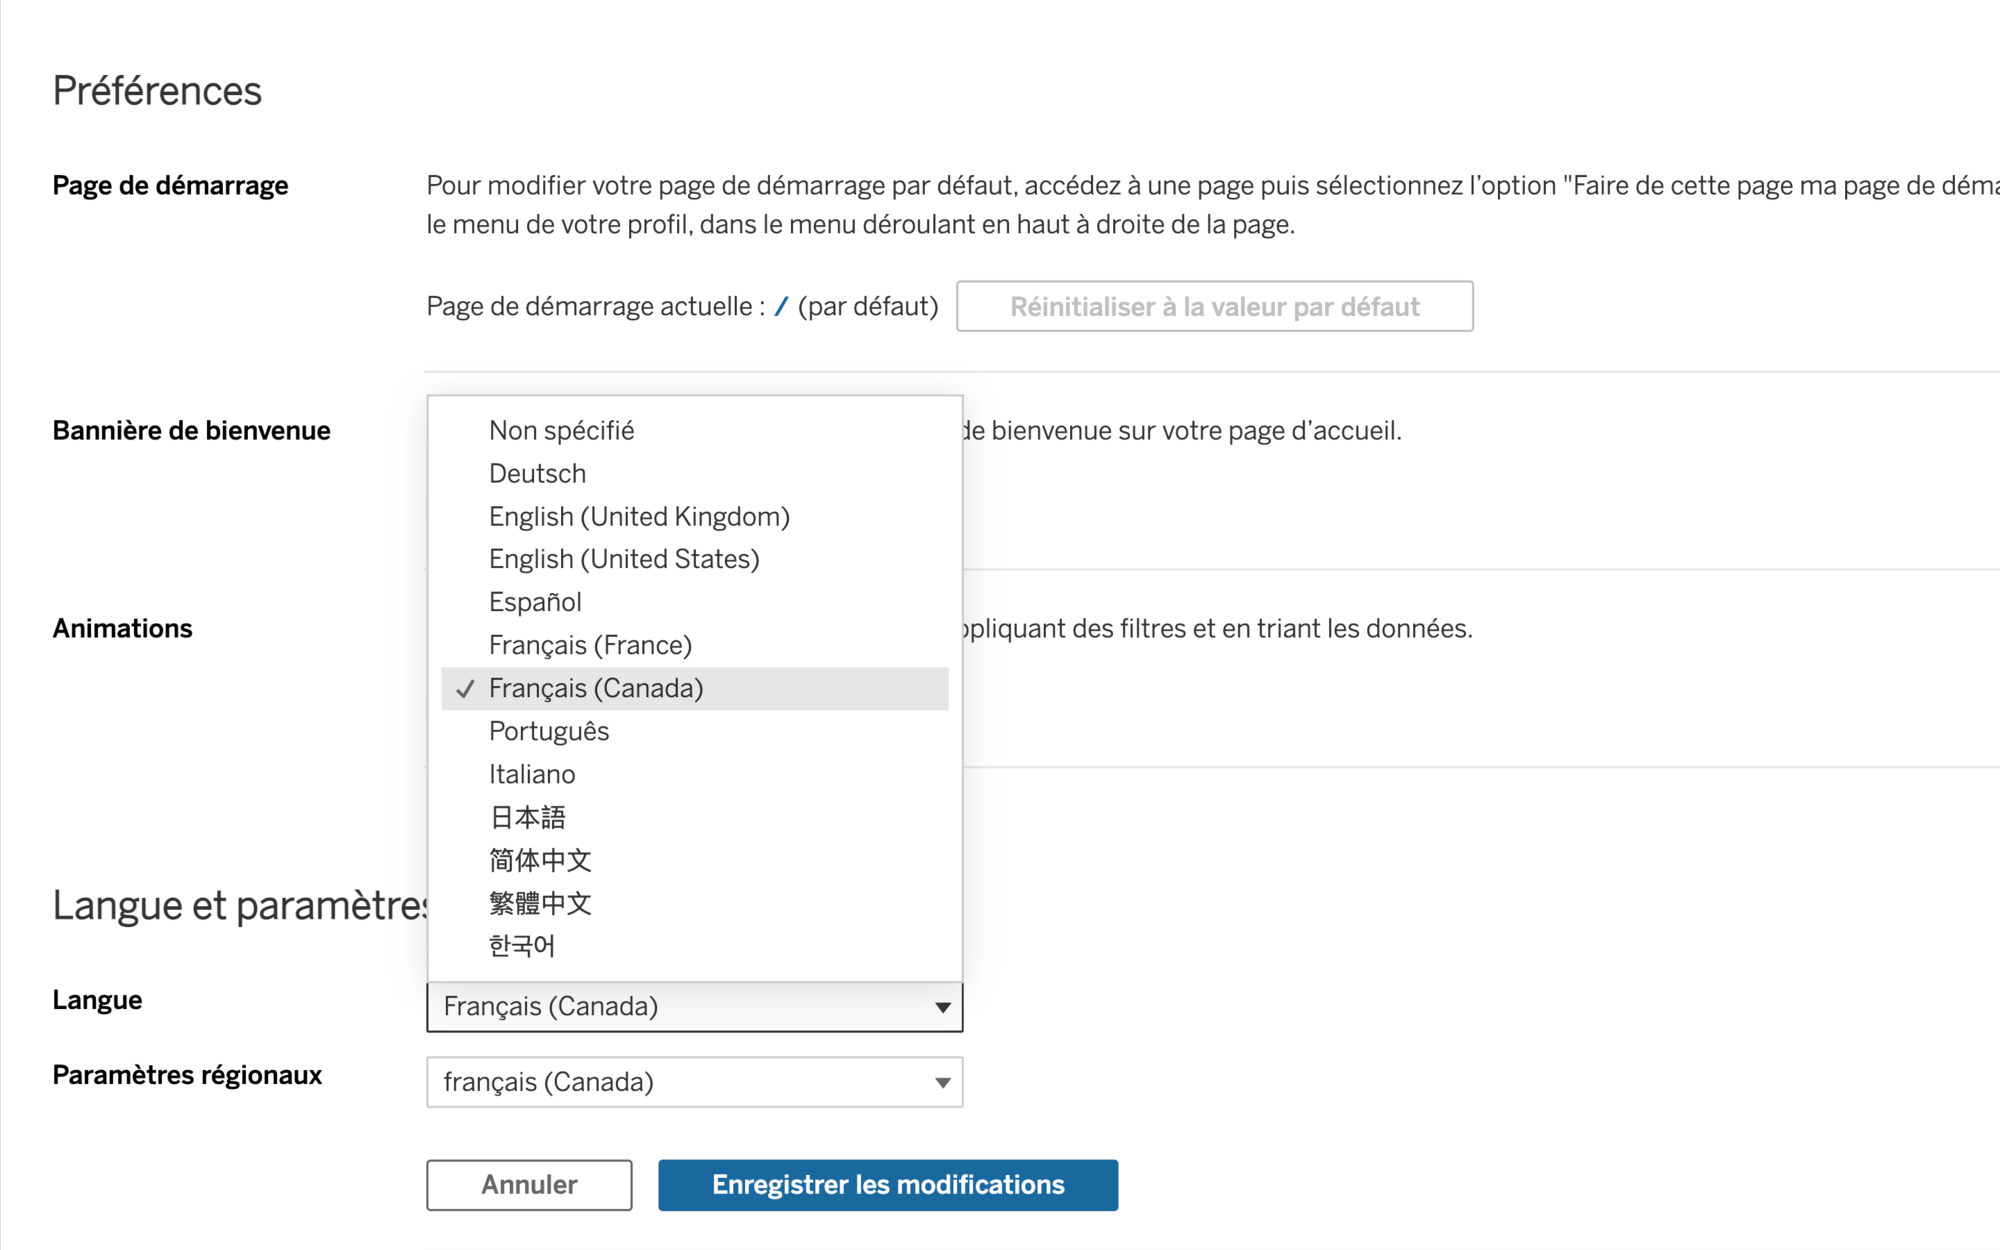
New product language: French (Canada)
See and understand data in your local language. We've expanded our language options to include French (Canada), making Tableau feel more familiar for French (Canada) speakers.
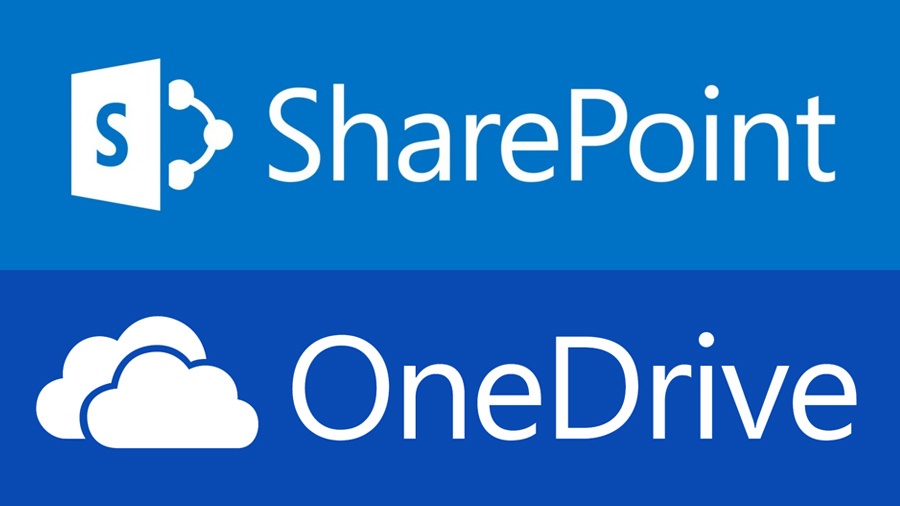
OneDrive and Sharepoint Online Connector
With the new Connector for OneDrive and Sharepoint Online, users can now access shared OneDrive files and files in Sharepoint document libraries directly from Tableau.

Add Filters Object
With the new Add Filters dashboard extension, you can empower dashboard consumers to customize the dashboard by adding filters that meets their specific needs. It aids in quicker exploration of data without the need to contact the original author to drive change requests for adding desired filters to the dashboard, and reduces visual clutter of irrelevant filters. Add Filters is an object that authors add to their dashboards which then opens up this new capability for consumers.
Add Filters is an extension that will be published to the Tableau Exchange.

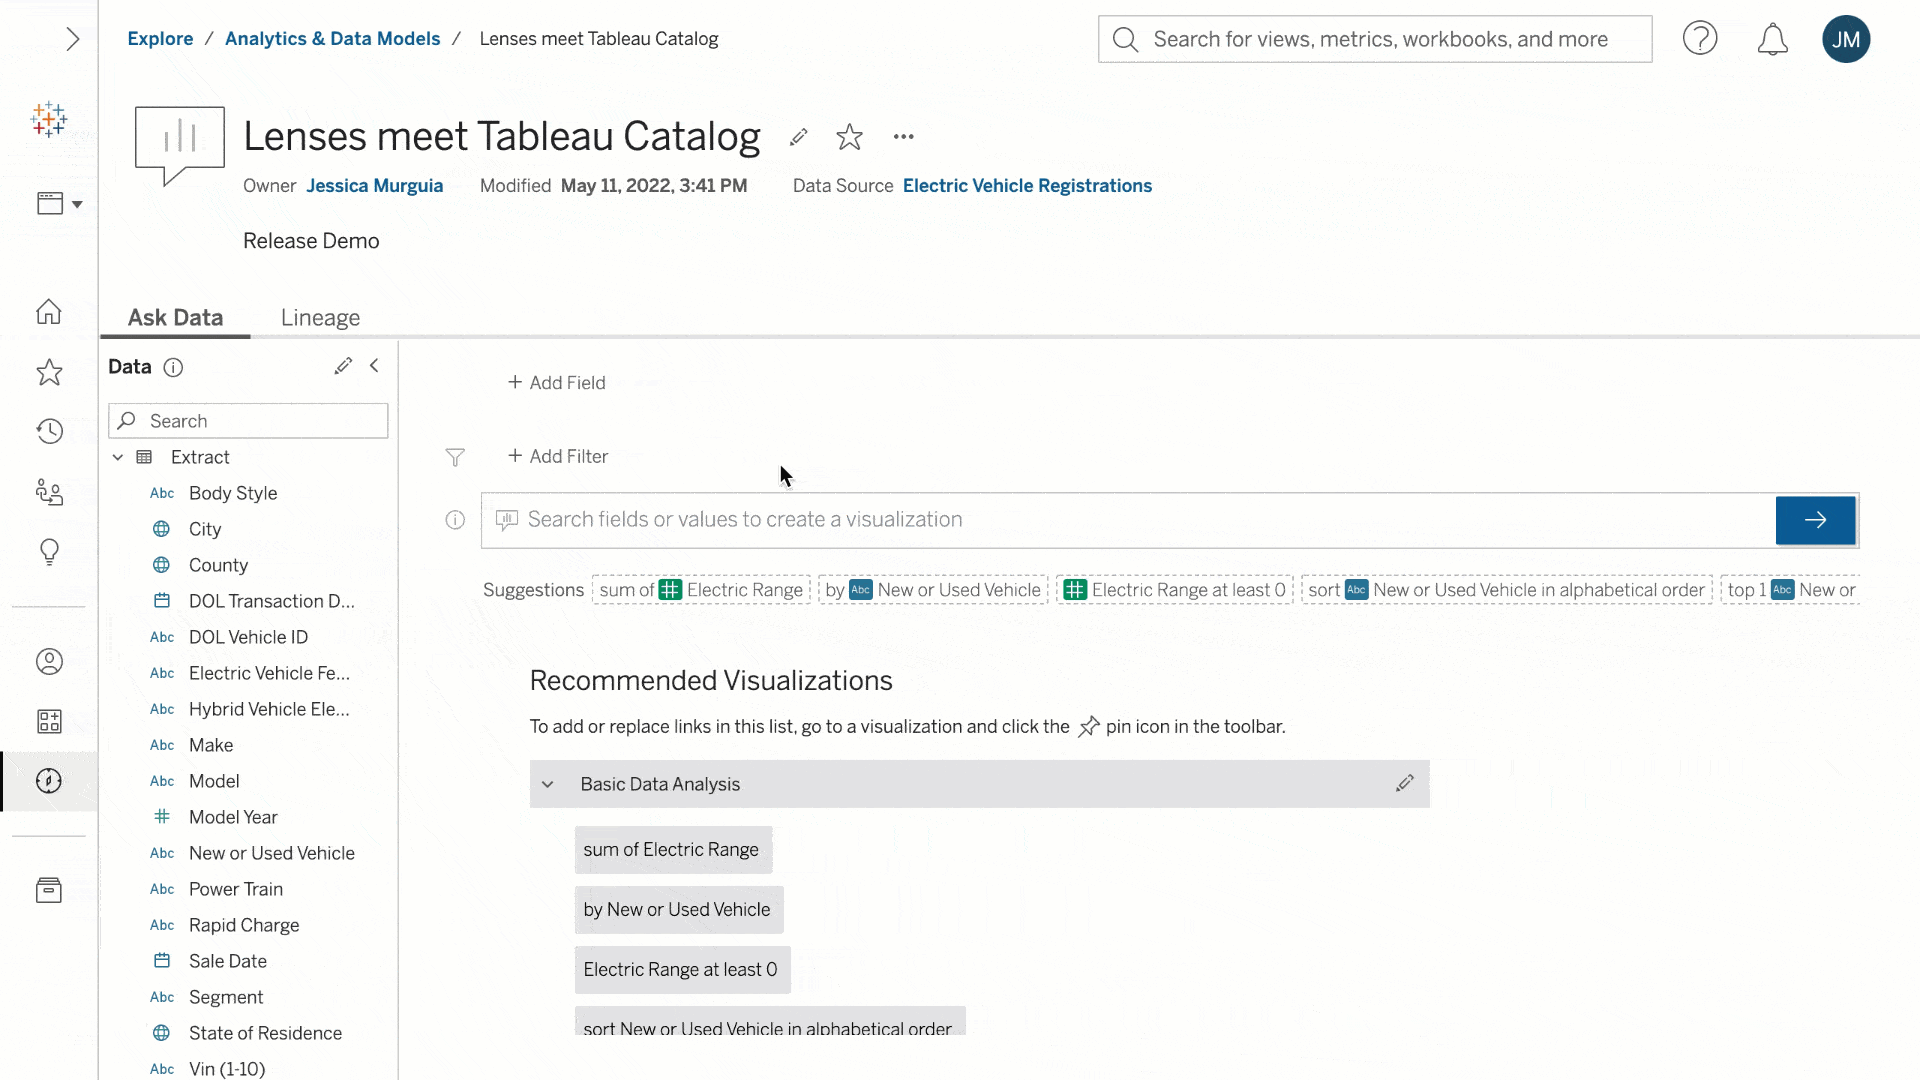
Improvements on Ask Data
We continue to extend the availability of Ask Data! Adding Ask Data to a Dashboard is now smoother than ever, supported end-to-end in Tableau Desktop. Also, we are increasing flexibility to manage Ask Data inside dashboards. Analysts can decide to show or hide the Ask Data Configuration toolbar, so business users can easily add visualizations to Pins, publish them as workbooks, or even share them with others.
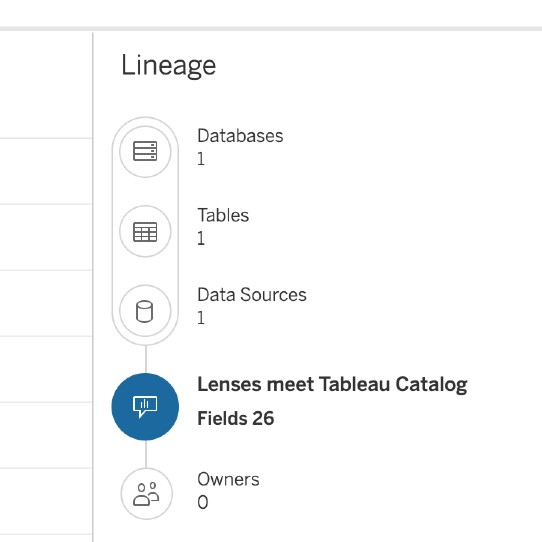
Lenses meet Tableau Catalog
Tableau Catalog gives you full visibility into your data assets. Now, you can see and monitor our newest content type: Ask Data Lenses. Discover and access downstream lenses faster, understand data lineage to weigh in the implications of any data definition changes, leverage the metadata API for deep insights that allow you to make informed decisions, and enable metadata visibility across your Tableau ecosystem.
Analytics lines
We continue to improve the formatting experience for reference and trend lines in Web authoring! You can now format the color and opacity of reference bands. We’ve also introduced custom number and date formatting for reference line labels, and you can customize your labels’ color and shading.
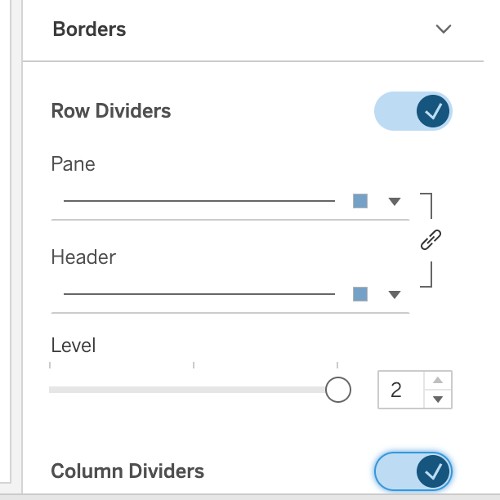
Borders and dividers
Web authors can format headers, panes, and cells’ table borders to select their preferred style, width, and color. Additionally, they can change the style, width, and color of dividers and select the appropriate divider level.
Easily access more actions on Stories
You can now access the context menu for caption boxes to format their height while authoring on the web.
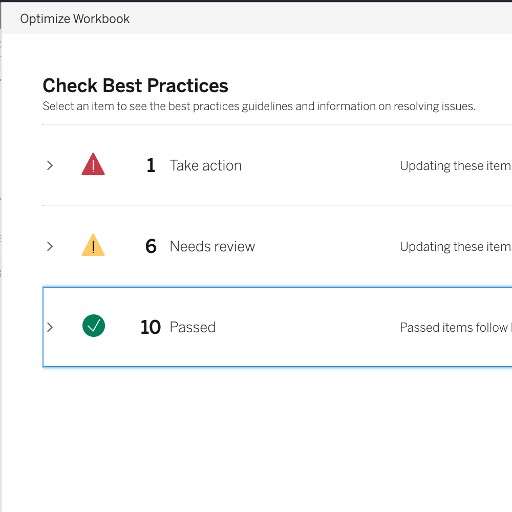
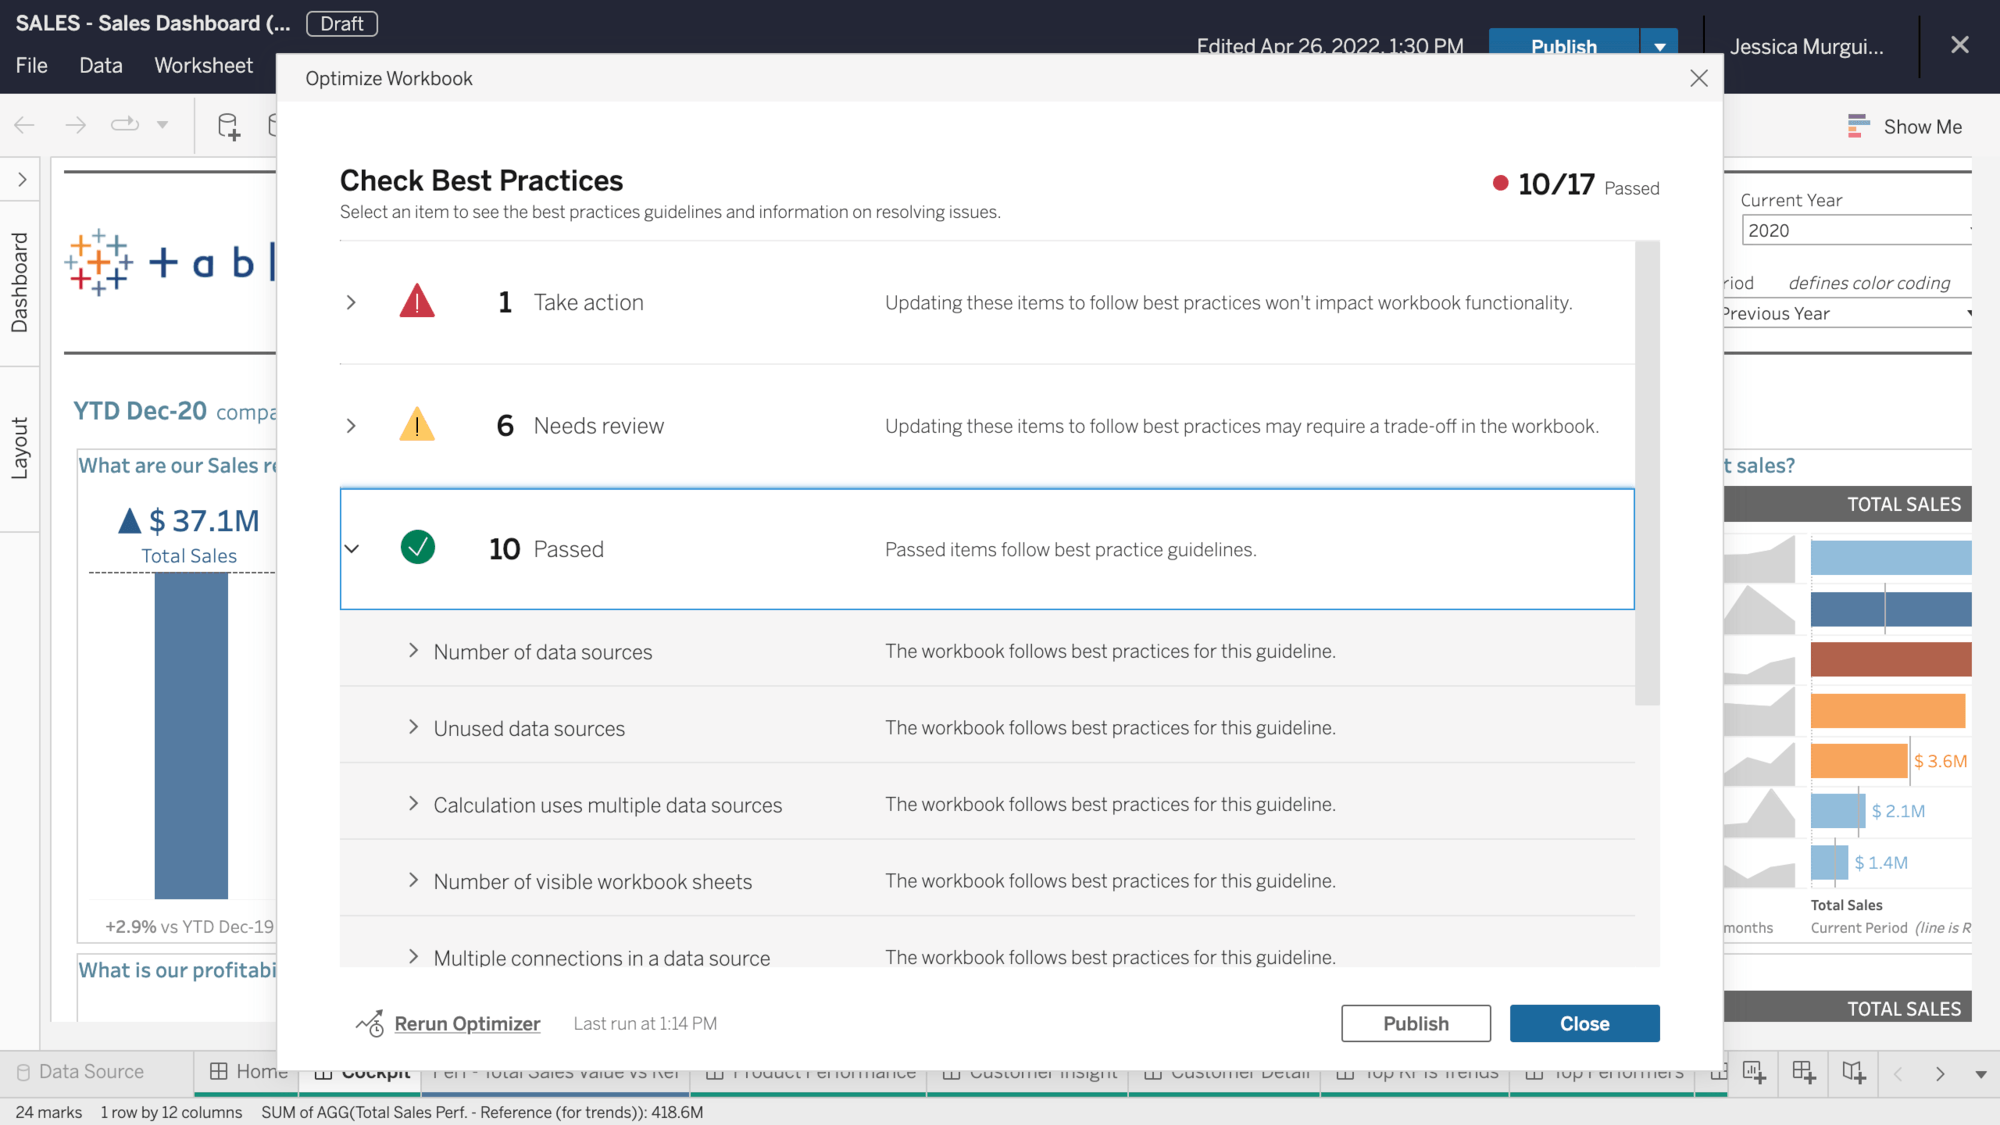
Workbook Optimizer improvements
To continue helping you optimize the consumption experience of your dashboards, Workbook Optimizer has new best practices available that automatically provide more suggestions to make your workbook run fast and smooth in Tableau Cloud and Tableau Desktop.
Additional encryption in Tableau Mobile
Tableau Mobile has added another layer of encryption for files stored by the app, making it even more secure. Our app double-encrypts files with software-encryption and OS-provided encryption.
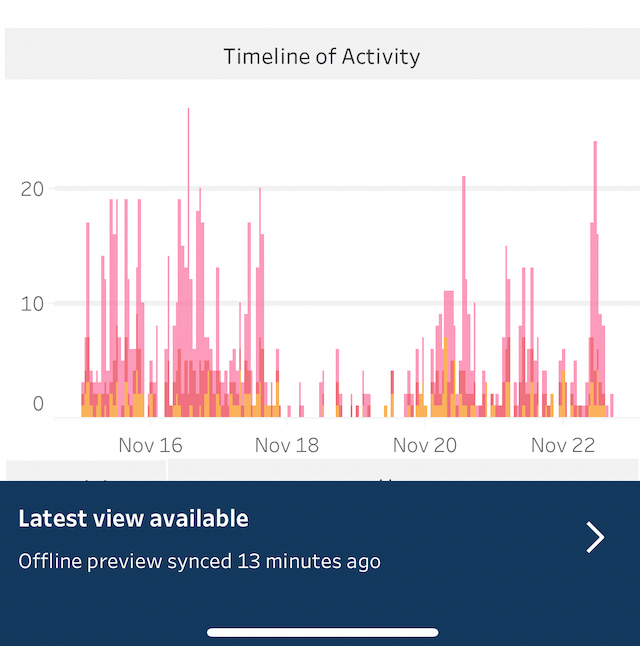
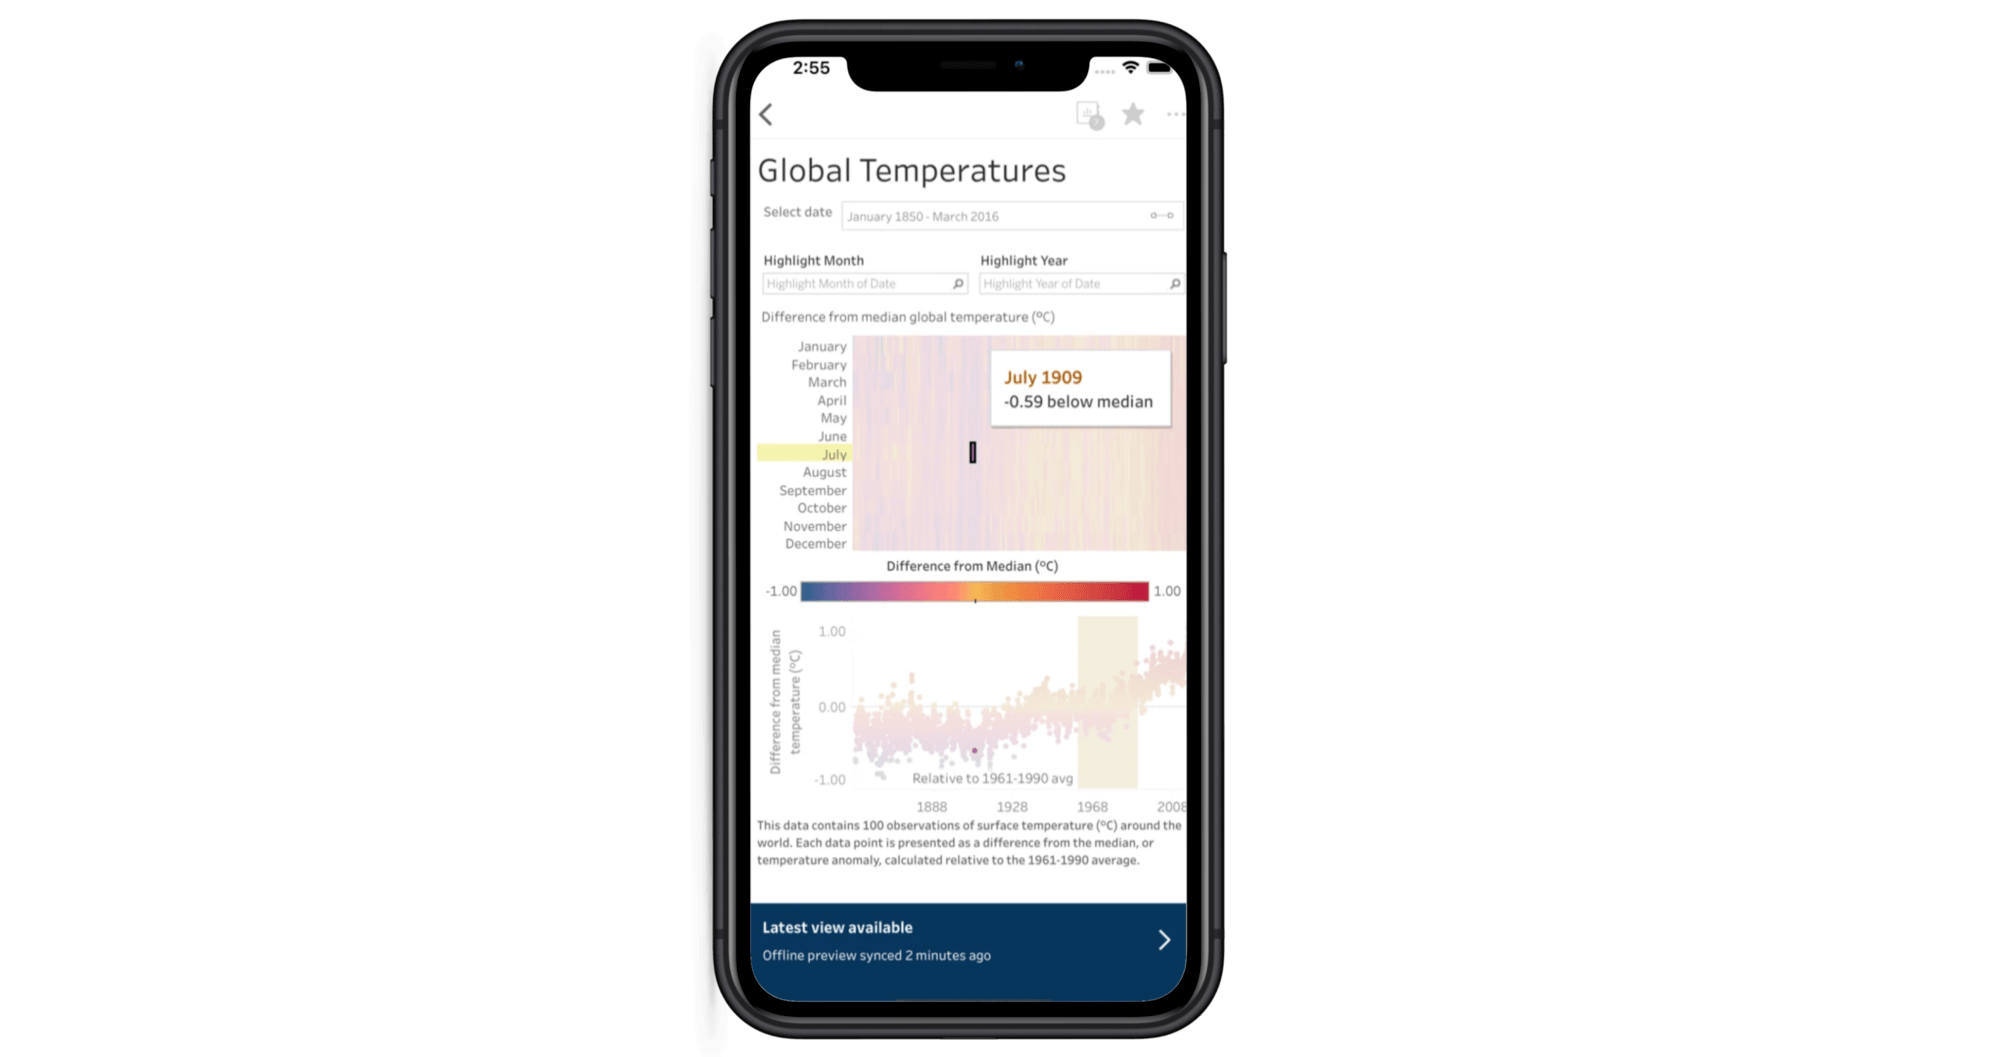
Offline Access to Start Page and Collections
Views, workbooks, and Metrics in Start Pages and favorited Collections are locally cached, providing access to your most important data even when you're offline. Like other favorited content, views will be stored as interactive previews, allowing you to scroll, pan, zoom, see data tooltips, and highlight marks. Once online, you can seamlessly transition to the latest version on Tableau Mobile.
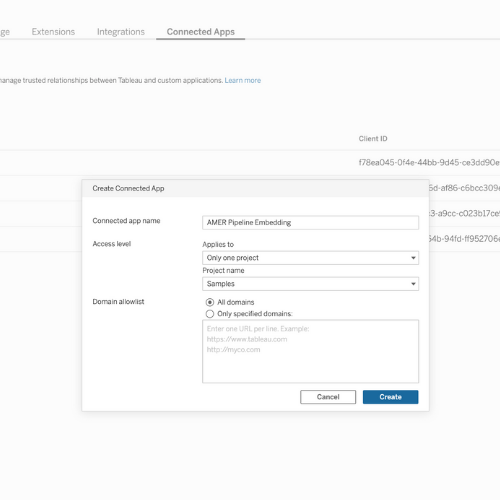
Connected Apps for Tableau Cloud
Enables Tableau Cloud customers to use external IdPs to build trust relationship between their applications and Tableau. This allows end-users to seamlessly access embedded analytics without in-frame authentication and allows the application to programmatically access the Tableau REST API.
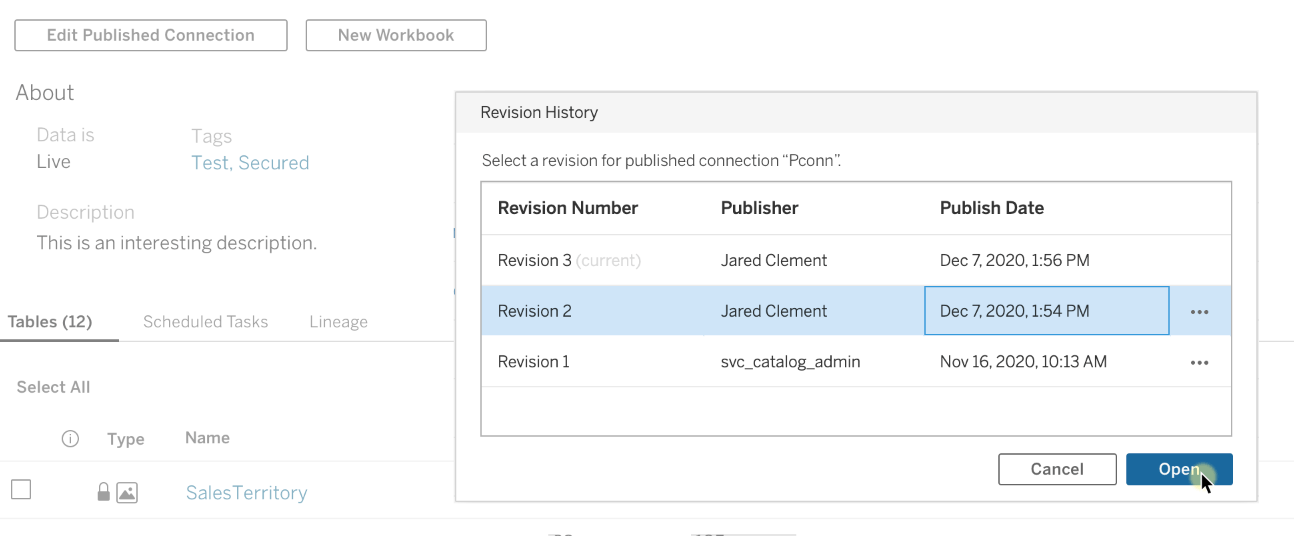
Revision history for Virtual Connections
Revision history is now supported by Virtual Connections. This feature, available in Tableau Cloud, enables automatically storing old revisions across content types, viewing those revisions, and restoring them.
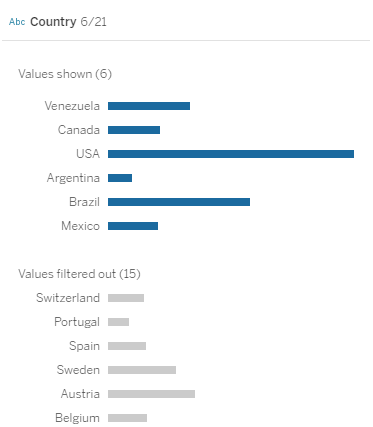
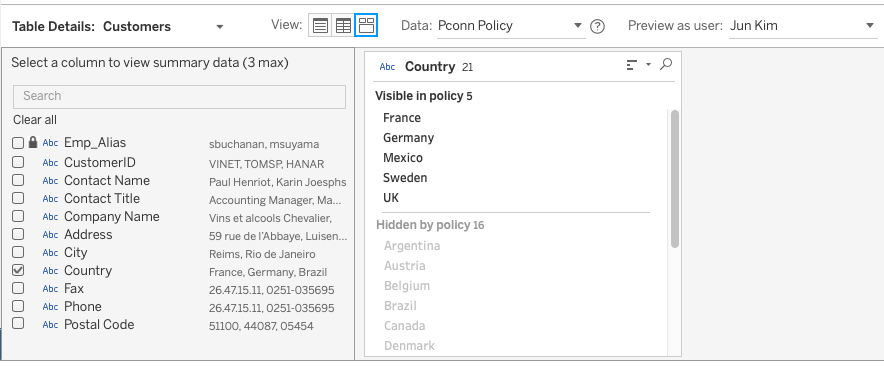
In/Out visualization for policy testing
Policy authors can test the impact of policies within Virtual Connections by quickly identifying data domains that are visible or hidden after applying a policy to a column.
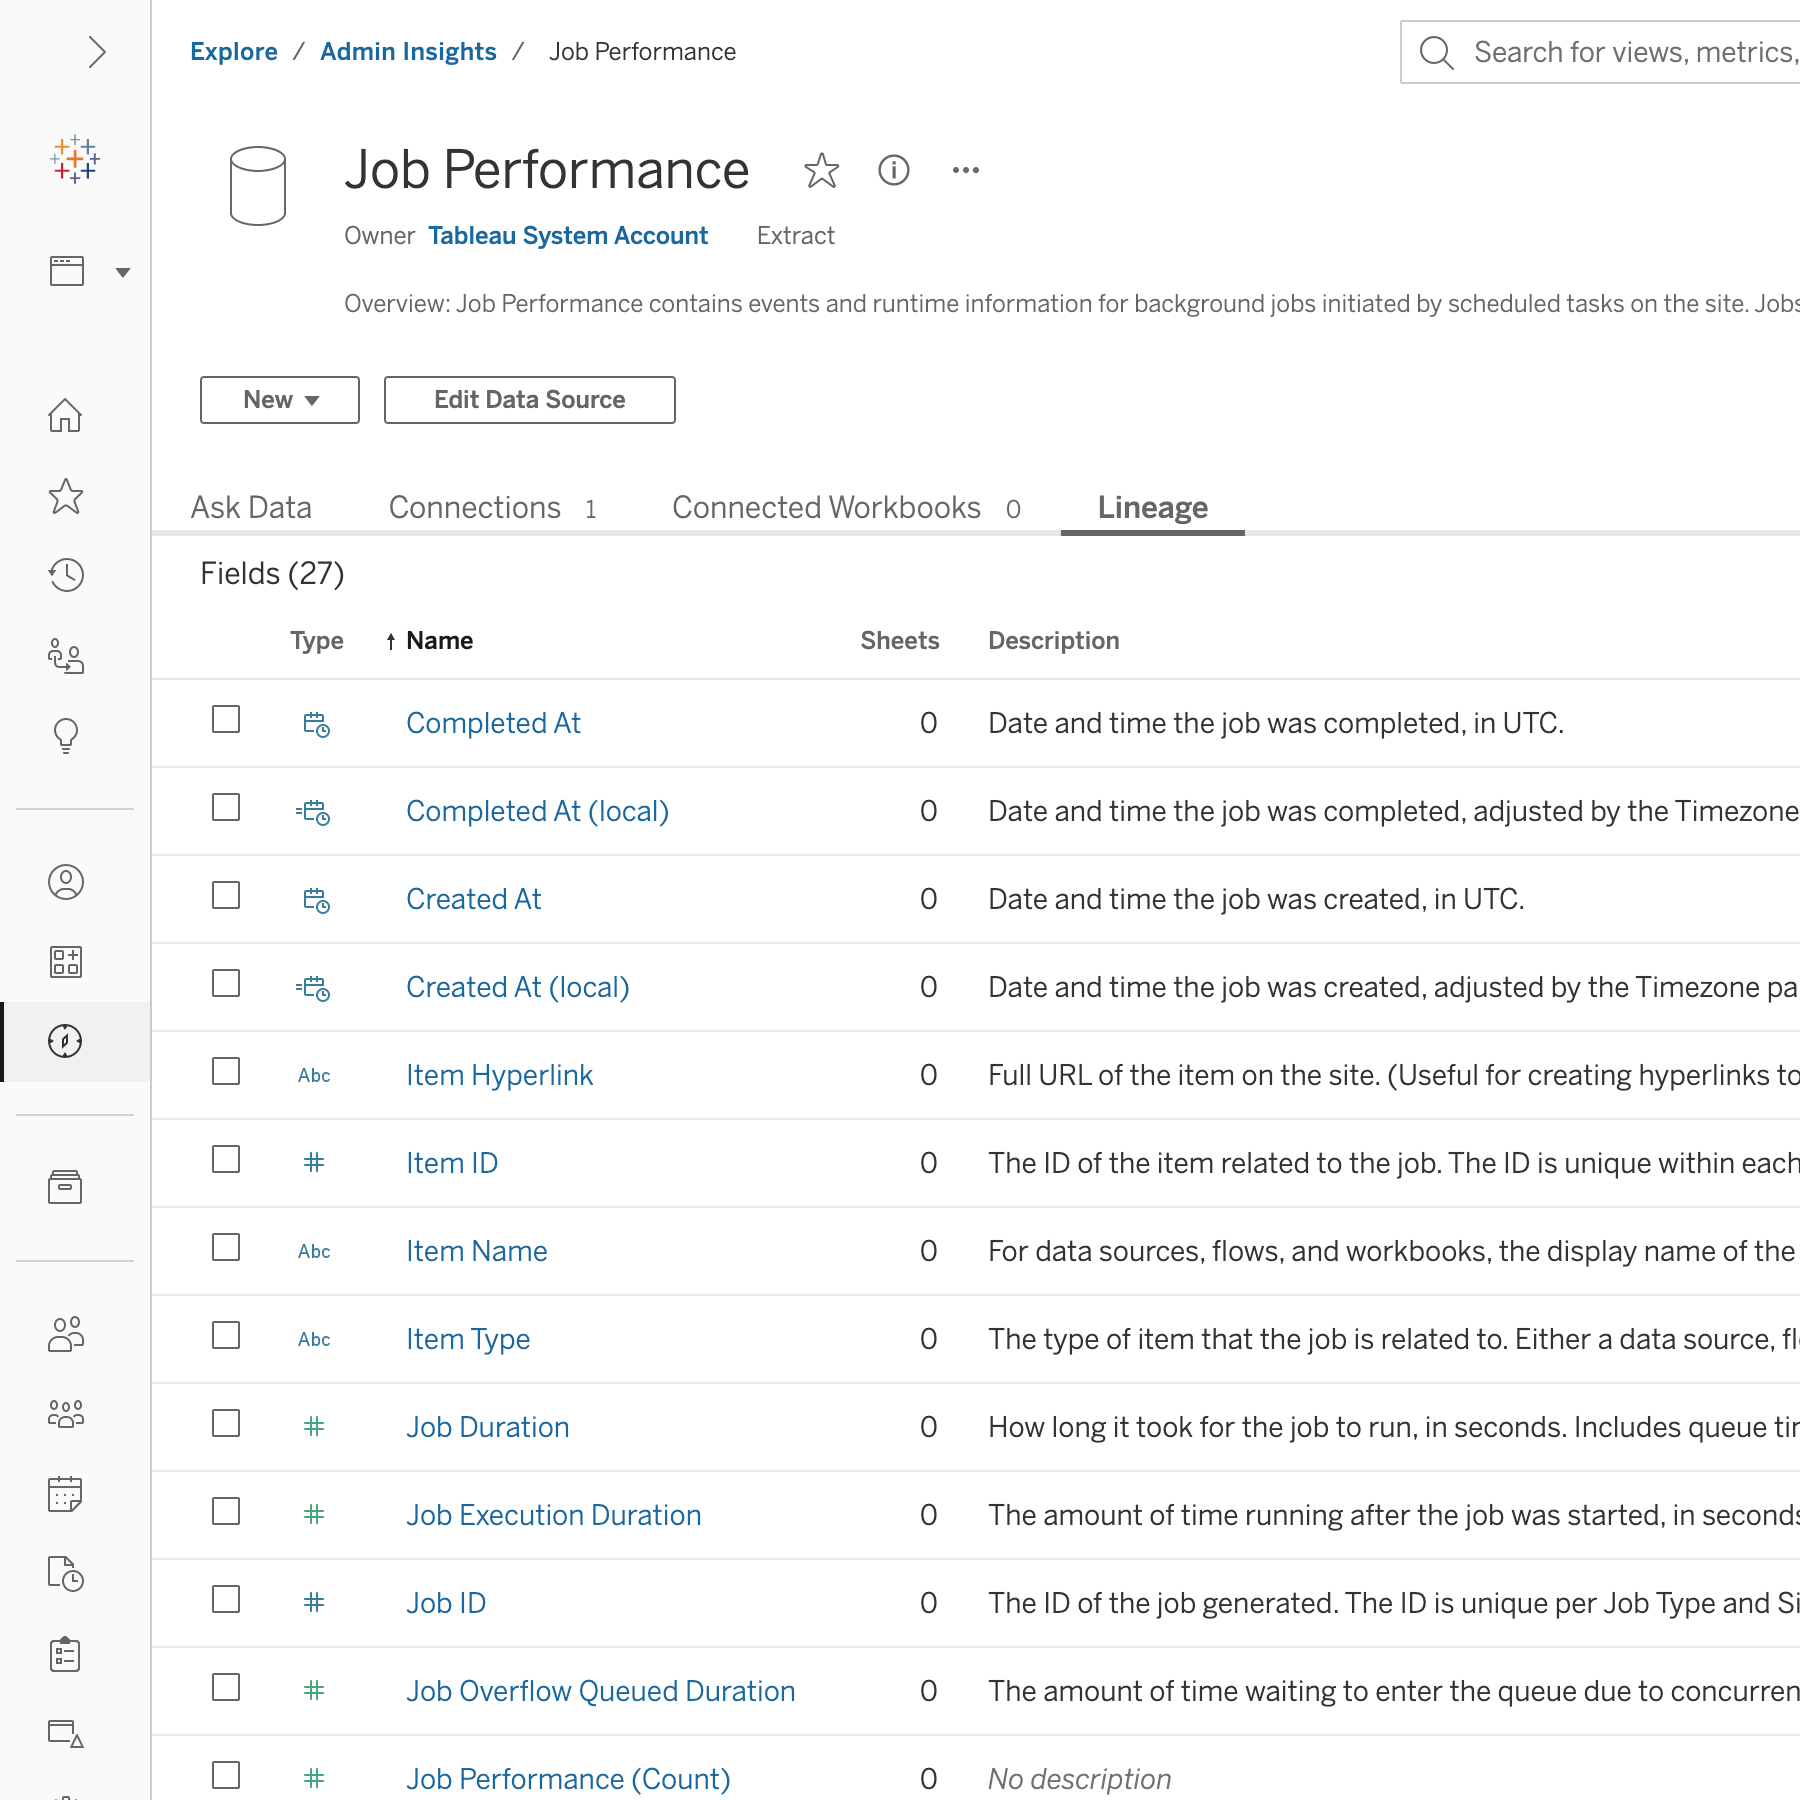
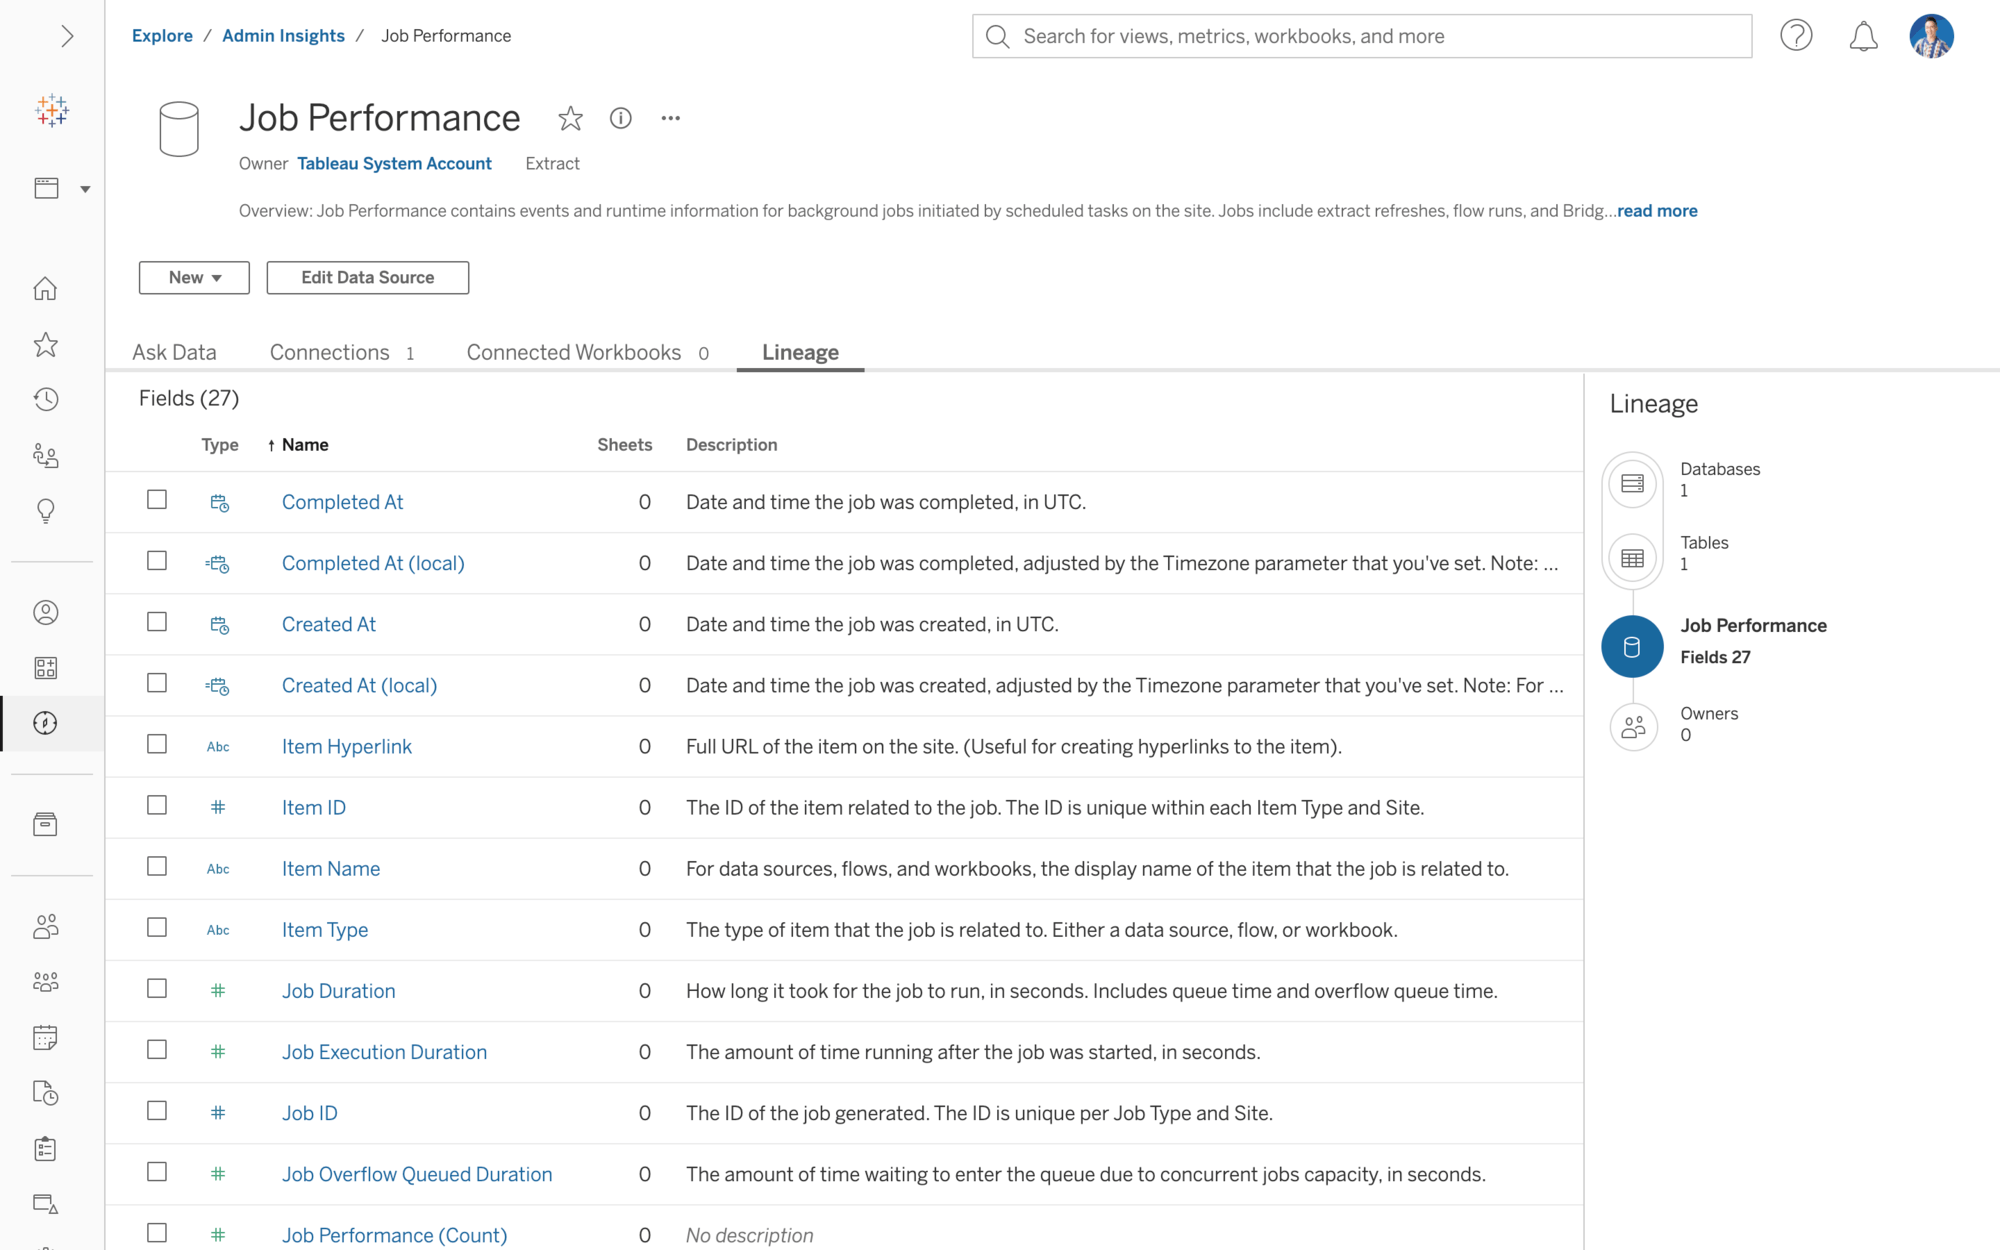
Job Performance Data Source
Gain visibility into events and runtime information for background jobs initiated by scheduled tasks on the site.

View Acceleration improvements
You can now automatically suspend acceleration for views that are consuming unnecessary resources. Set a threshold for the number of times an acceleration task can fail per day, week, or month before the acceleration is automatically suspended.
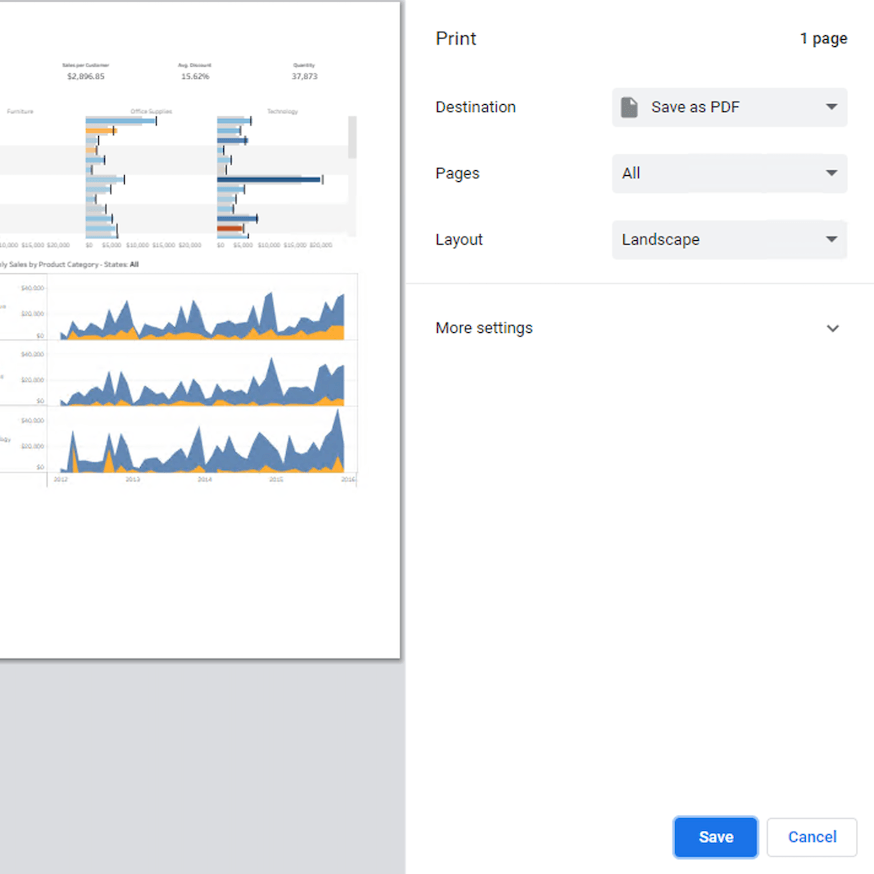
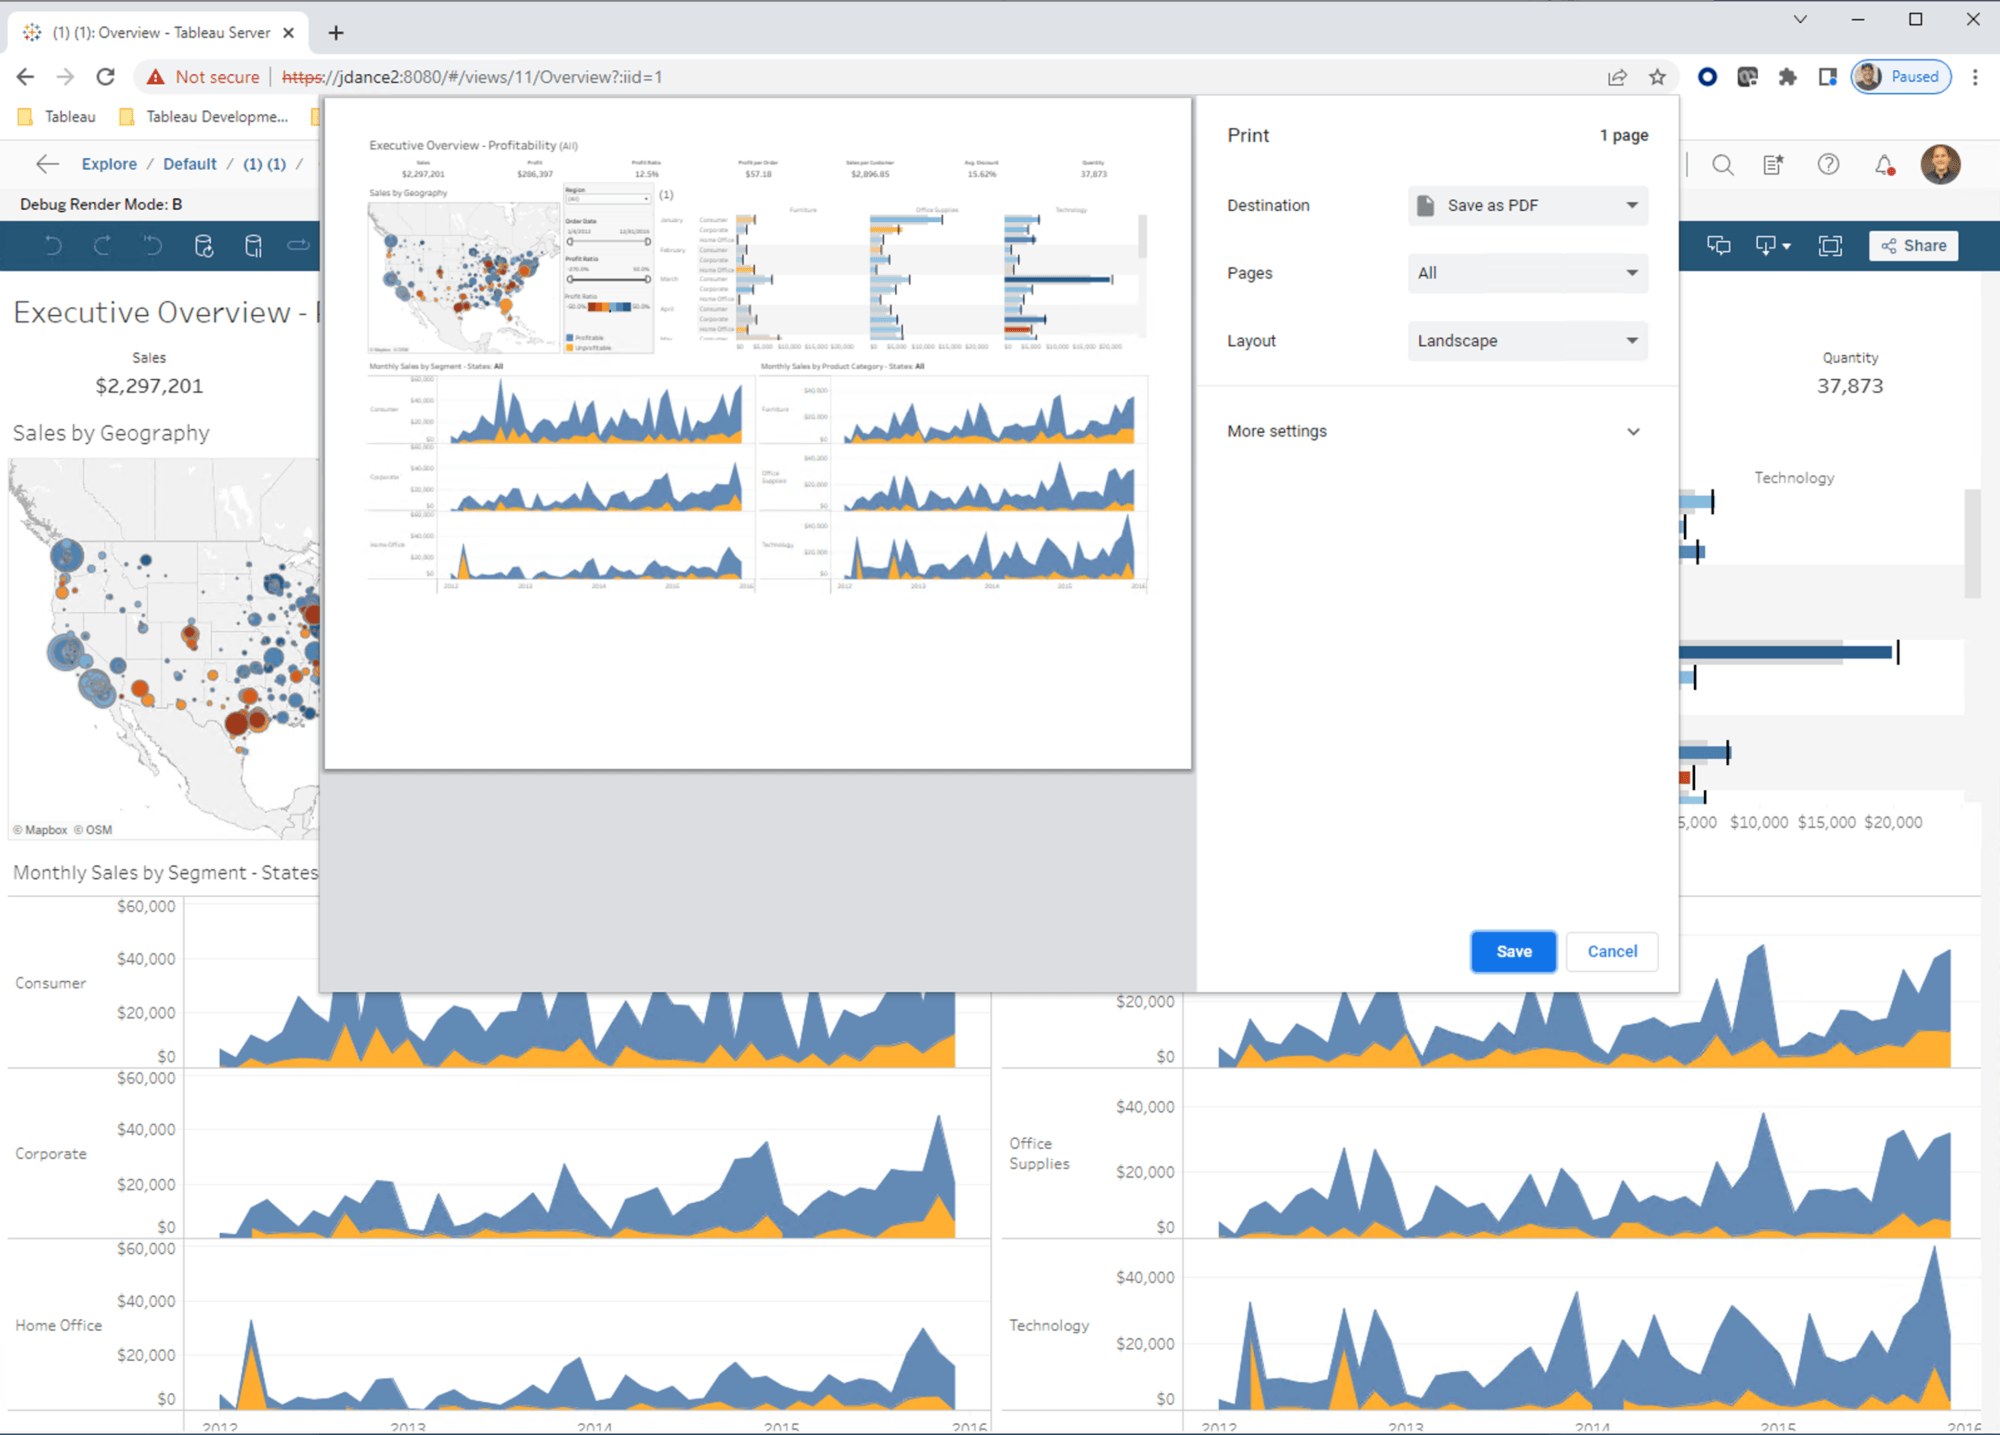
Native browser printing
Capture Tableau dashboards using your browsers’ printing capabilities. When printing, choose landscape or portrait and scale according to your needs. Native printing works especially well in embedded scenarios and renders Dashboard Extensions.

Explain Data default setting
Admins can enable Explain Data by default for all workbooks on a Tableau Cloud site.
OAuth for Tableau Bridge
We've strengthened security with Tableau Bridge OAuth support. You can now use OAuth as a secured authentication process allowing you to authenticate without using credentials to enhance your data security.
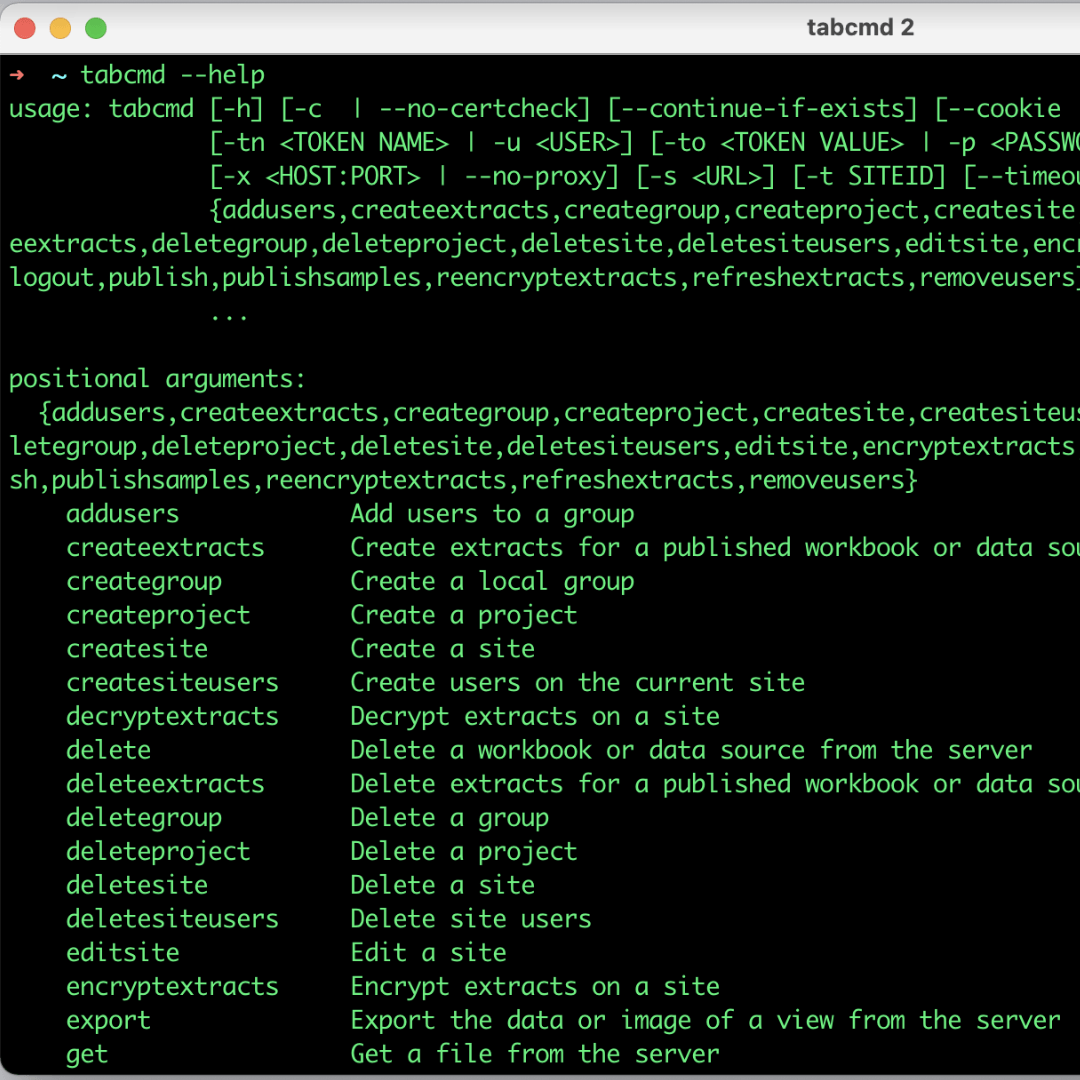
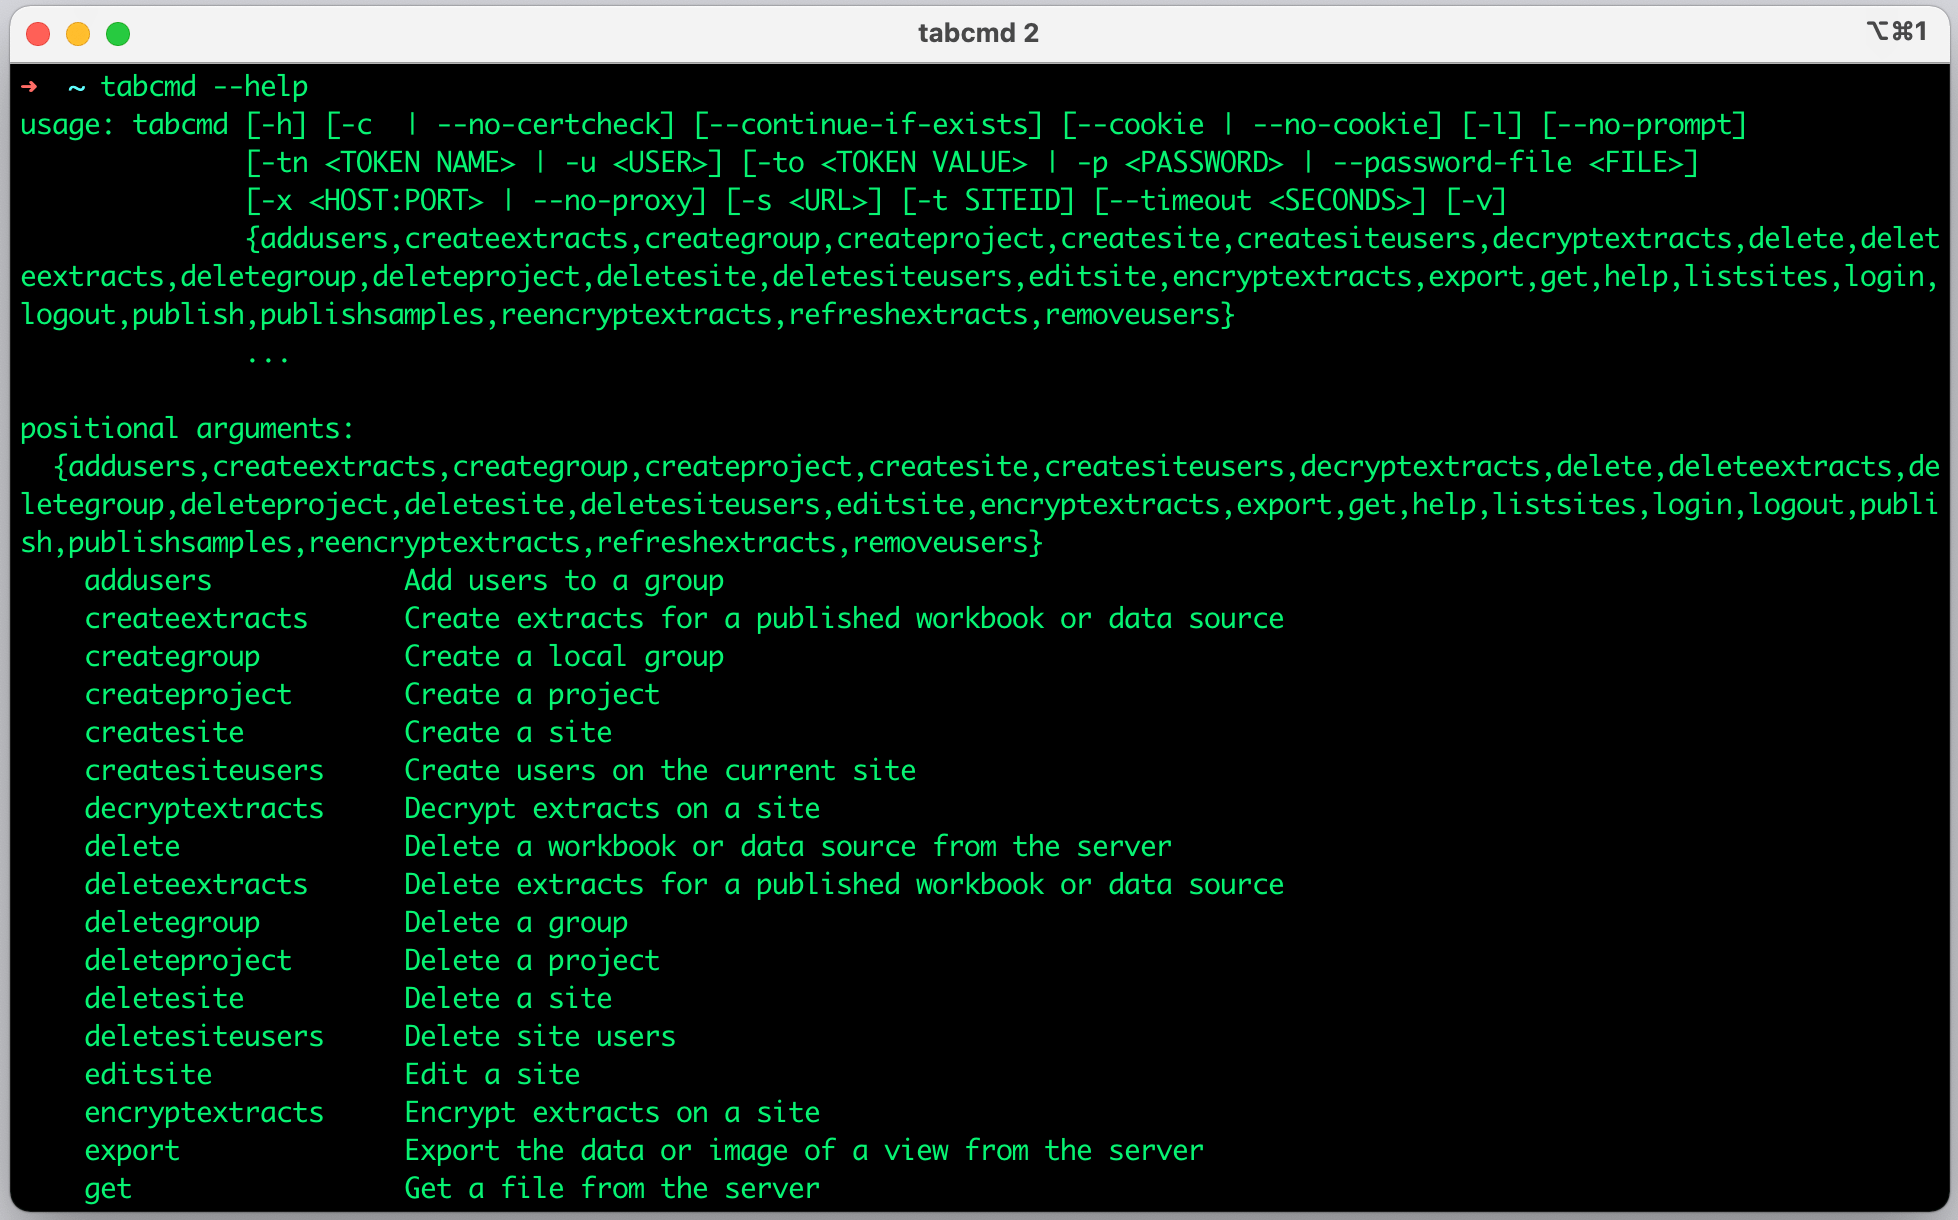
Tabcmd 2.0
Tabcmd 2.0 is an open-source Python-based command-line utility that uses the Tableau Server Client (TSC) to support the functionality of the existing tabcmd. This new version adds support for personal access tokens for authentication, which provides a unified developer experience across the Tableau Developer Platform by calling the Tableau REST API.

Metrics REST API Endpoint
With the Metrics REST API endpoint, you can now fetch Metrics data within your own applications and custom developments. This gives you the flexibility to format and display your Metrics data within your own environments, or even pull Metrics data into a database to trigger actions.
Ask Data Lens APIs
Managing lenses across sites is now a breeze. Export curated and tested lenses from one site and import them to one or hundreds of sites at scale, even across separate servers. Transformations also let you surgically change details on import, like updating names or connected data sources. Get all the information in our REST API Help.
Embedding Allow-List via REST API
Using the REST API, you can set where you want Tableau to be embedded at the site level. Site admin can allow embedding for all domains or specific domains or block embedding content from that site all together.
Search API
The Search API provides a new powerful way for developers and partners to build functionality that searches across their Tableau content. The Search API supports fuzzy matching on keywords, filters, multiple sort options, and pagenation. By default, results are sorted by relevance, allowing external developers and partners to take advantage of our internal ranking alogrithms.
Scope-based access to the REST API
Customers can have their external client applications establish authenticated user sessions with specific OAuth access scopes through JSON Web Token (JWT) verified by Connected Apps. With a valid user session, the client application can access to REST APIs on behalf of the user as long as the required scopes of the called endpoints are included in the access token. 70+ APIs are enabled in this release.
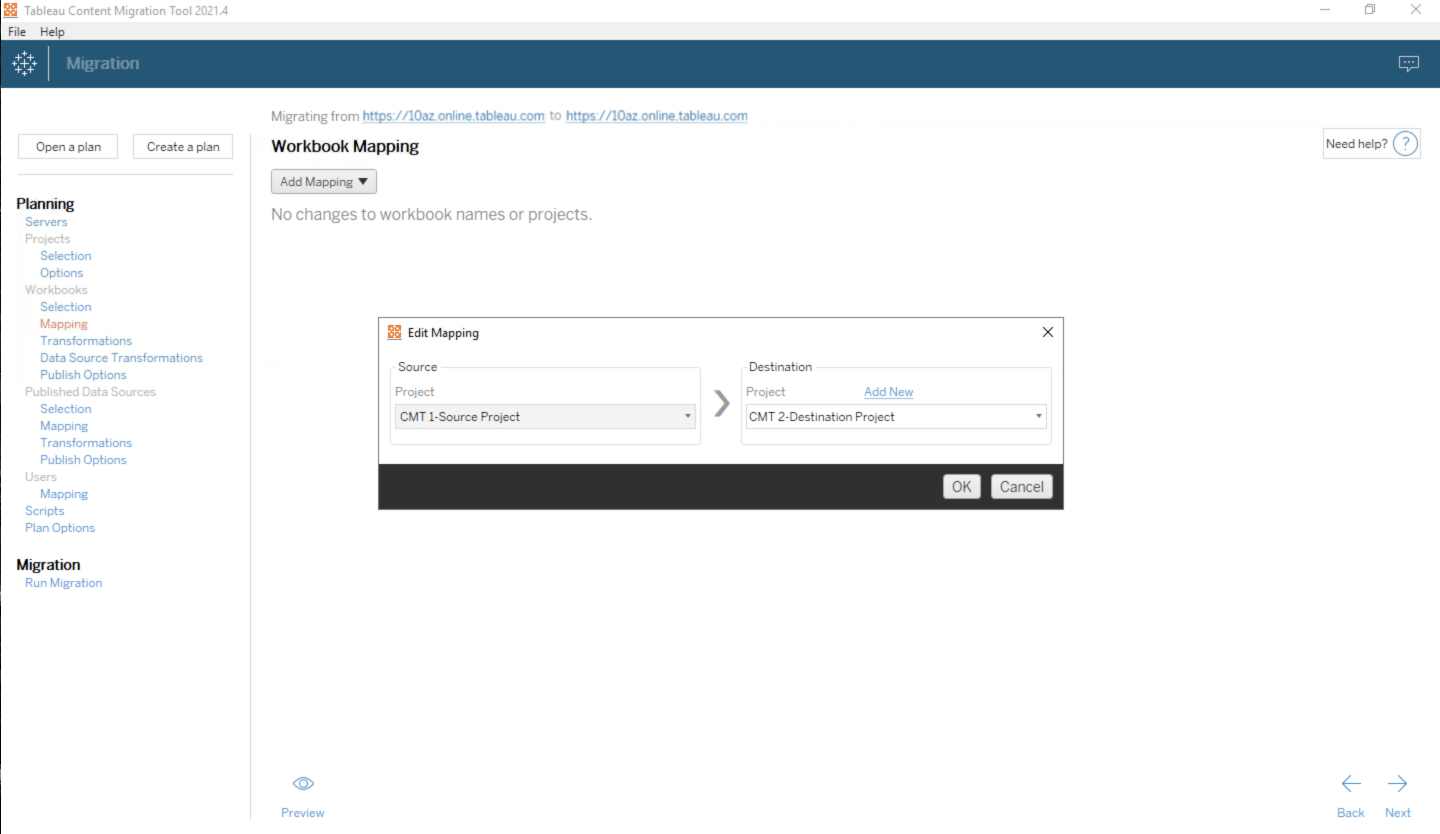
Content Migration Tool
The Content Migration Tool is here with Advanced Management for Tableau Cloud. The Content Migration Tool automates tasks such as content promotion and archiving, supporting both traditional and modern workflows or anywhere in between. With a codeless, streamlined, and repeatable migration plan, you can copy or migrate content between projects on Tableau Cloud. The Content Migration Tool User Interface walks you through the steps necessary to build a migration plan that you can use a single time or schedule for repeated migrations.
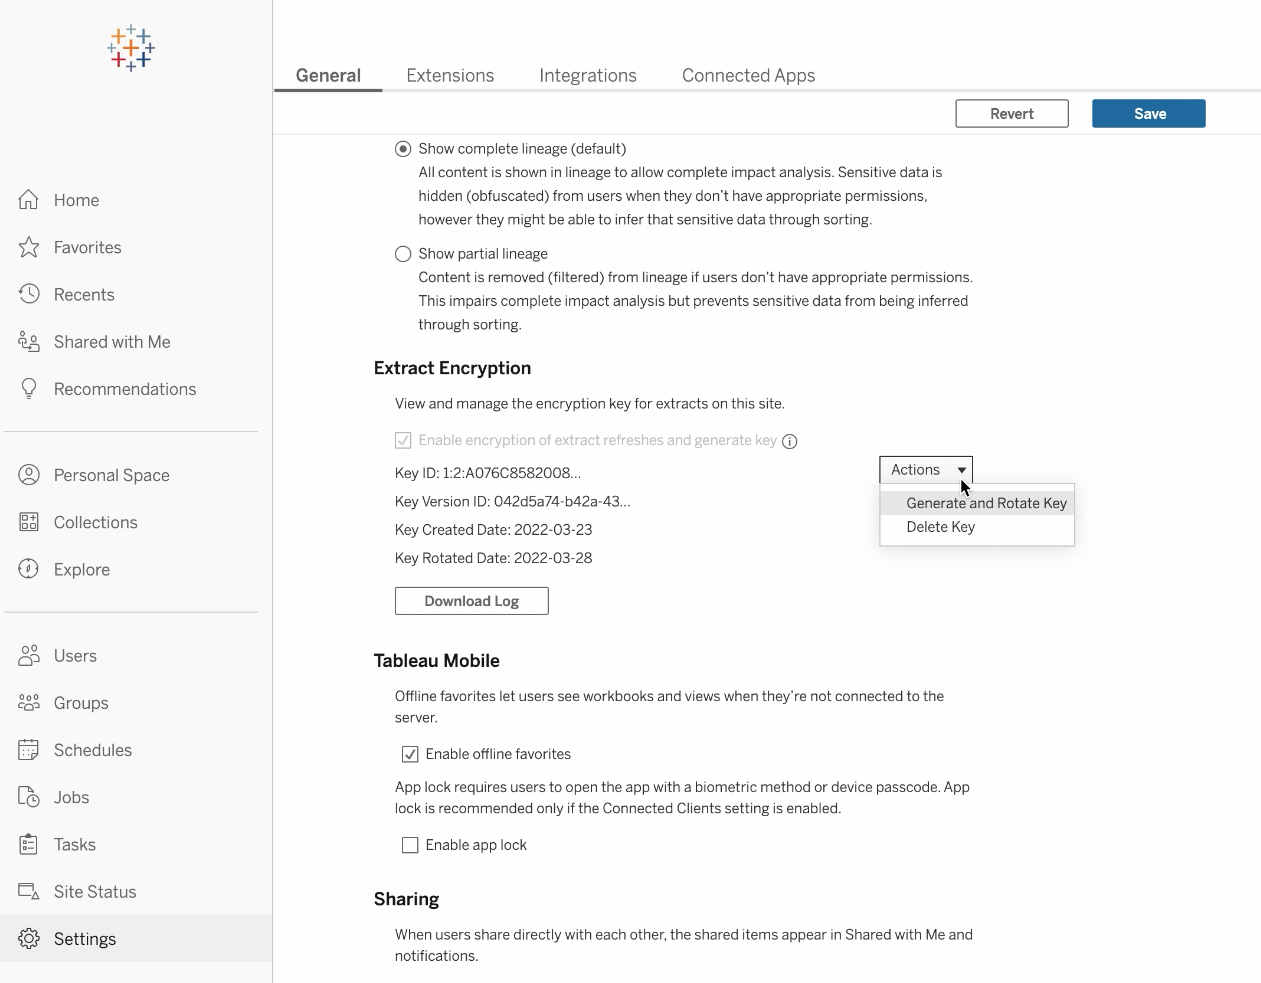
Customer-Managed Encryption Keys
Tableau Cloud Advanced Management customers can now manage their own encryption key, which will encrypt all data extracts on their site. Customer-Managed Encryption Keys (CMEK) leverage Salesforce Shield Key Broker and allow customers to create, rotate, audit, and delete their key from the Tableau Cloud UI. The Master Encryption Key is stored in Salesforce's KMS Service and the key is unique to your site. Leveraging CMEK on top of built in encryption storage provides a defense-in-depth strategy to protect your data and meet tough compliance standards.
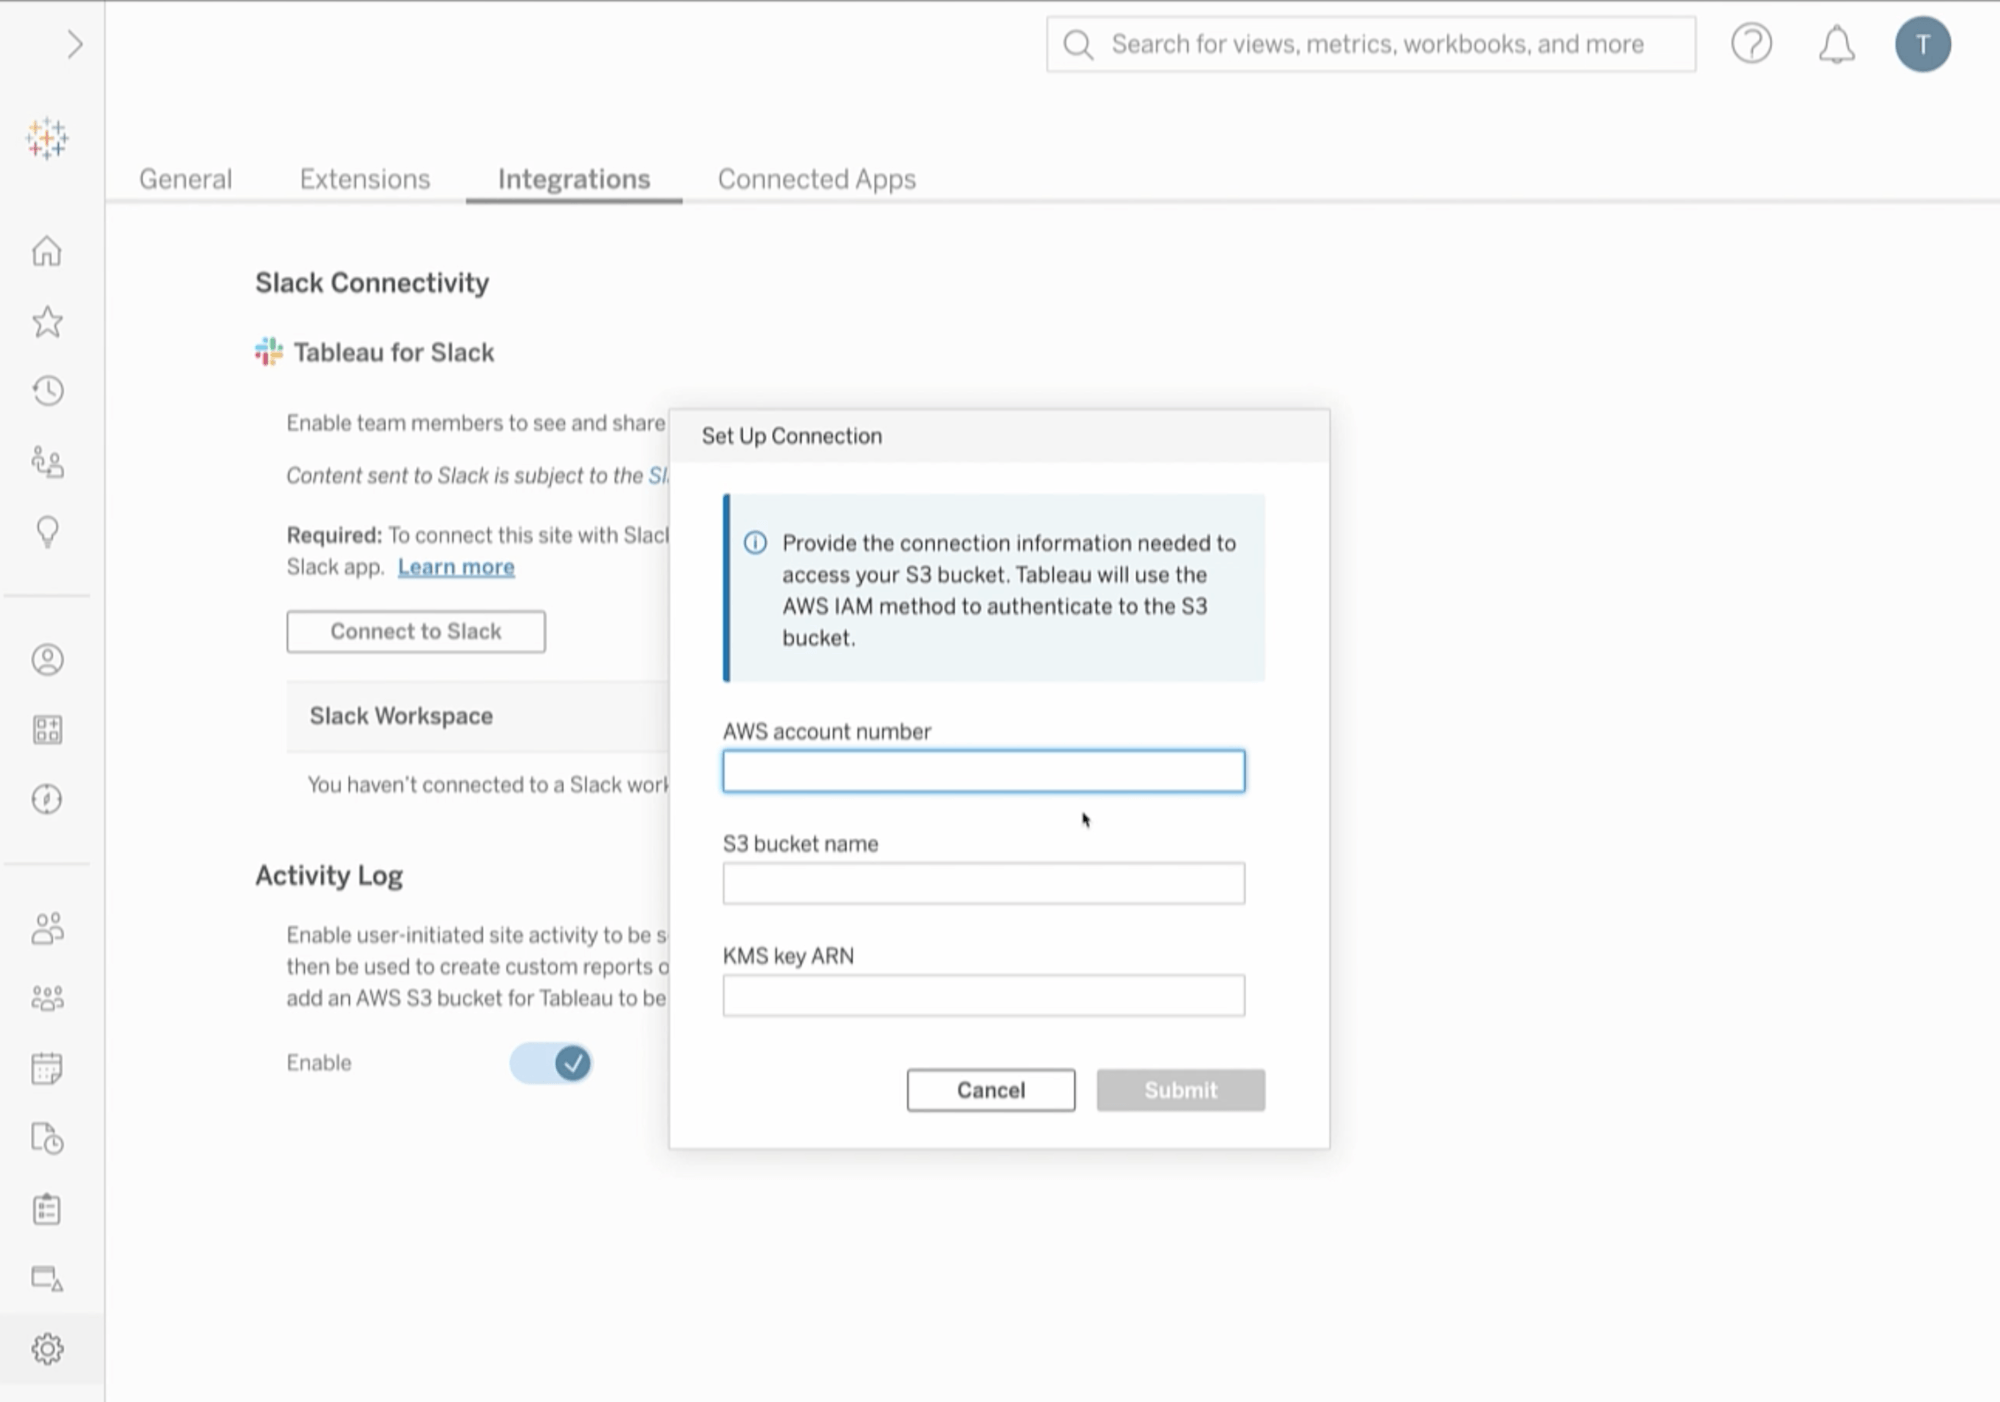
Activity Log
The Activity Log goes above and beyond existing event data by exposing more events within your Tableau environment. These events will be structured and documented. For Advanced Management for Tableau Cloud customers, this comes to life through a JSON file that is sent to an S3 bucket. The Activity Log will make permissions auditing possible which is essential for implementing a robust book of controls on your Tableau environment.
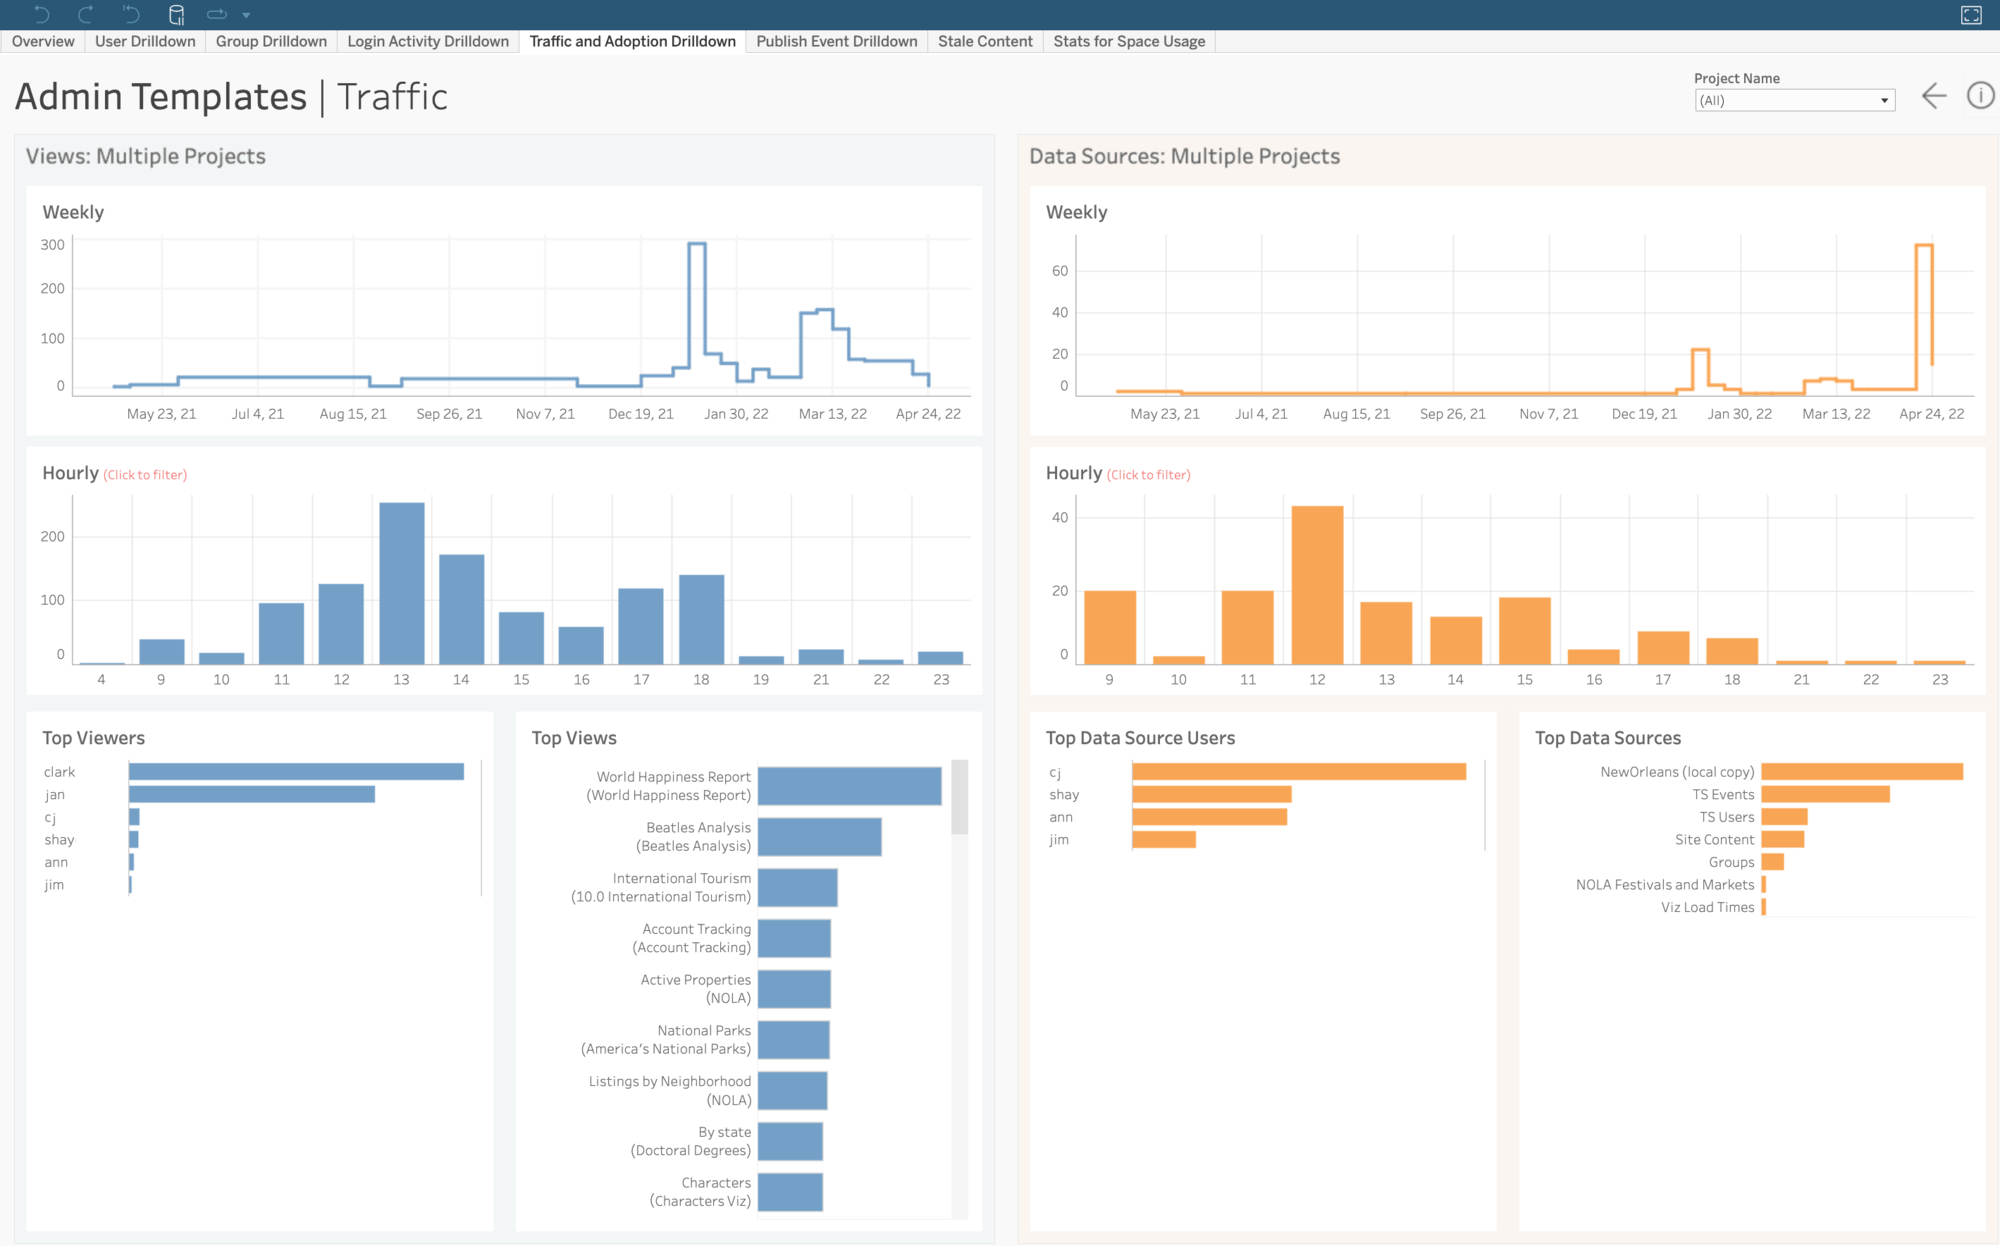
365 days of Admin Insights data
With Advanced Management, Admin Insights in Tableau Cloud will now retain data for up to 365 days. With longer data retention it is easier to track adoption, site activity, and content usage and performance over time through the Admin Insights Starter workbook, or custom admin views.
Azure AD SCIM 2.0 support for Tableau Cloud
Configure automatic user and group management through Azure AD. Synchronize Tableau Cloud and Azure AD to quickly provision and de-provision users and groups at scale. If users are members of multiple groups with varying role assignment in Azure, they will receive the most permissive site role in Tableau Cloud. We also now offer a more secure authentication method using bearer tokens.
Increased Site Capacities
Advanced Management provides Tableau Cloud customers with additional site capacity including:
• 1 TB of Storage
• Up to 25 Concurrent Extracts
• 25 GB Max File Size
Learn More About Tableau Releases