
Tableau 2021.3
Data management updates, Tableau notifications in Slack, and Personal Space
Data management updates
This release brings new data management capabilities to make working with data more efficient. Automate multiple flow jobs with linked tasks with Tableau Prep Conductor, and generate missing rows based on dates, date times, or integers with Tableau Prep. Updates to Tableau Catalog include data quality warnings (DQWs) in subscription emails so you can get notified immediately about potential issues with your data, and you can now see inherited descriptions in web authoring for fuller context of your data.
Learn more about Tableau Data ManagementIT leaders are facing unprecedented challenges today. It’s no longer a luxury for businesses to have a data analytics platform, it’s a necessity that could make the difference between surviving and thriving.
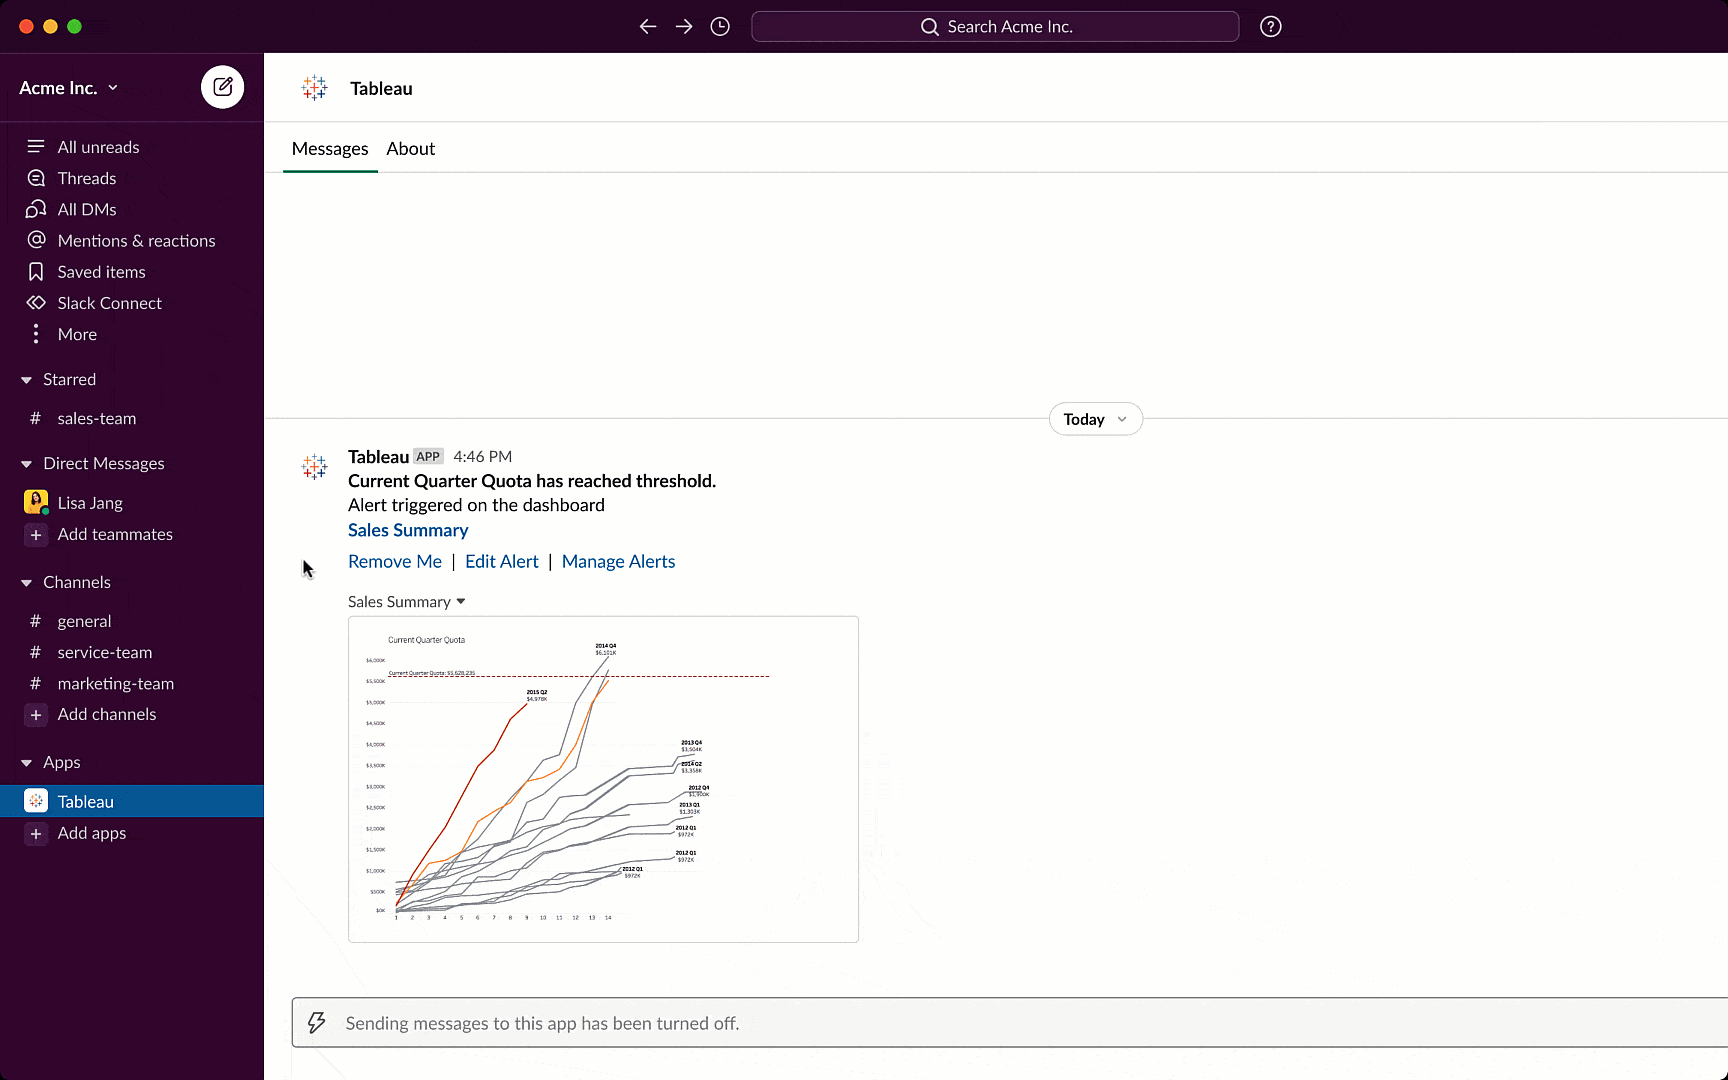
Tableau notifications in Slack
With Tableau for Slack, you can stay up to date on all of your data from anywhere. With our new product integrations, you can now get notified directly in Slack for data-driven alerts, when you are @mentioned in a comment, or when someone shares content with you in Tableau.
Learn more
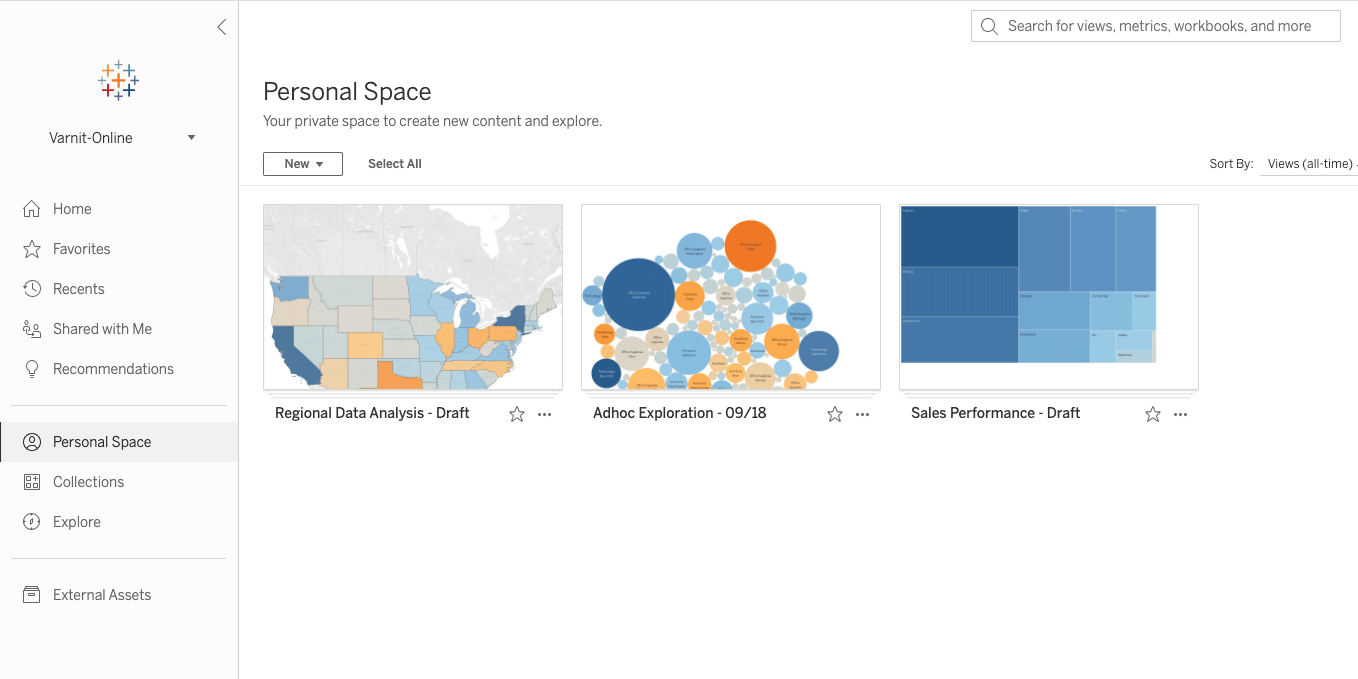
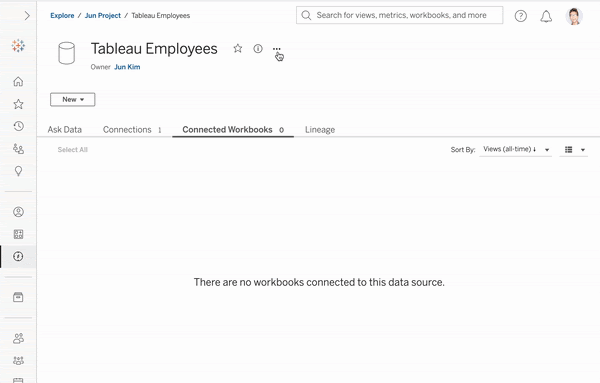
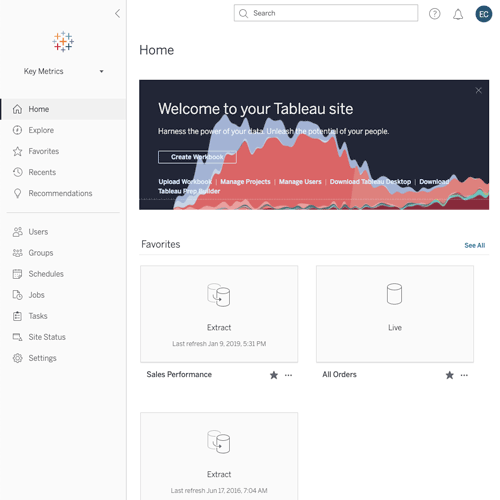
Personal Space
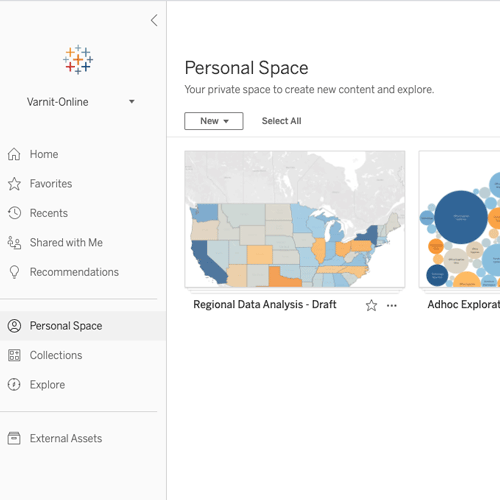
Personal Space is a new, private location on Tableau Server and Online where users can save content before it’s ready to be shared with others. Users can feel comfortable exploring data and staging workbooks in their own dedicated space, and admins no longer need to create private projects for every individual to achieve this on their site. Personal Space is available to any user with an Explorer or above license.
Tableau 2021.3 Feature Overview
Tune in for an overview of all the new features included in this release.
Watch nowLearn more about our features and Tableau Conference
All Features
2021.3

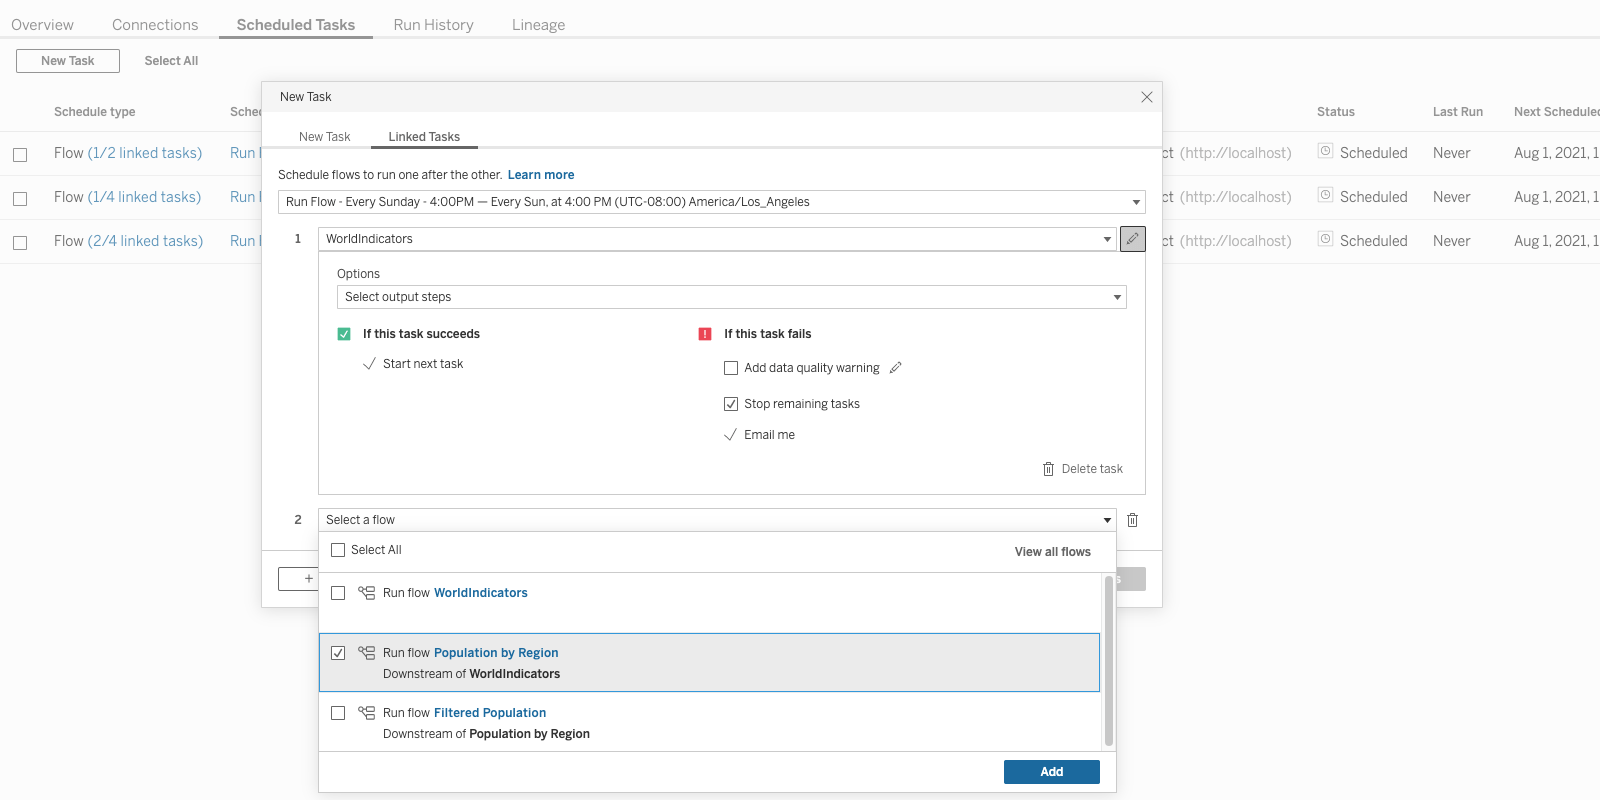
Linked tasks with Tableau Prep Conductor
With Linked tasks in Tableau Prep Conductor, you can now schedule flows to run after one another on Tableau Server. Easily automate the orchestration of multiple flow jobs, ensuring they happen in sequence after each task completes successfully.
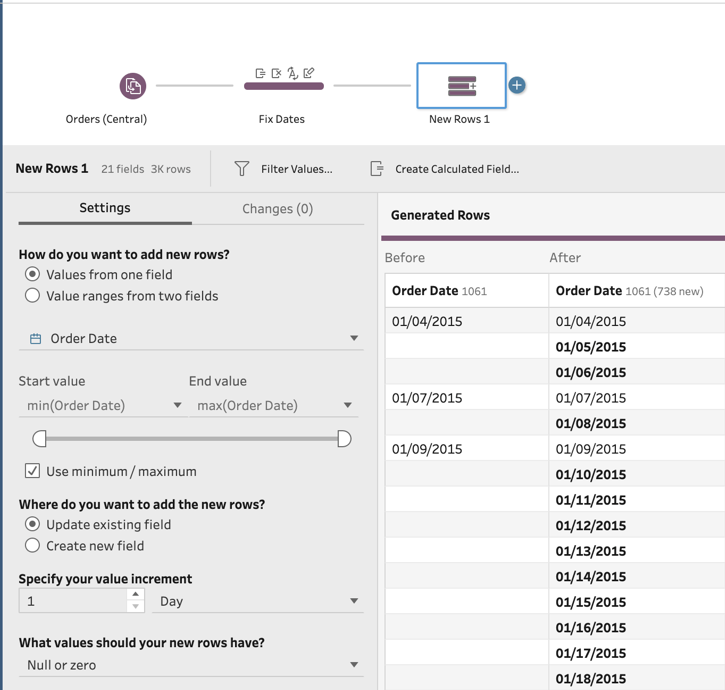
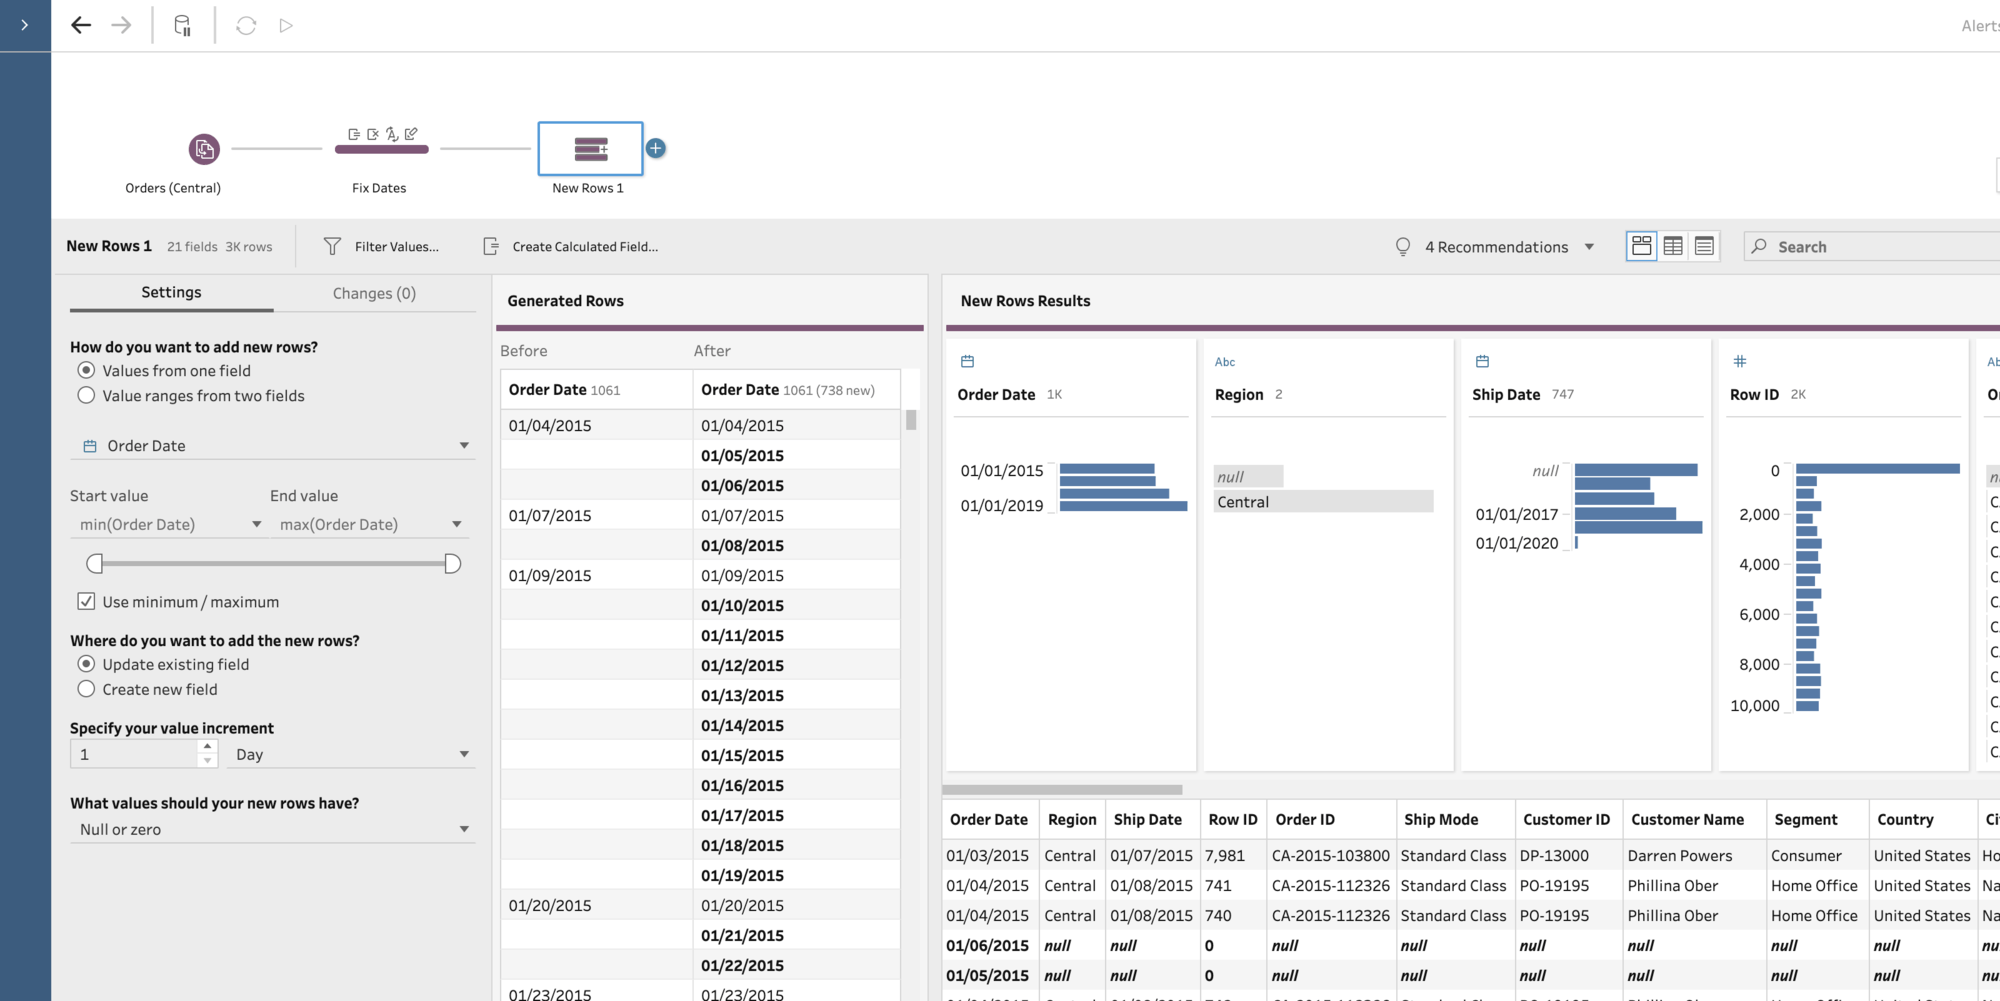
Generate rows with Tableau Prep
Generate a set of missing rows in a table with Tableau Prep based on dates, date times, or integers. Easily fill gaps in data to ensure downstream processes have full and complete datasets to work on, and build more accurate visualizations.
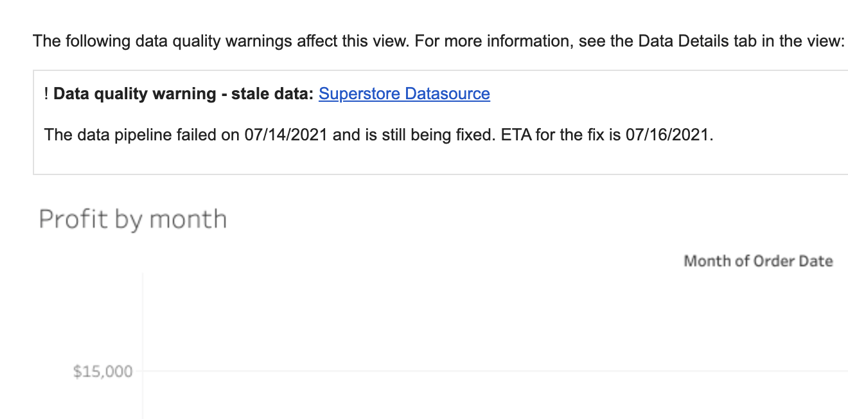
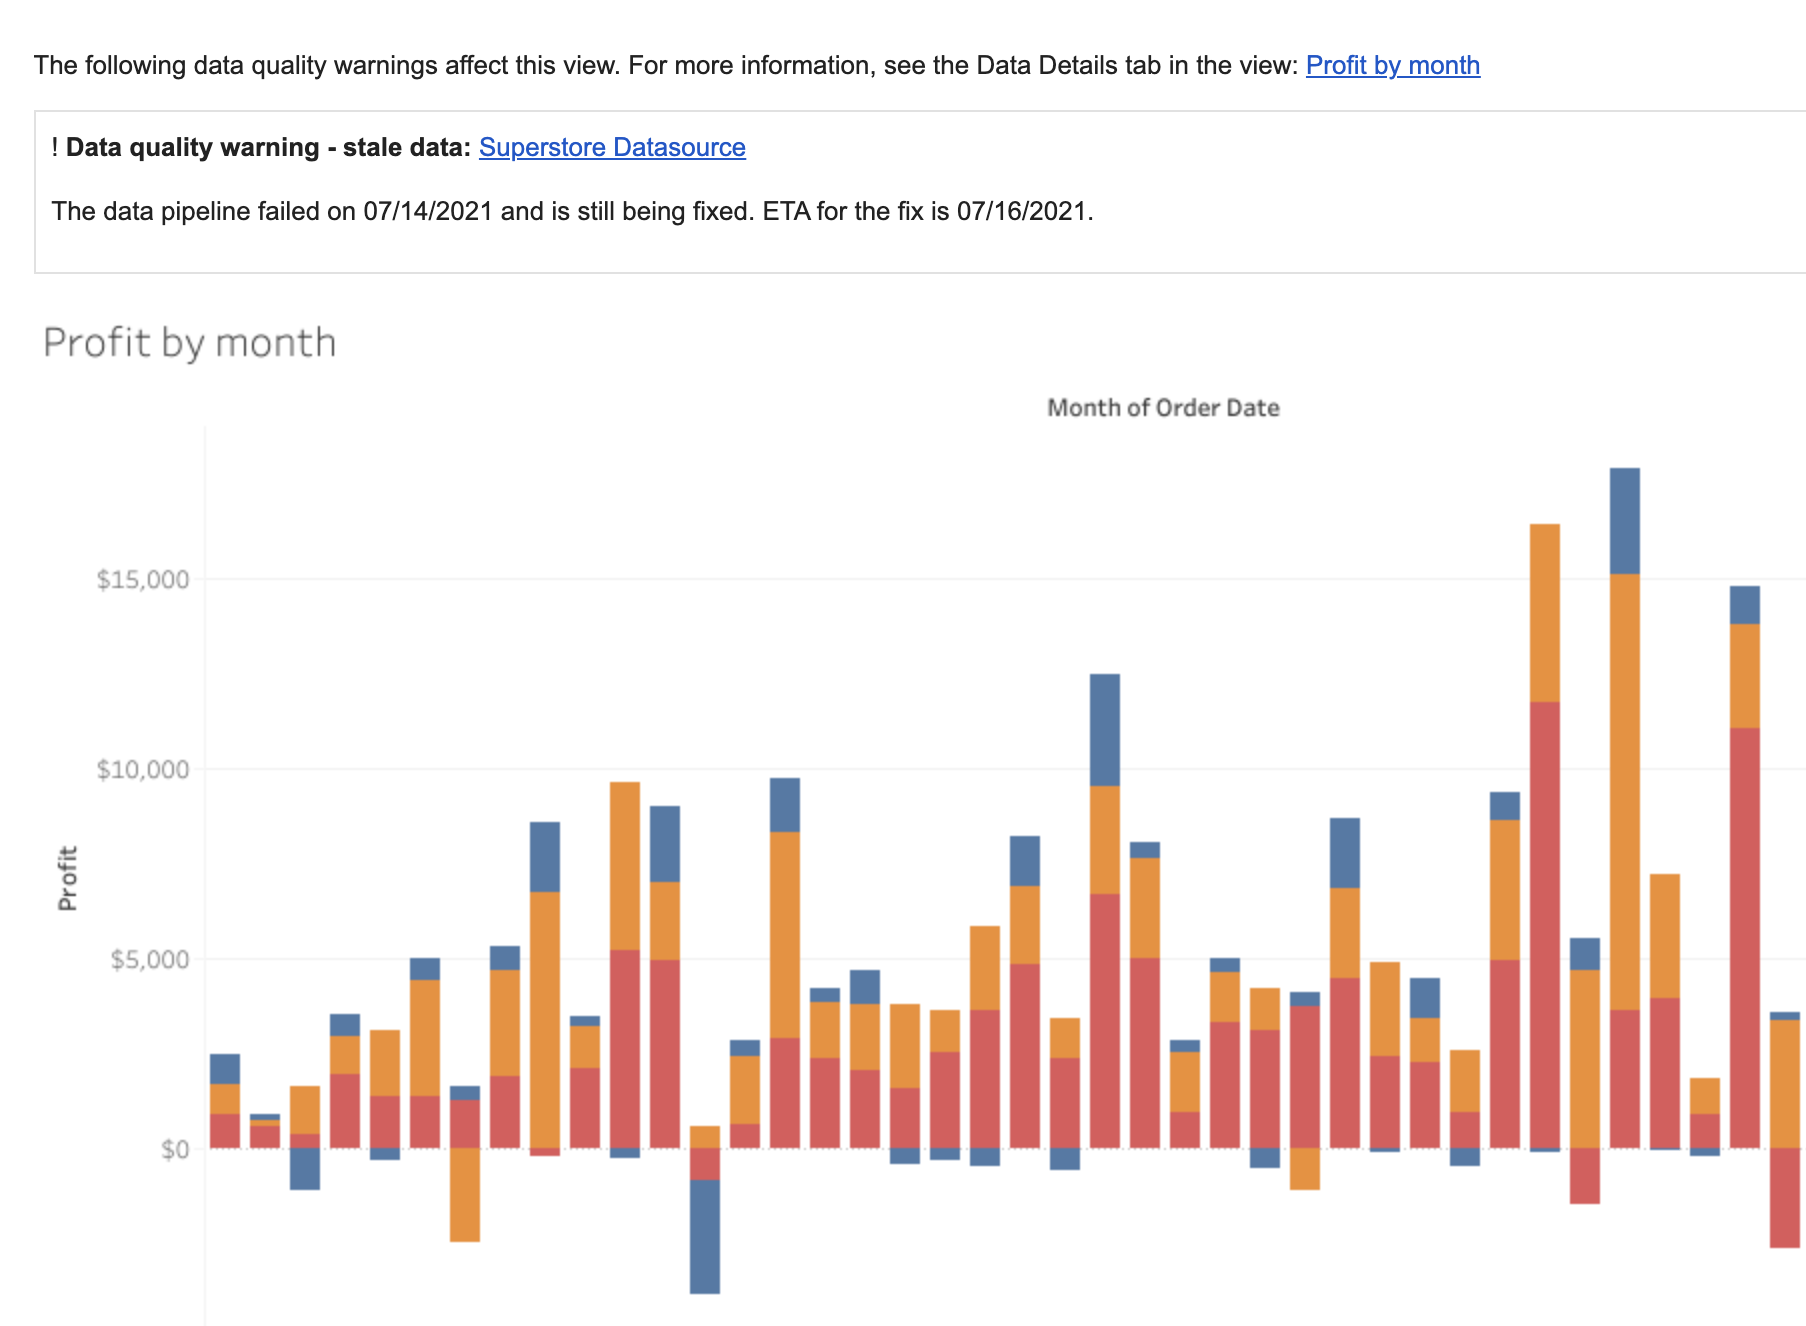
Data quality warnings in subscription emails
Get notified about potential issues with data through Data quality warnings (DQW) directly in email subscriptions. Simply click on the link in the email to go directly to the dashboard impacted by the warning, and see additional details right away within the Data Details panel.
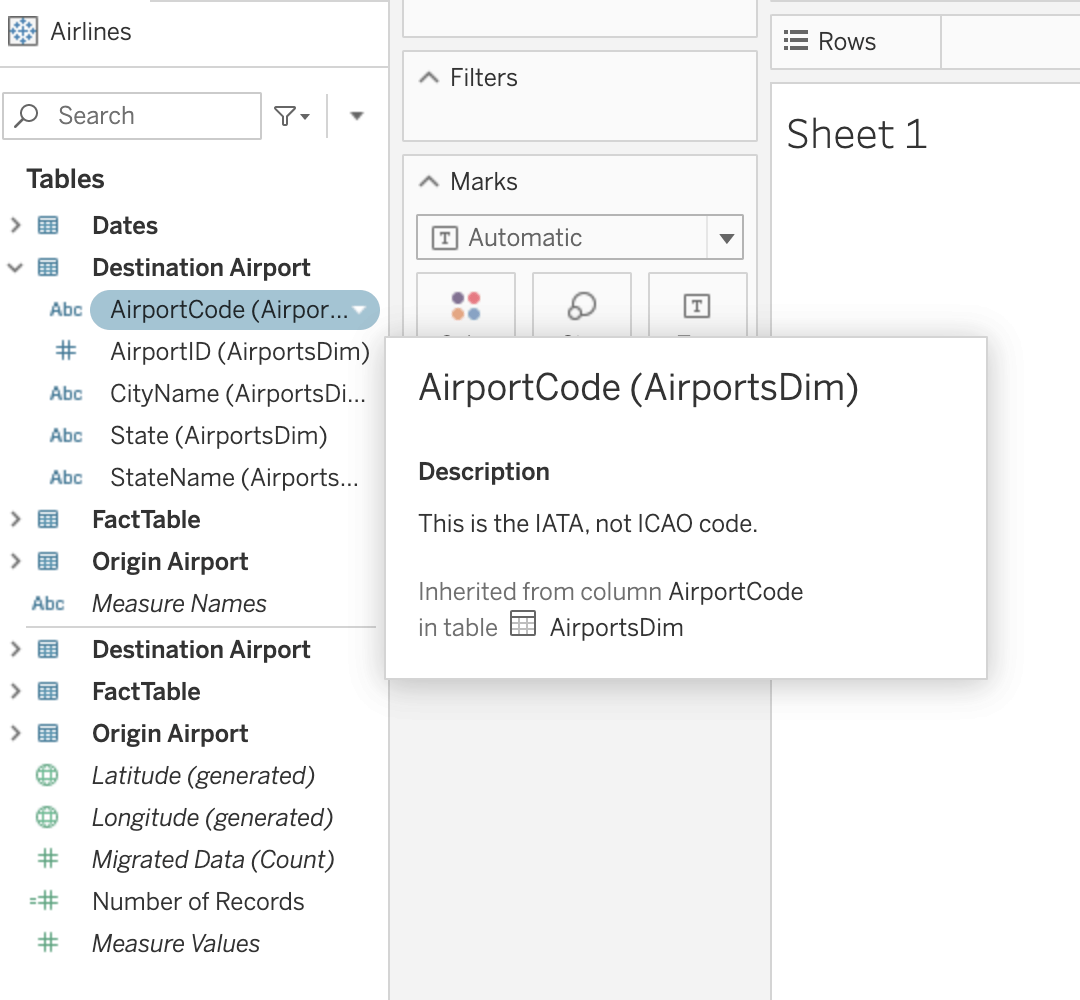
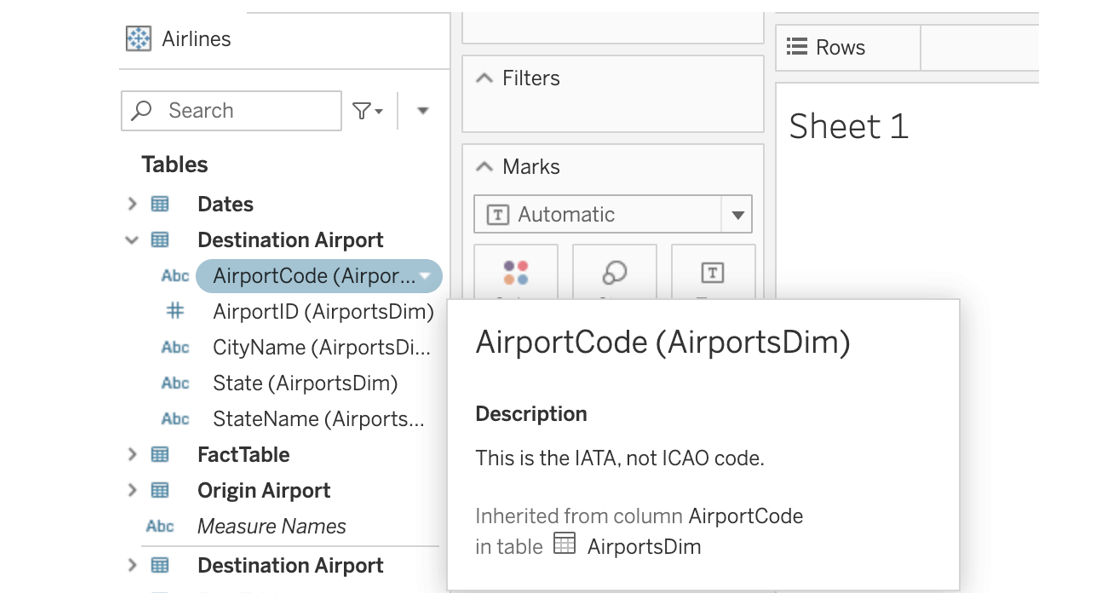
Inherited descriptions in web authoring
With Tableau Catalog, you can now see inherited descriptions right within your web authoring flow. If a description for a field or a column exists upstream from that field or column in a data source or a workbook, you'll be able to see information about where the description is inherited from.
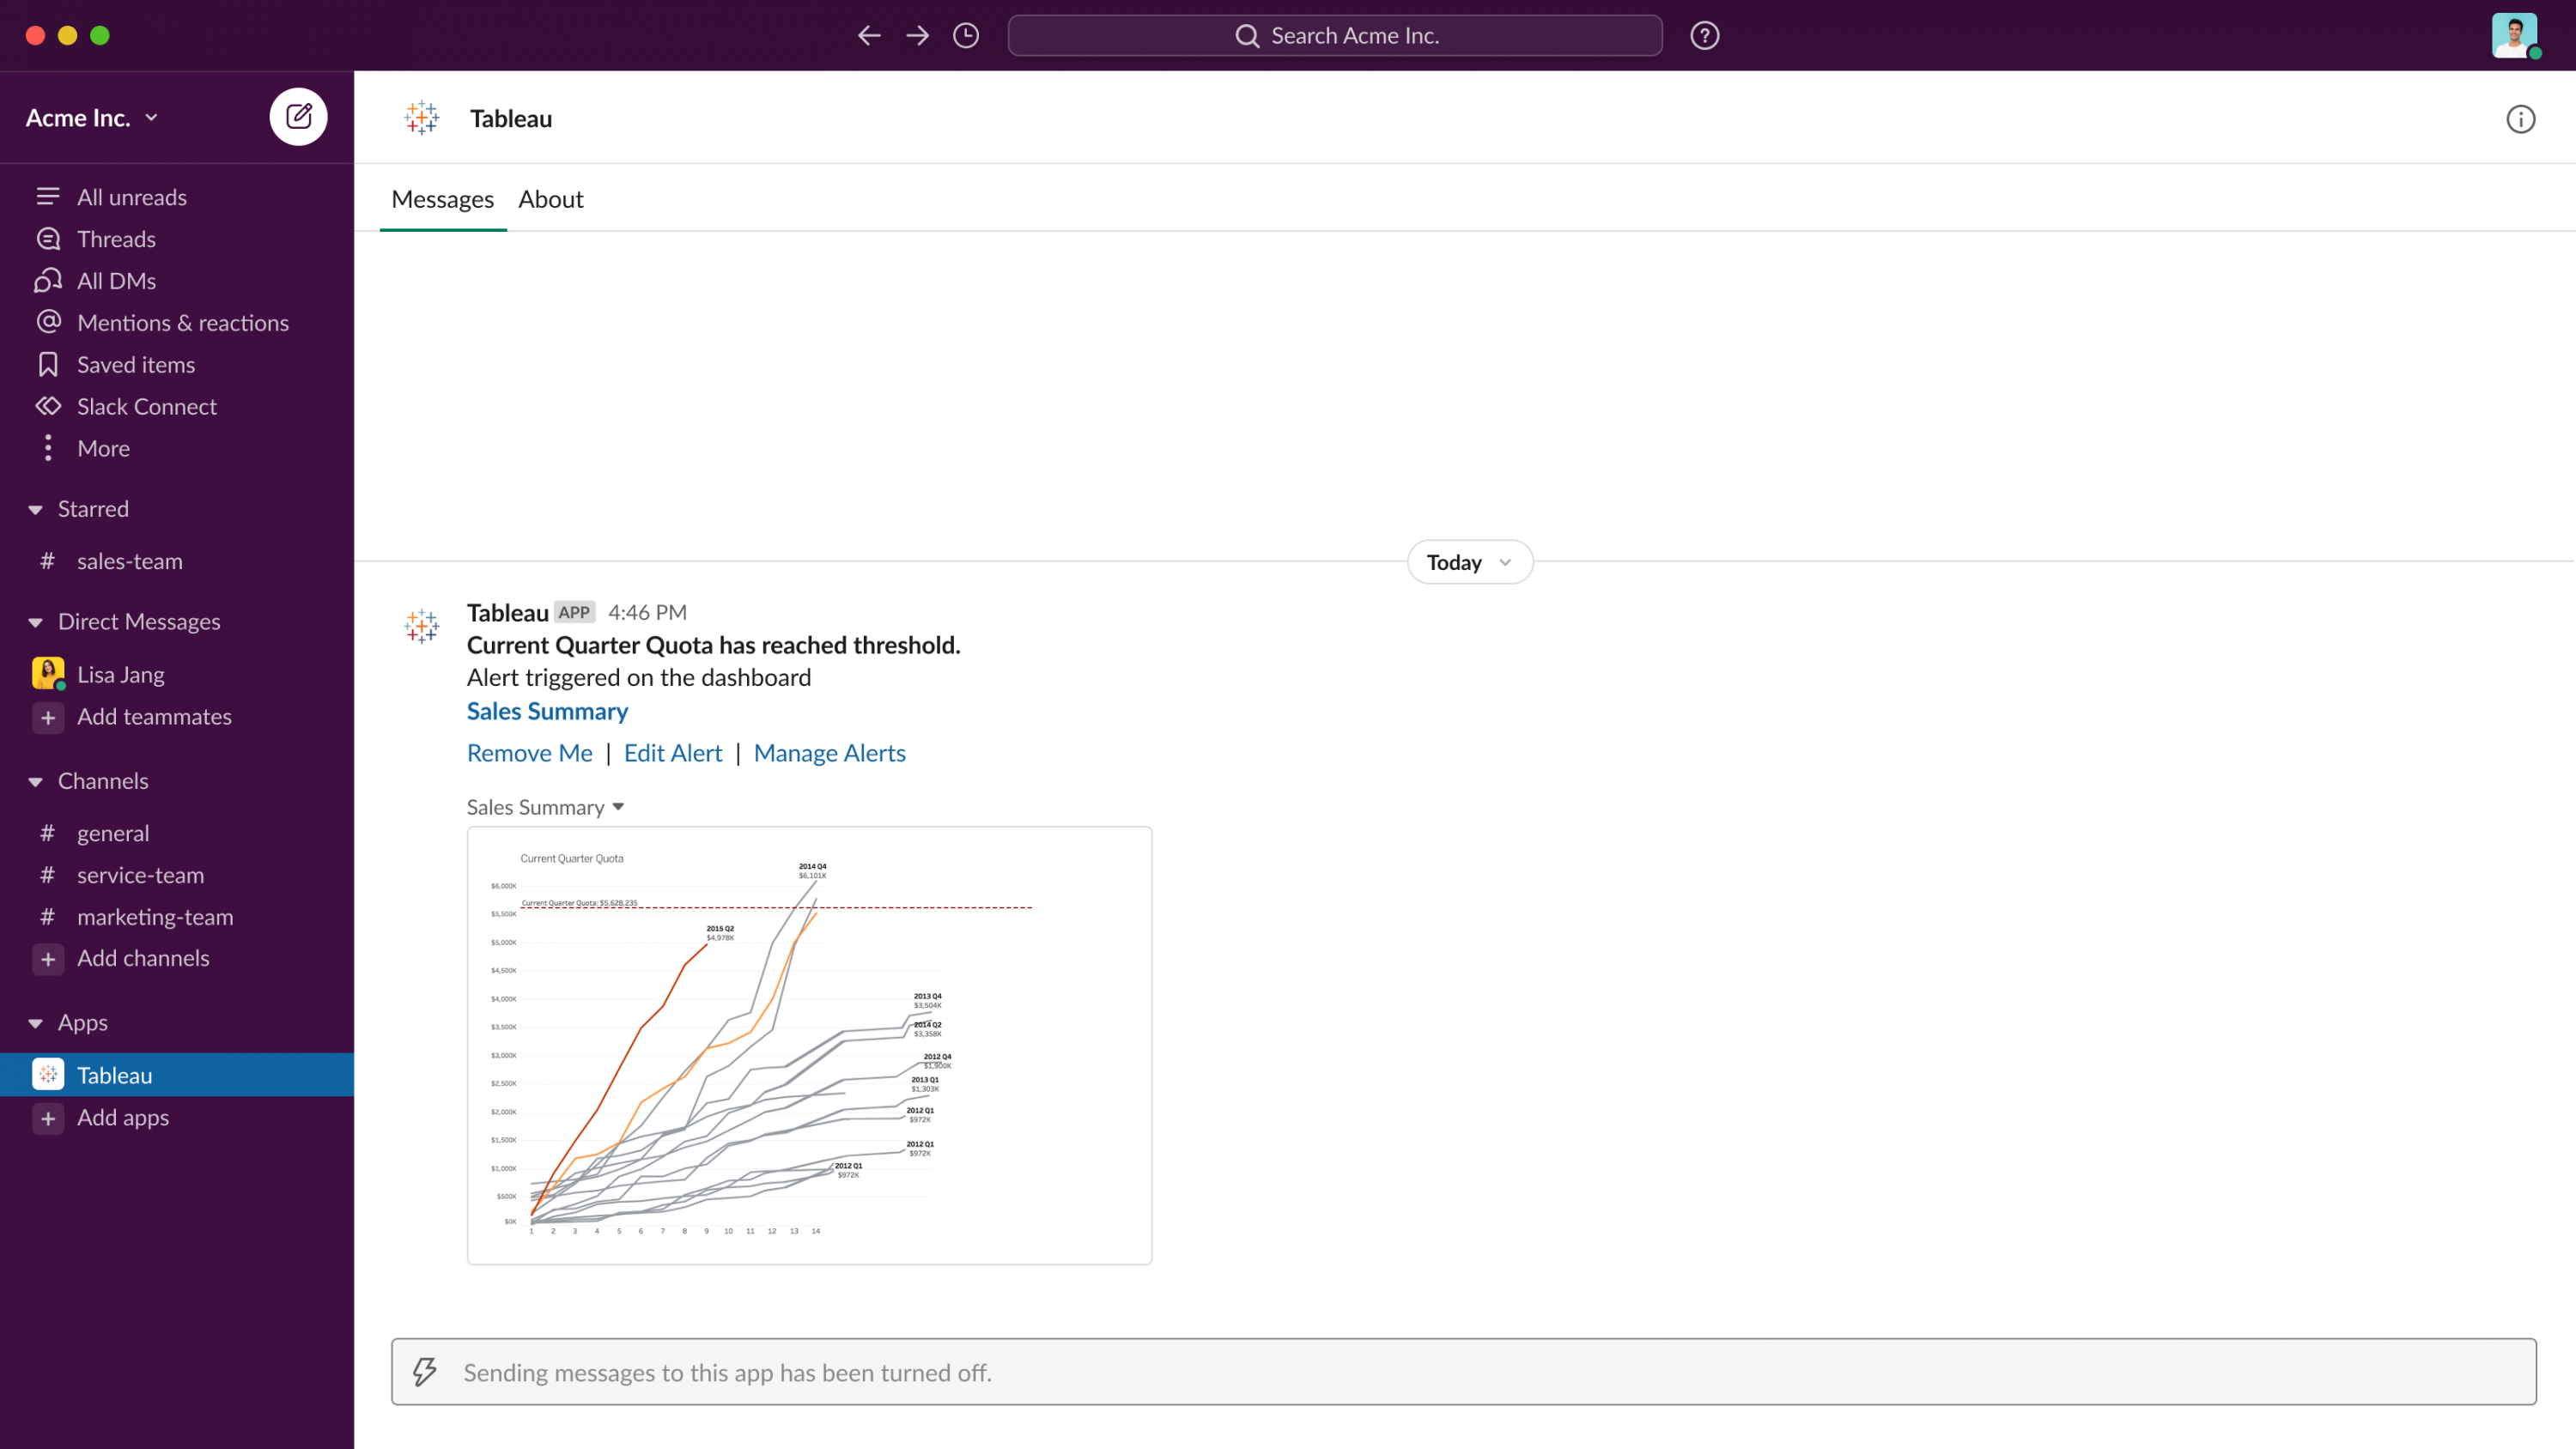
Tableau Notifications in Slack
With Tableau for Slack, you can stay up to date on all of your data from anywhere. With our new product integrations, you can now get notified directly in Slack for data-driven alerts, when you are @mentioned in a comment, or when someone shares content with you in Tableau.
Personal Space
Personal Space is a new, private location on Tableau Server and Online where users can save content before it’s ready to be shared with others. Users can feel comfortable exploring data and staging workbooks in their own dedicated space, and admins no longer need to create private projects for every individual to achieve this on their site. Personal Space is available to any user with an Explorer or above license.
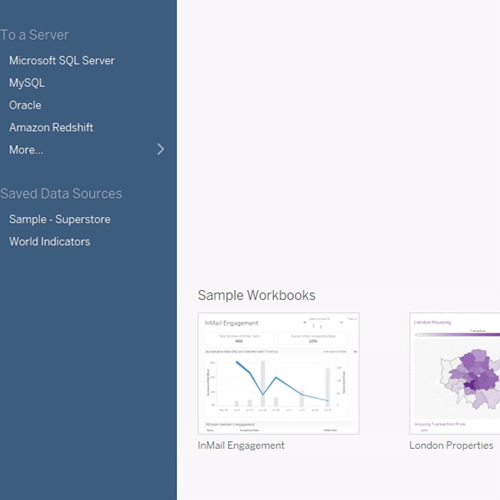
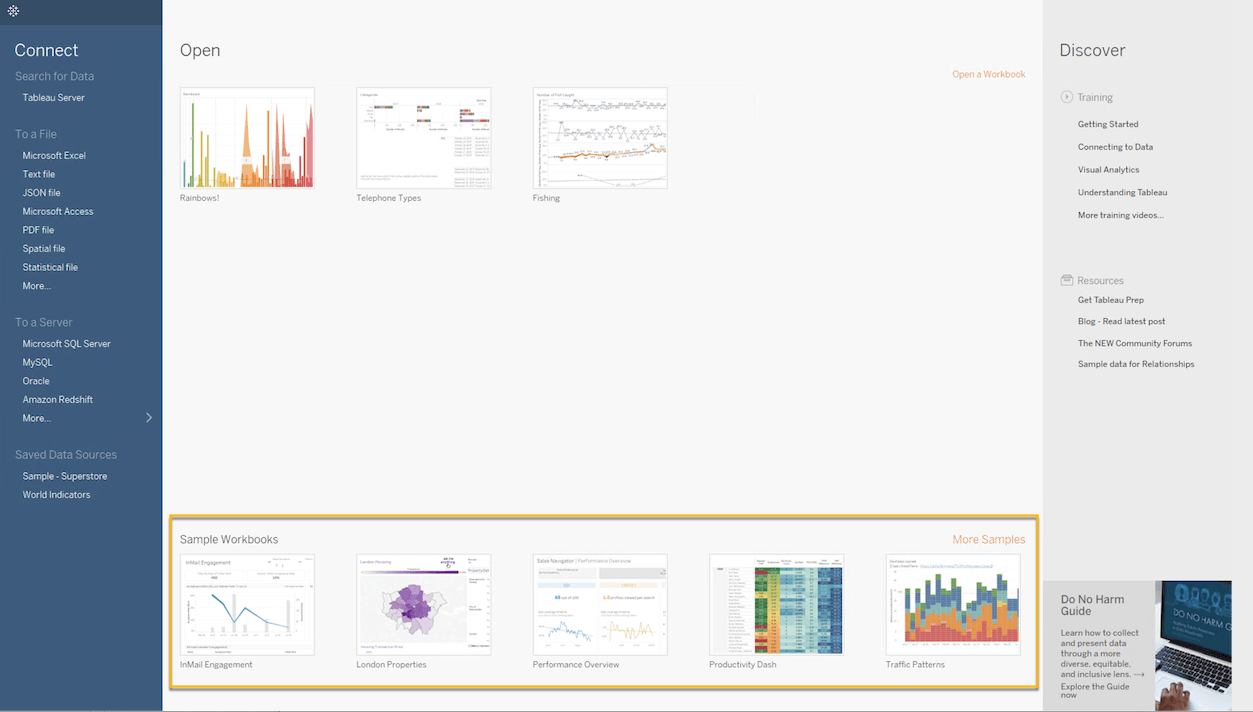
Custom sample workbooks in Desktop
Provide curated and useful workbooks to your users as soon as they open Tableau Desktop. You can now customize the set of workbooks you want to display in the samples area of the Desktop start page, so that users can easily see and access relevant content—such as a workshop or other events happening that week. If you no longer want to use a custom set, easily switch back to displaying the default Desktop sample workbooks.
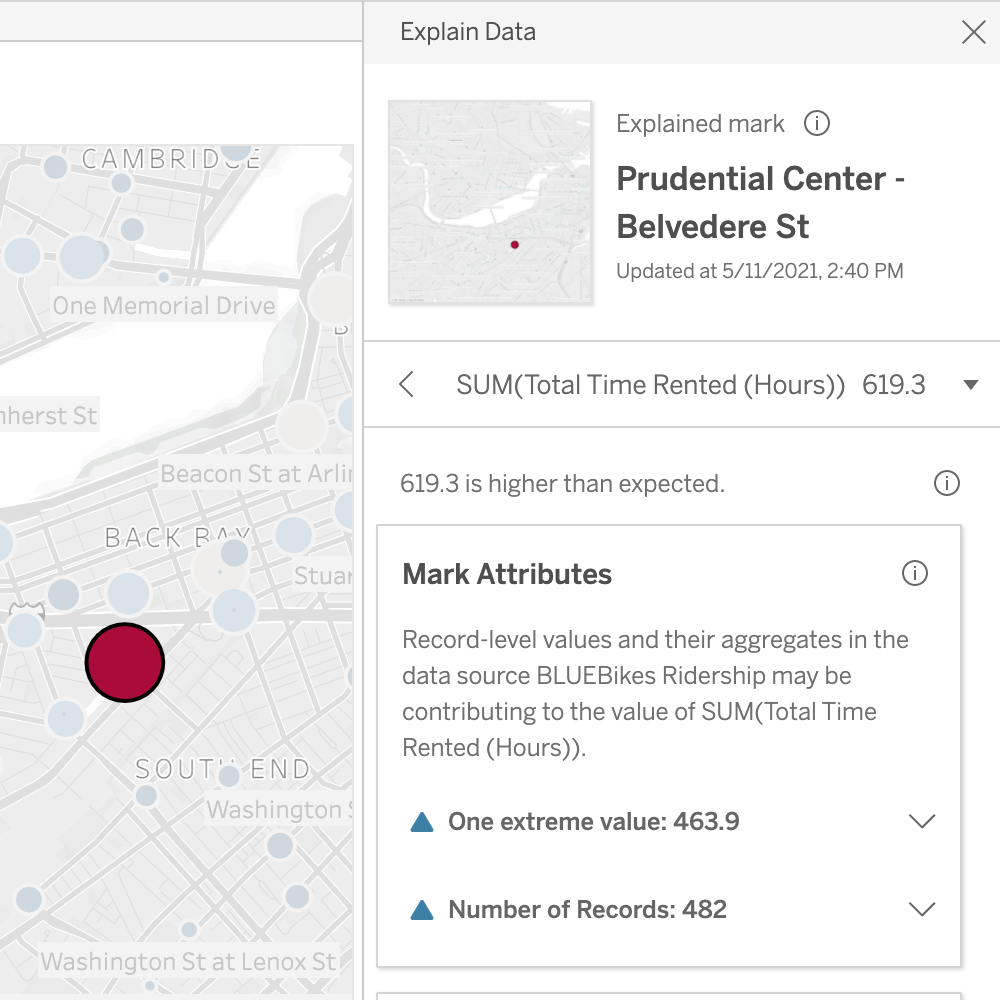
Explain Data Improvements
Since expanding Explain Data to Viewers on Tableau Server and Tableau Online, we've continued to improve the experience by refining permissions and explanation types. Site administrators now have the flexibility to choose when to enable or disable Explain Data features on their site. We've also added a new explanation type about missing data to help users understand they the values of certain marks are beyond the expected range.
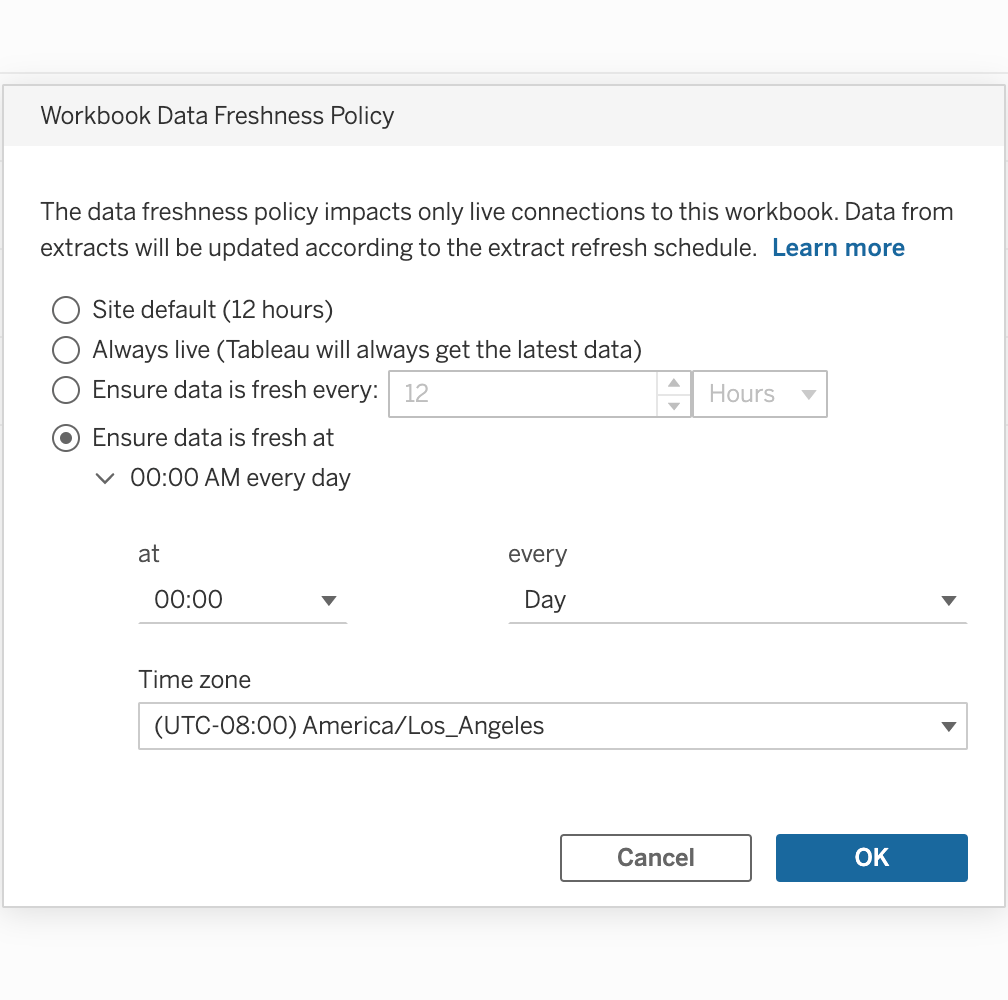
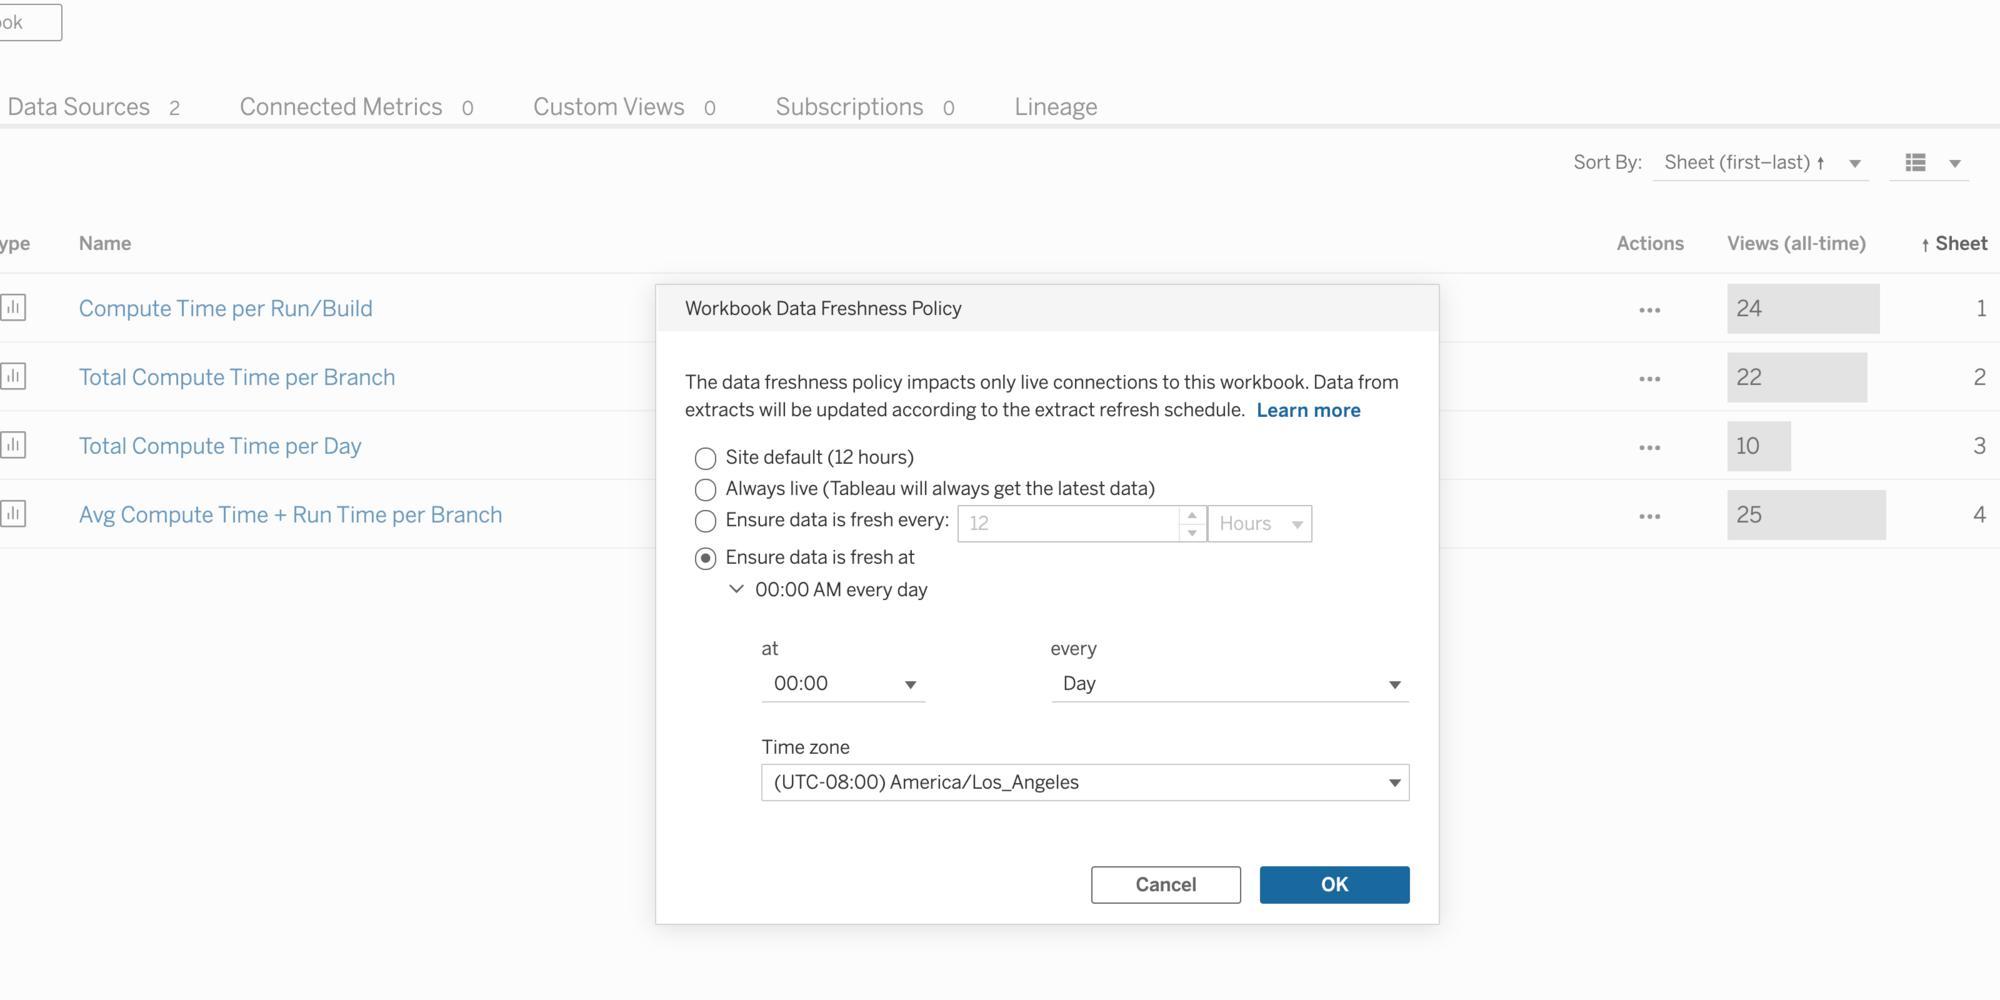
Data freshness policy
Control the age of the data shown to workbook viewers by setting a freshness policy that will not load any cached data older than the set policy. Easily choose from multiple policy options to ensure that workbooks with live data sources never have unexpectedly stale data.
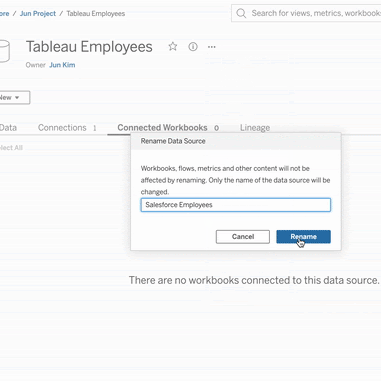
Rename published data sources
Rename any published data source directly in Tableau Server and Online from the data source page or by using Tableau’s REST API—just as you would rename a workbook. All workbooks that use the published data source will receive the new name on the next data source refresh.
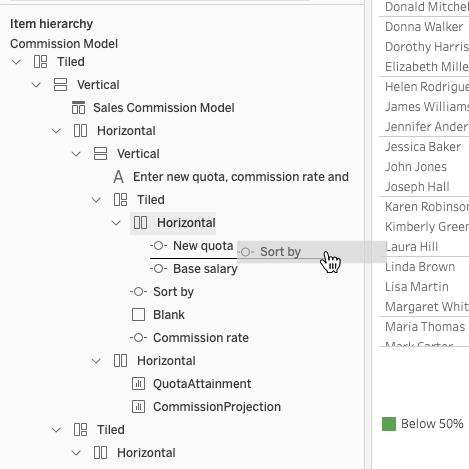
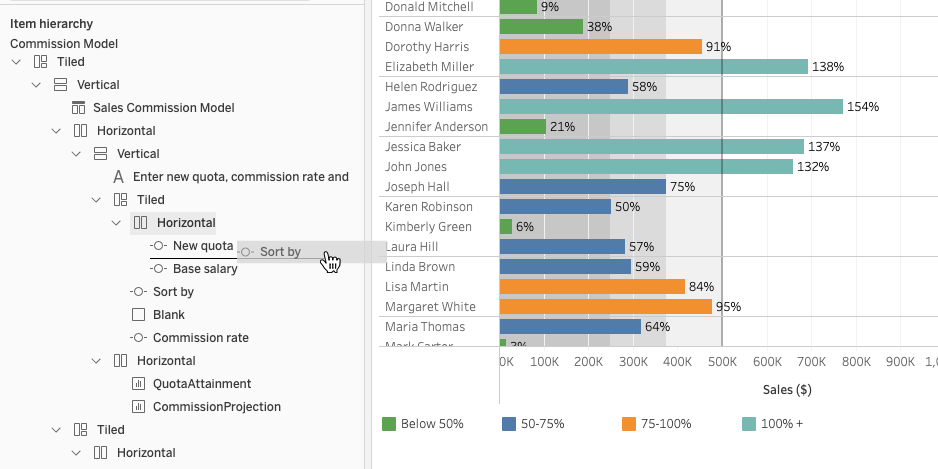
Item hierarchy drag and drop support on the web
Build dashboards using the dashboard Item Hierarchy in web authoring, enabling you to choose how vizzes and other items are layered and arranged in layout containers. You can now drag and drop to move, reorder, and containerize dashboard items in the hierarchy instead of in the dashboard itself.
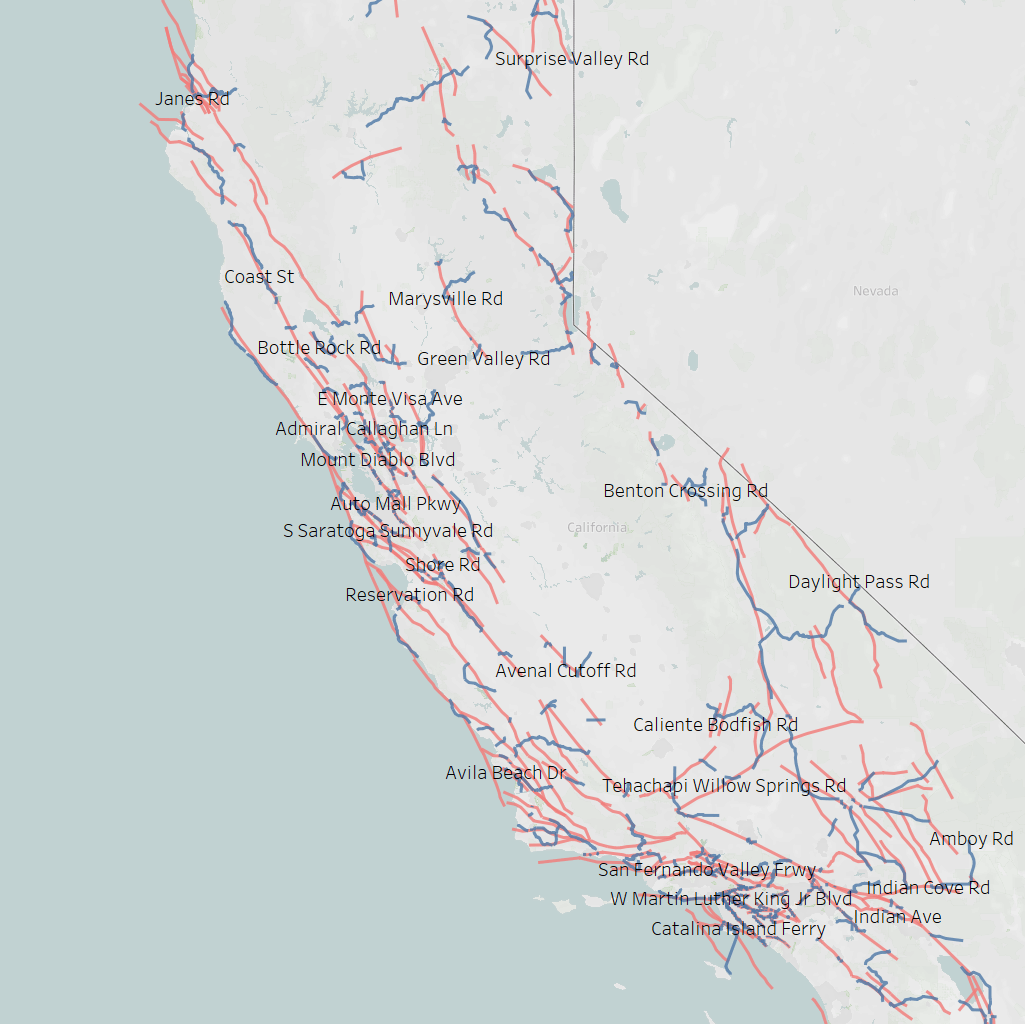
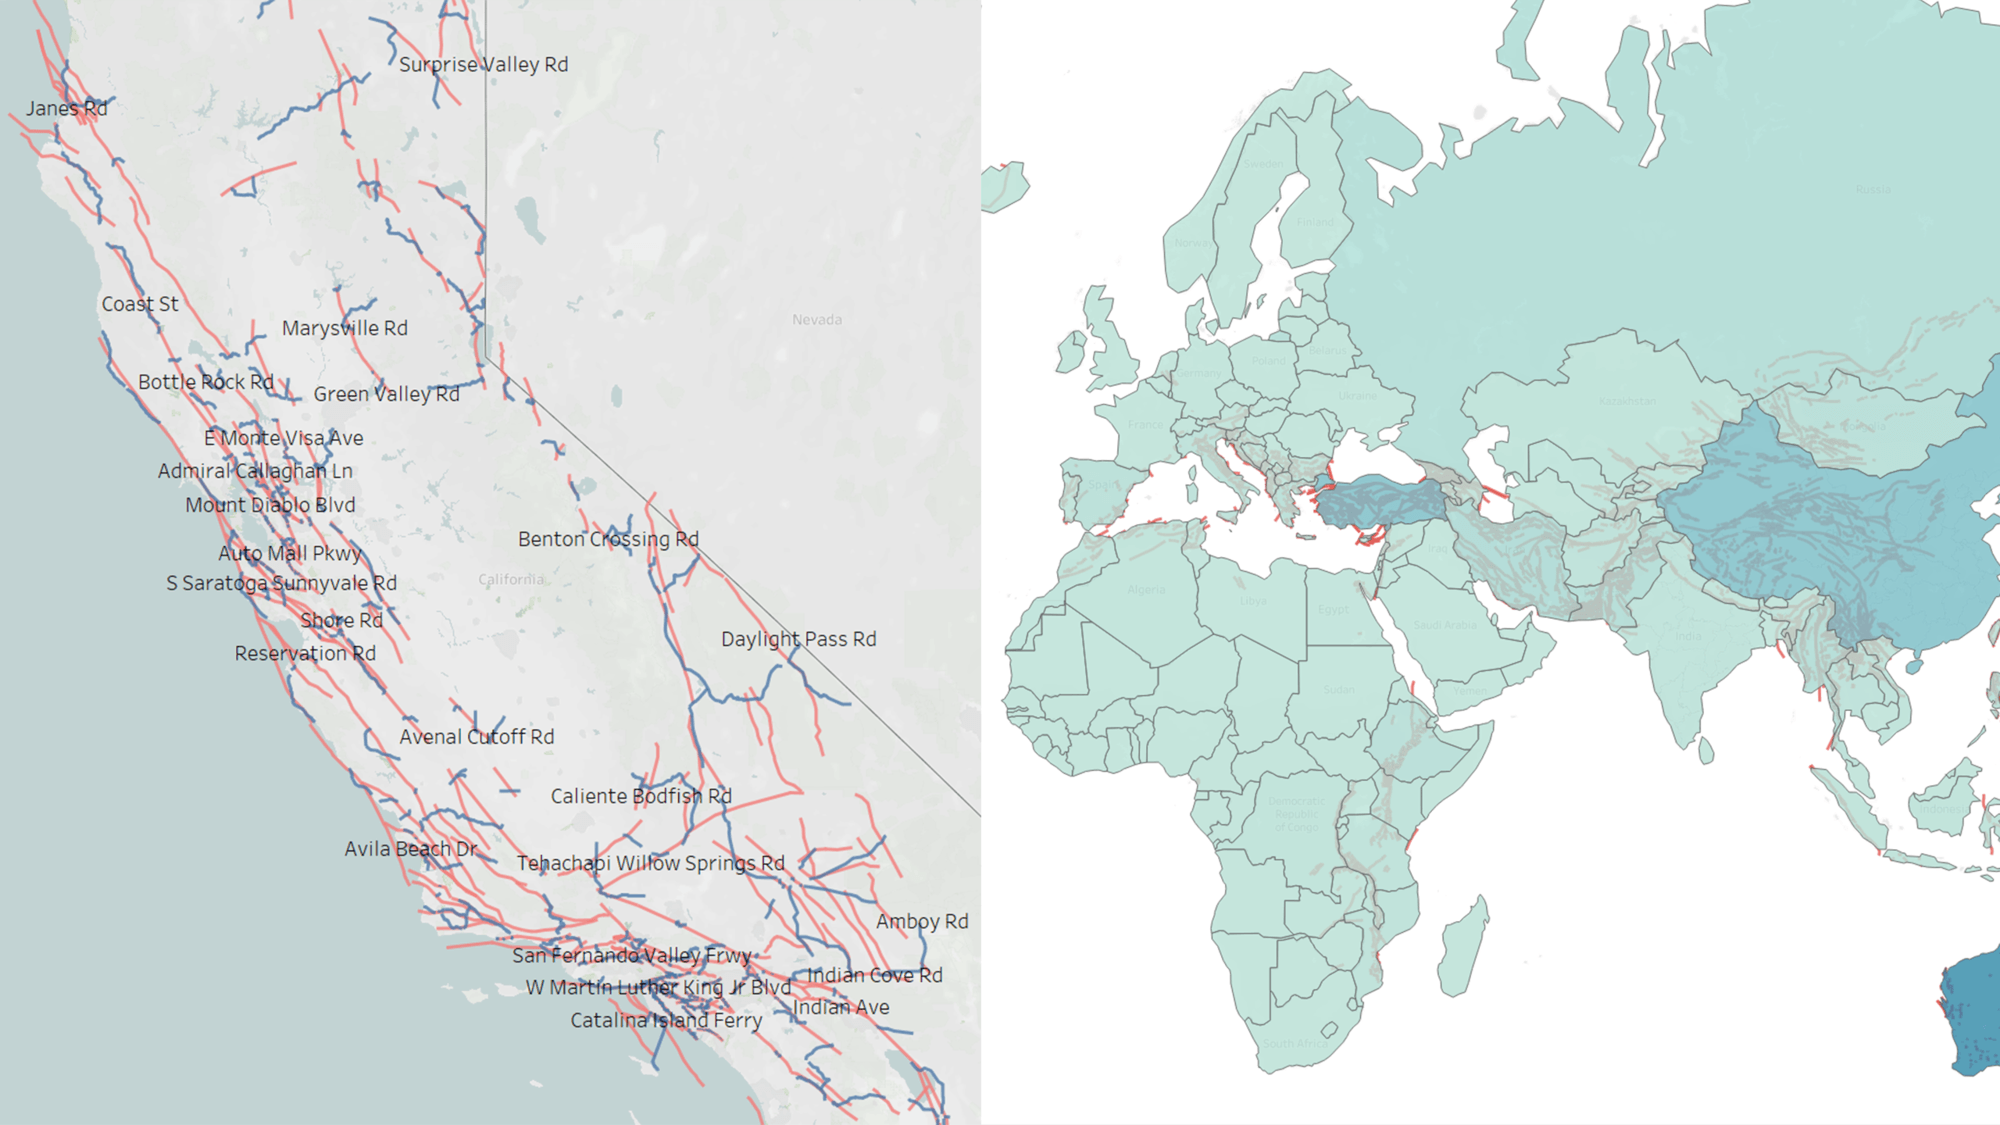
Spatial join improvements
We’re making spatial joins more powerful to unlock new ways to explore your geospatial data. When first released, spatial joins could only be used between point and polygon geometries. Now, we’ve expanded support to other combinations: polygon/line, polygon/polygon, and line/line to allow for a more complete and advanced analysis of your data. In this example, a line/line spatial join is being used to intersect one dataset that has major CA highway networks (as lines) and a dataset that has fault lines (also lines). This helps us understand which highway networks are particularly susceptible to seismic activity, since they directly intersect a fault line. With a line/polygon join, this can also be visualized on a state or country map.
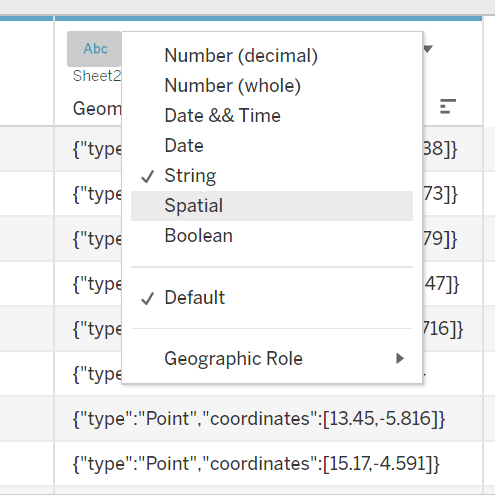
WKT support and GeoJSON conversion support
To enable even more users to perform spatial analysis in Tableau, we've added more WKT and GeoJSON support to Tableau. Easily translate WKT and GeoJSON text markup found in Excel and CSV data sources directly into usable spatial geometry in Tableau.
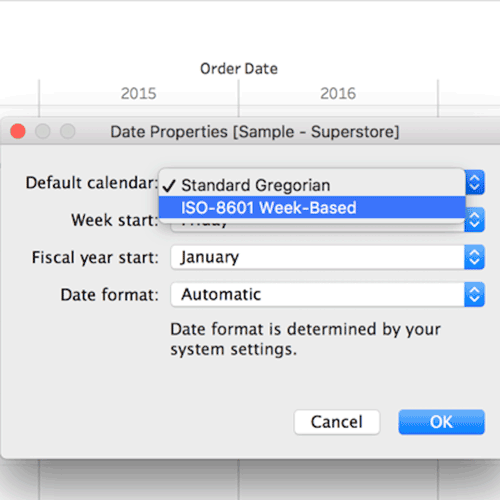
ISO-8601 calendar support improvements
We're expanding ISO-8601 support to more and more databases. This release we've added support for the DB2 connector.
Improved web authoring capabilities
New Workbook Formatting Pane
With the new workbook formatting pane, you now have the ability to format your visualizations and dashboards while authoring on the web.
Drag to Reorder Single Legend
The new Drag to Reorder Legends features enables you to reorder single legends while in authoring mode.
New Browser Formula Authoring Capabilities
You can accomplish solving data problems with even the most advanced filtering requirements from the web by authoring your own formulas.

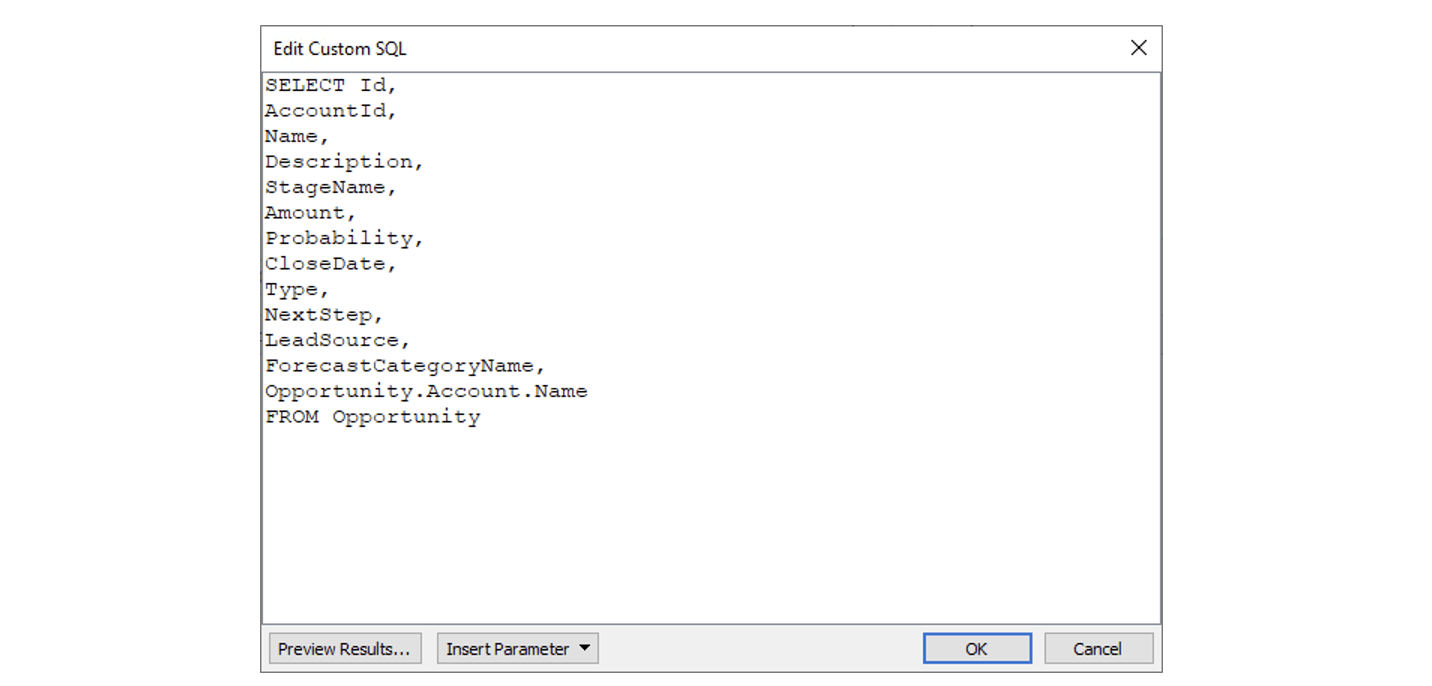
SOQL Relationship Queries
When connecting to Salesforce data using custom SOQL, you can now access multiple objects at once using SOQL relationship queries. Easily pull fields from multiple objects in a single query.
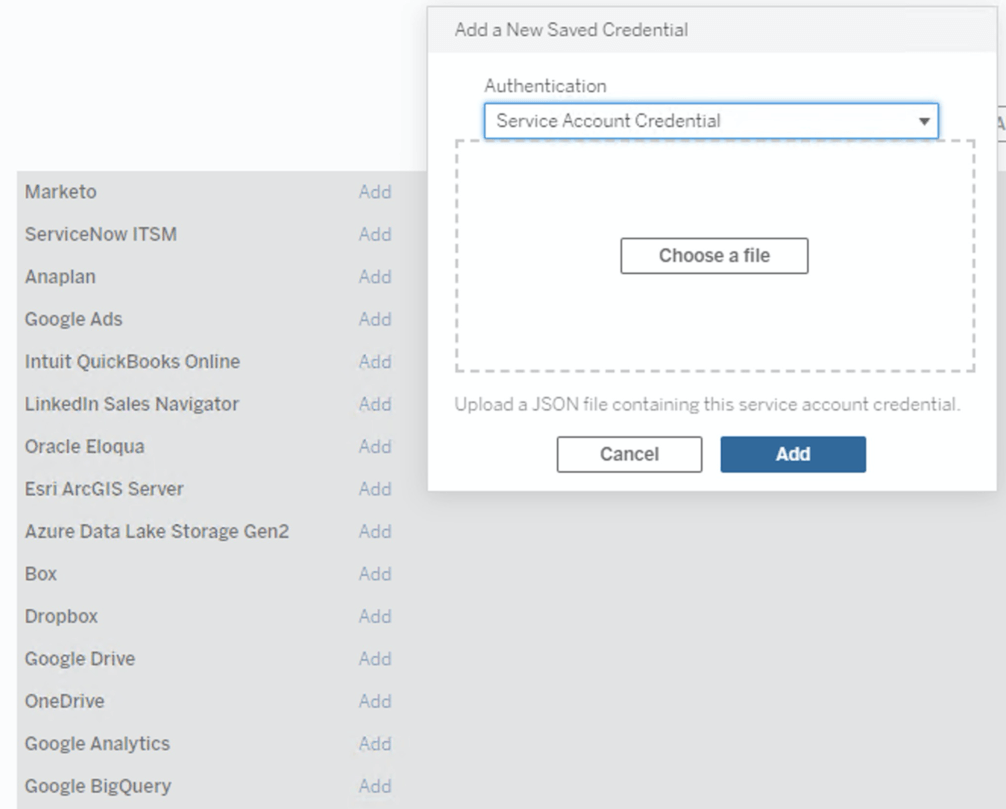
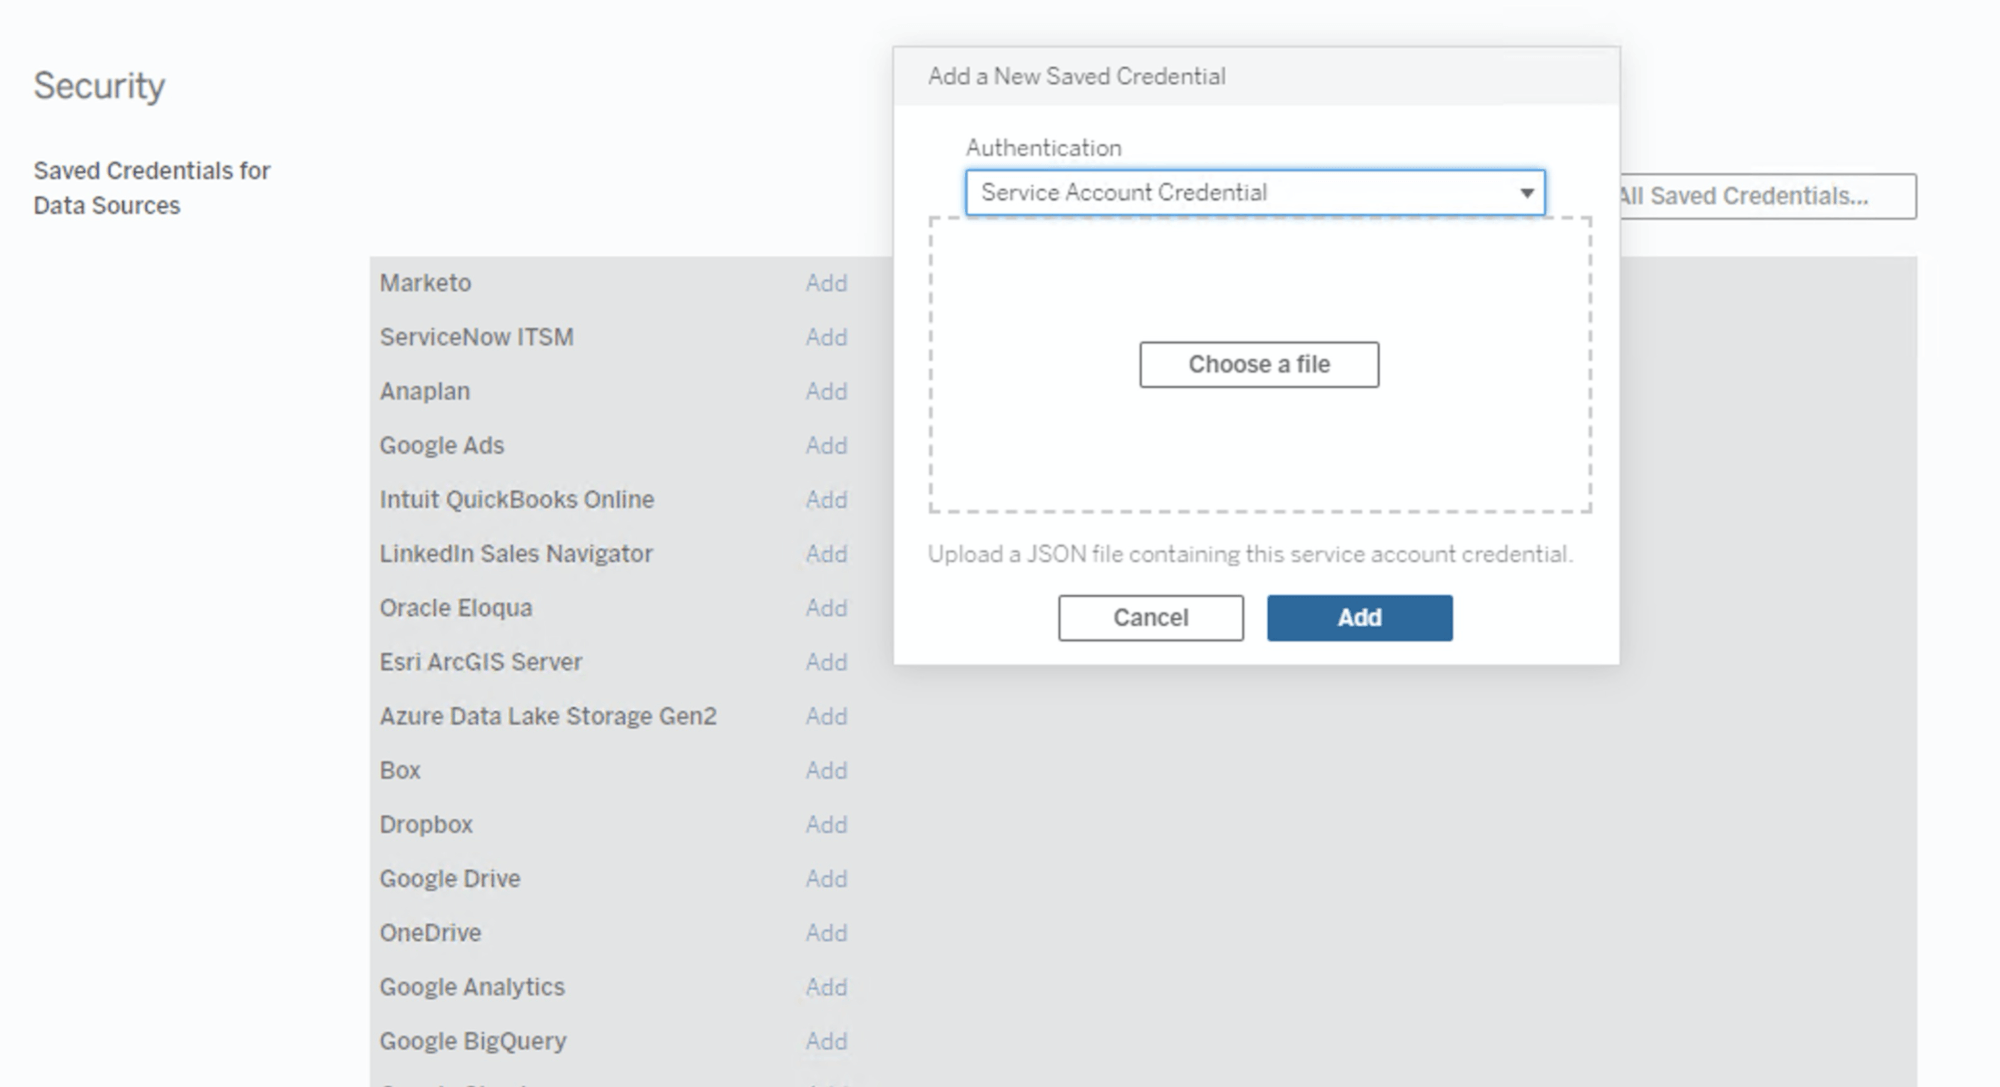
New ways to connect to Google BigQuery
Use Google Cloud Service Accounts to securely create and manage your connections to Google BigQuery at scale.
Tableau Mobile improvements
Unified notifications on Tableau Mobile
Enjoy an improved notification experience on Tableau Mobile. Simply navigate to the new notifications tab in the app to see your shares, comments, extracts, and prep flows all in one place, consolidating all of the important changes across your organization.
Tableau Mobile for Blackberry and Airwatch (Android)
Tableau Mobile for Blackberry and Airwatch is a new app that provides a quick and secure way to view, analyze and leverage the data in your organization. The new app includes a newer design that is faster and more intuitive, an improved search and browsing experience consistent with Tableau Server and Tableau Online, as well as enhanced offline capabilities that are quick to load and offer richness and interactivity for visualizations.
Accessibility improvements
Accessibility for dashboard navigation provides a more consistent and intuitive tab order, improving the keyboard navigation experience for everyone who uses their keyboard to navigate dashboards.
Learn More About Tableau Releases