
Explore Tableau Blueprint: Strategy & Teams
Get buy-in, alignment, and participation to orchestrate change
Discovery is critical for gathering the information you need to execute on your organization’s vision for analytics. The better you understand your organization’s requirements, the better you will be able to proactively support the growth of analytics and the broad use of data. Valuable inputs from across the organization will help to guide your analytics deployment and future state—including roles, responsibilities, architecture, processes, and the success measurements to understand progress.
Evolving Your Data Strategy in the Era of AI
AI has disrupted most organizations’ data strategies–bringing in a new era where seeing and understanding data is more important than ever. Watch this webinar to learn how you can prepare your data foundation with Tableau and Salesforce.
Watch now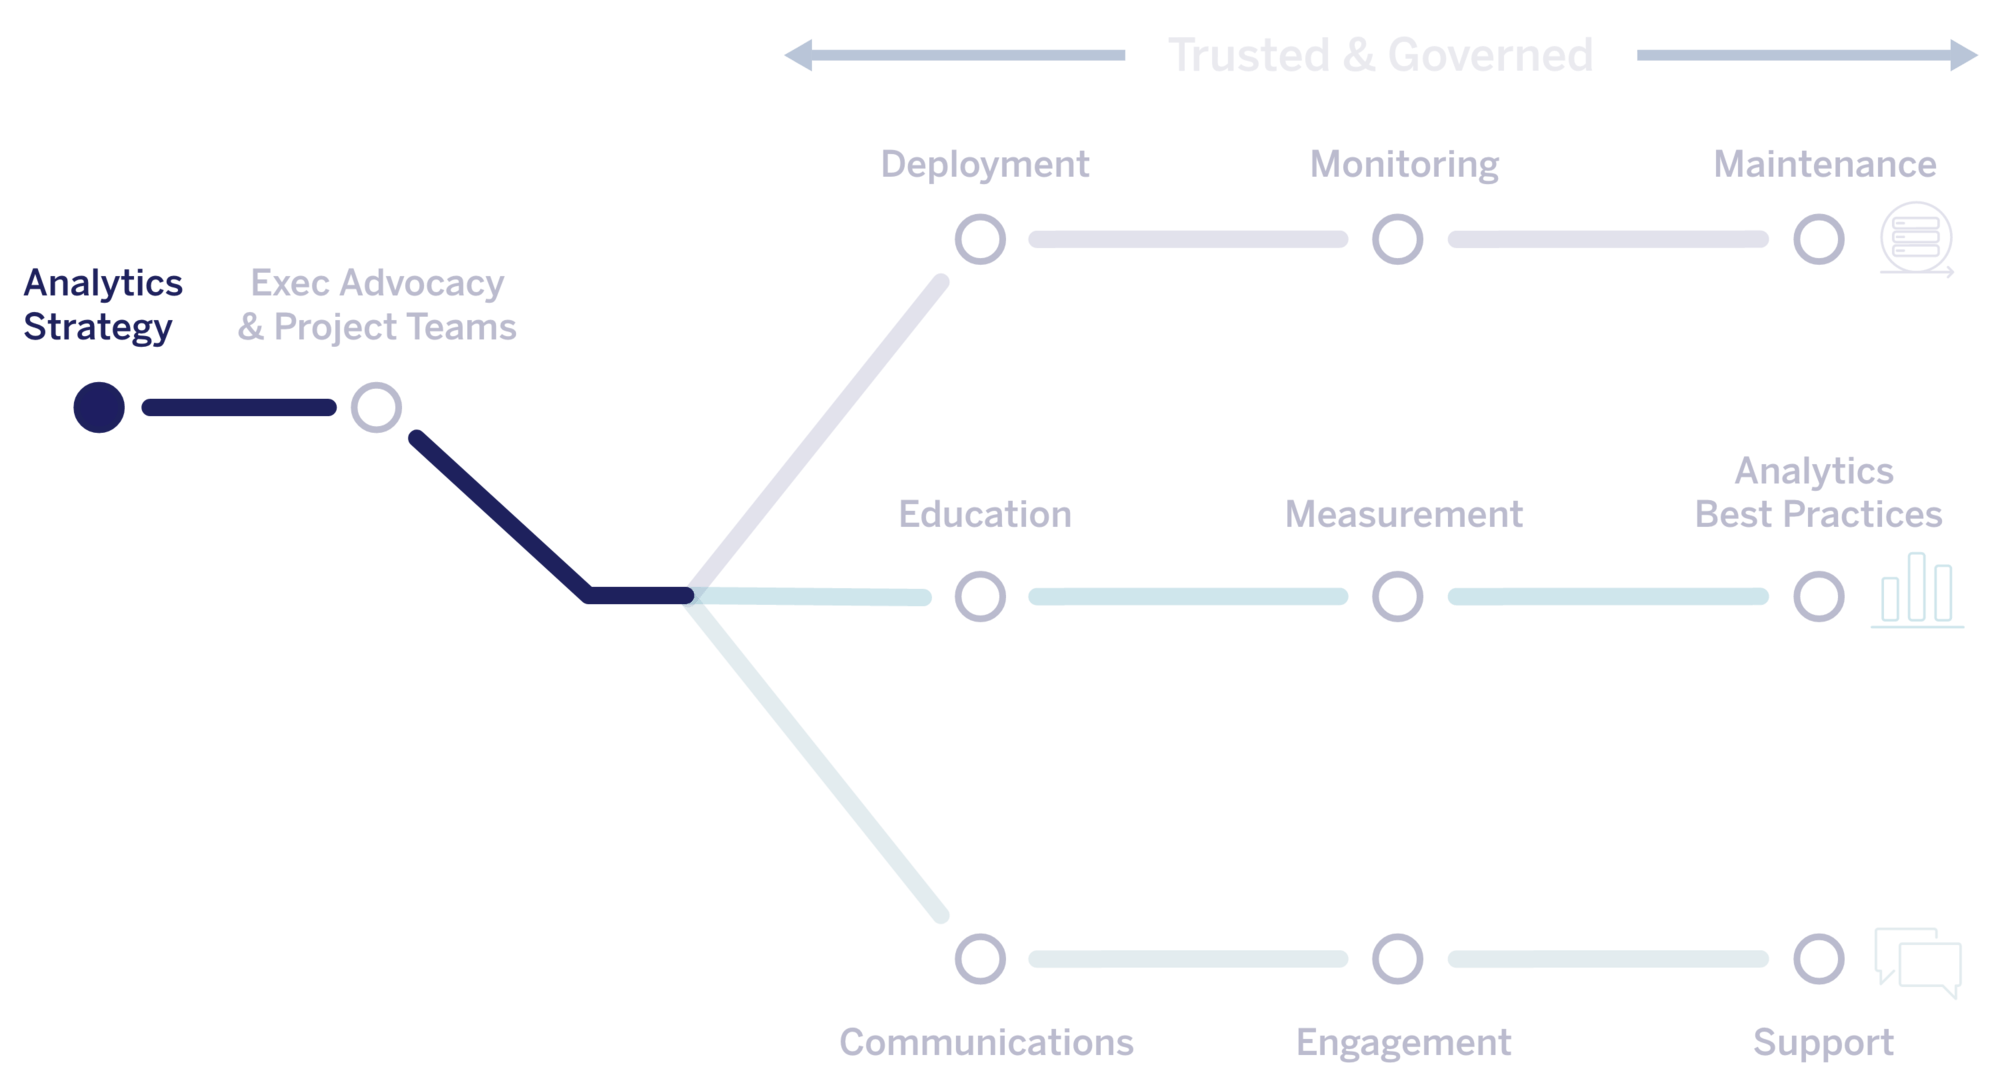
Analytics Strategy
You'll use the Tableau Blueprint Planner in a foundational discovery process to define the current state and vision for your analytics program. You'll gather inputs from across the organization to identify short and long-term goals and align on a clear vision for analytics in your organization. By linking strategic initiatives, metrics, and desired outcomes to data and analytics, you can motivate your organization and drive change.
This topic covers:
- Roles and responsibilities
- Enterprise architecture survey
- Data and analytics survey
- Use cases and data sources
- Education role mapping
- Users
- Community planning
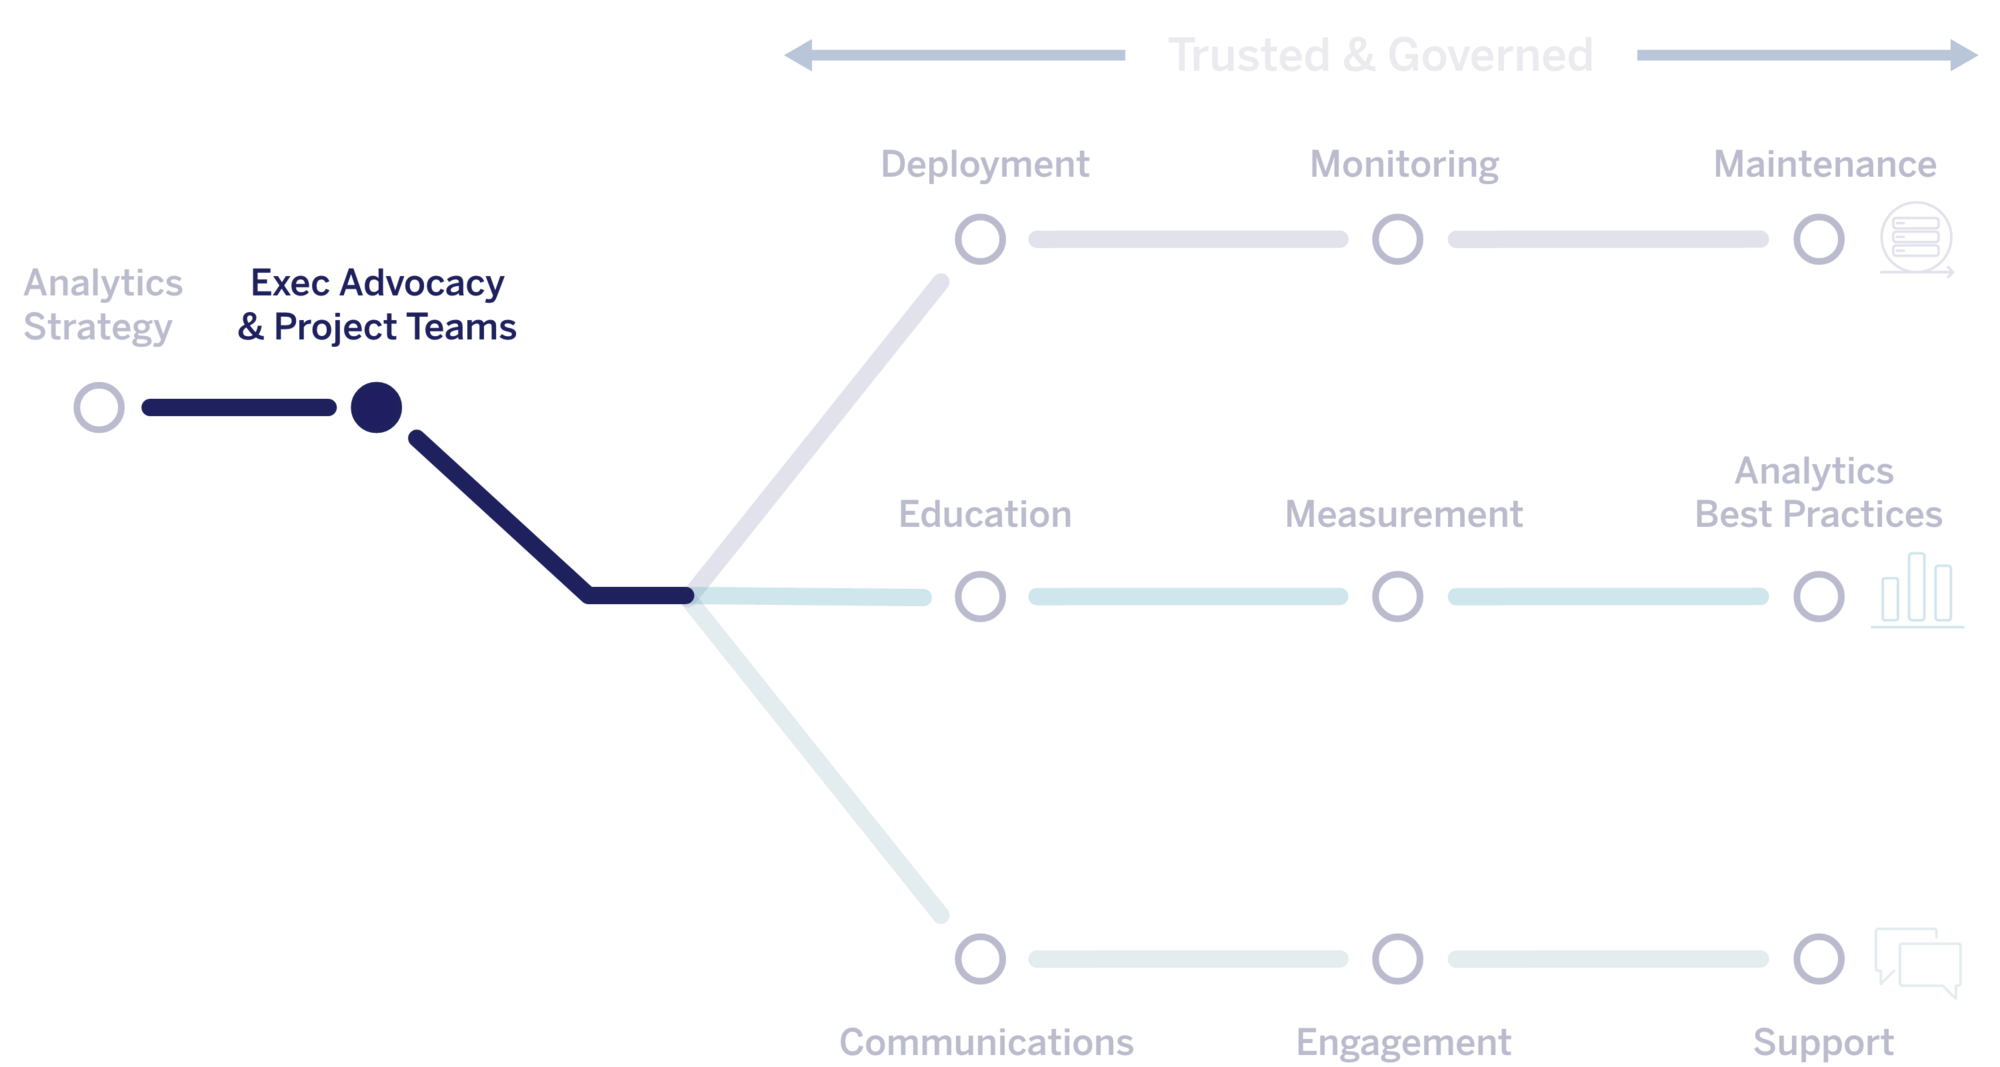
Executive Advocacy and Project Teams
You'll solidify executive sponsors to play an integral role in setting the company's direction and overcoming organizational roadblocks to becoming a data-driven organization. These visible and vocal advocates will work with a cross-functional project team that includes IT and BI professionals, Tableau administrators, and power users across different departments in your organization.
This topic covers:
- Planning and execution
- Defining governance processes, roles and responsibilities
- Establishing user onboarding programs and schedules
- Building your internal community
"Somewhere there has to be a driver for the strategy and there has to be a home for your data scientists. You could say that this center of excellence was a block in our pyramid that always needed to be there."
"We can now make data-based decisions live in a meeting. Acceptance reaches all the way to the board level with our CFO, who supports our initiative."
Continue exploring Tableau Blueprint
You are here
define a governance model