Top moments from Tableau Conference 2021


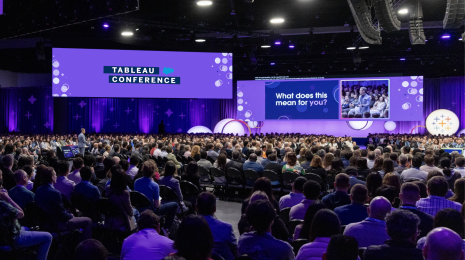
Tableau celebrated its 14th annual Tableau Conference—and the largest data party of the year drew data rockstars from all over the globe to learn, connect, and be inspired by their peers, experts, and thought leaders. During the conference, Tableau shared key announcements, including outlining the product vision and future of analytics, as well as a pledge to train 10 million data people. Below we round up a highlight of some of the biggest moments from Tableau Conference, and of course, for all the top news from #Data21, check out the Tableau Newsroom.
The data opportunity ahead
Tableau President and CEO Mark Nelson began his inaugural Tableau Conference keynote discussing the world’s shift to ‘digital-first.’ According to McKinsey, in the pandemic’s early days, digital transformation adoption jumped five years forward in just eight weeks. Mark says we’ve seen how this digital-first world is causing many organizations to rethink how they gather and use their data—and creating new opportunities for everyone with that data.
“Data and analytics used to be tools available to a small number of specially trained people,” Mark shared in his blog on the keynote. “Now, data is for everyone: anyone can become a data person and experience the joy of exploring data, asking and answering questions, and having the data they need at their fingertips to spark their next great idea. This shift in working with data—from a job for the few to a skill for everyone—is actively redefining how the world thinks about analytics.”
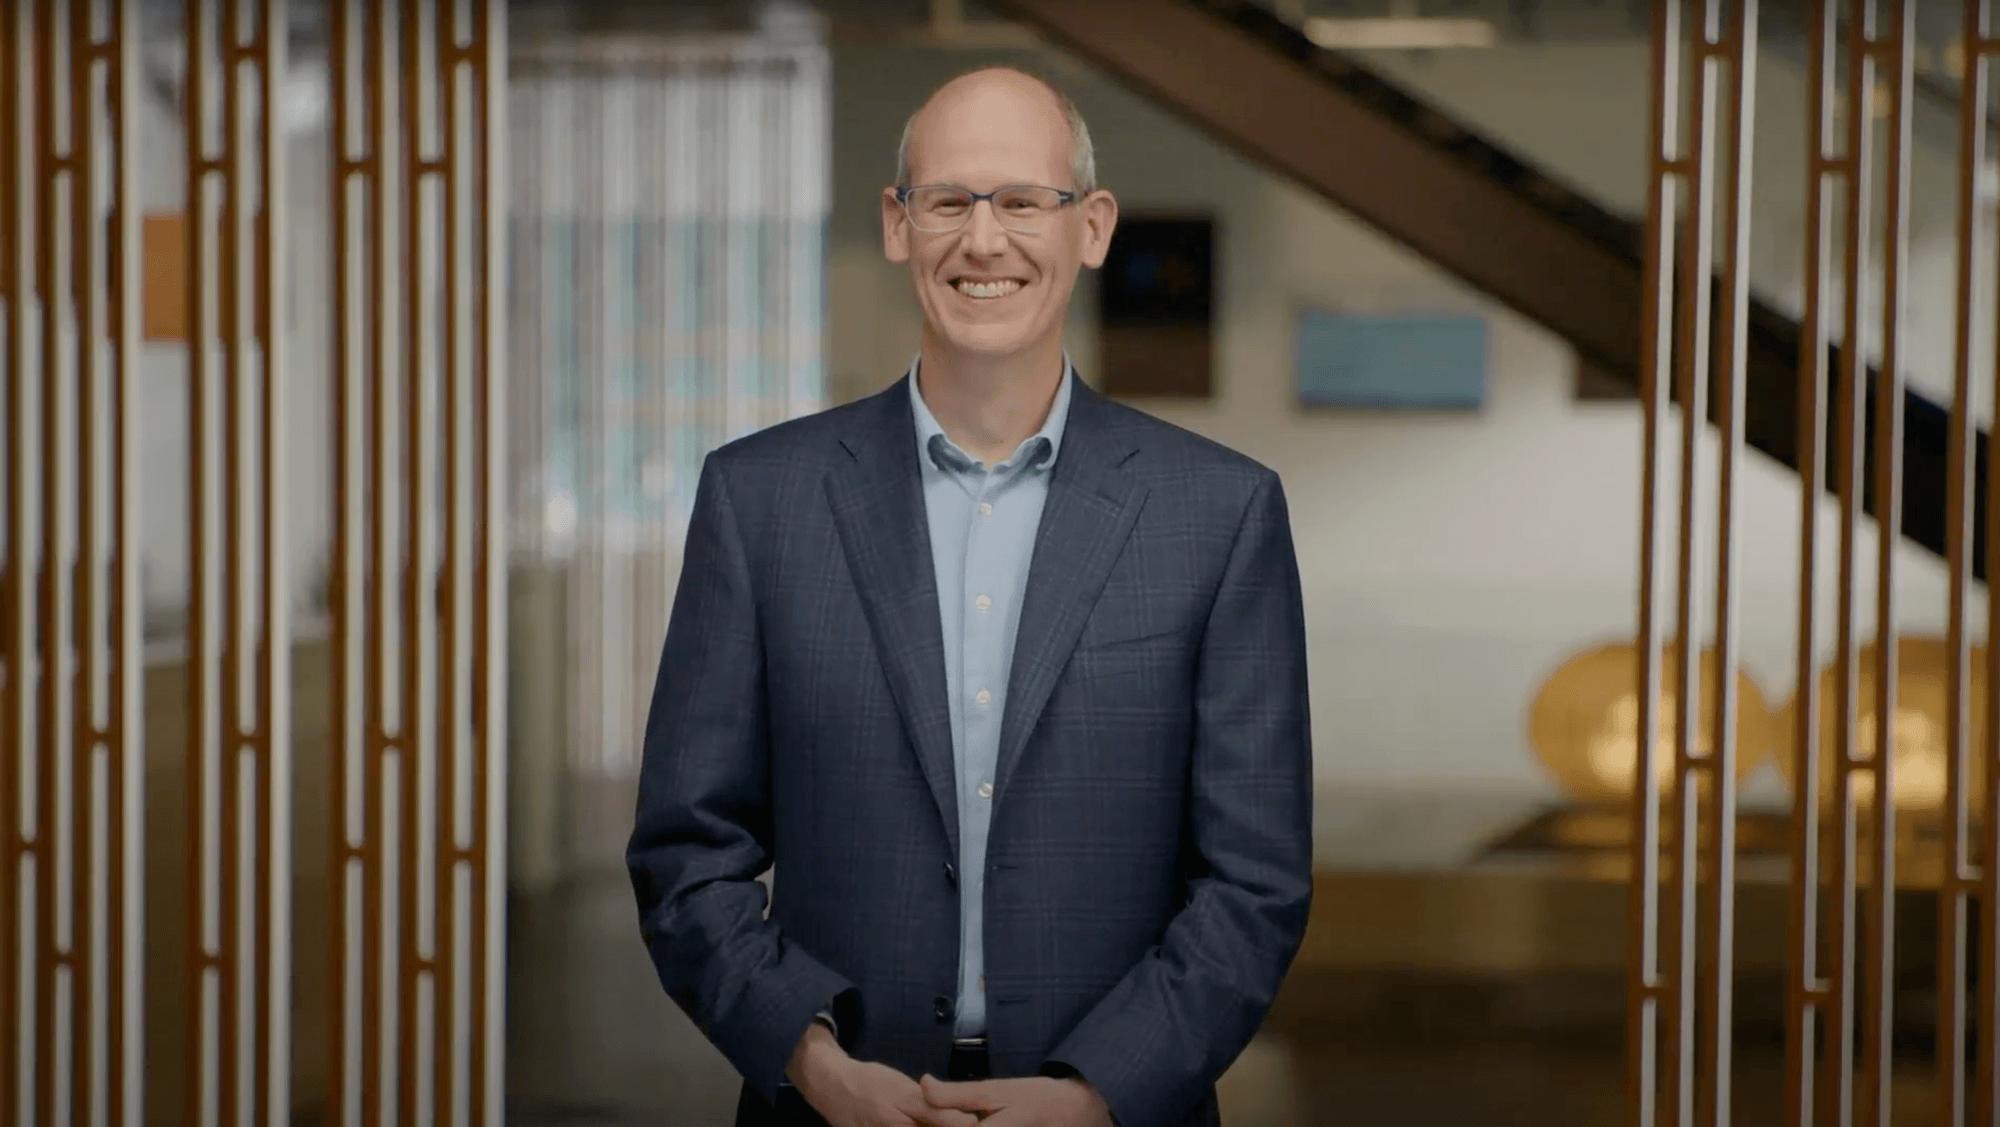
Mark Nelson kicked off the three day conference with his opening keynote from the Tableau headquarters in Seattle, Washington.
Closing the gap with the Tableau Economy
Mark shared the groundwork for how Tableau will help close the data skills gap and help organizations and their people around the world become data people—continuing our mission to help people see and understand data.
Built on the foundation of our robust, scalable platform, the Tableau Economy—our ecosystem of customers, partners, and individuals leading the world’s data transformations—will help create new opportunities in jobs, careers, and business revenue. This includes continued support of our Tableau Community, enhancing Tableau Public, and helping create a more data-literate world with our commitment to enable 10 million people with data skills in five years.
Additionally, we will continue to support our partners with our newly revamped Tableau Partner Network. And for our customers, we’ll continue evolving our platform with advanced technology to better meet their needs and jumpstart their analysis with the Tableau Exchange, making it even easier for everyone to use Tableau.
Developing a healthy, ethical Data Culture
Customers Seattle Seahawks and Jaguar Land Rover (JLR) joined Mark to show us how they get it done with their own Data Cultures. JLR shared how they’re driving business transformation by scaling analytics across their entire enterprise, helping them navigate supply chain issues and proactively manage risk. Mark sat down with Seahawks Chief Revenue Officer Amy Sprangers to learn more about how they use data as an asset to make for exciting experiences for the team’s fans, the famous ‘12s,’ including a special surprise for Mark and Team Tableau.
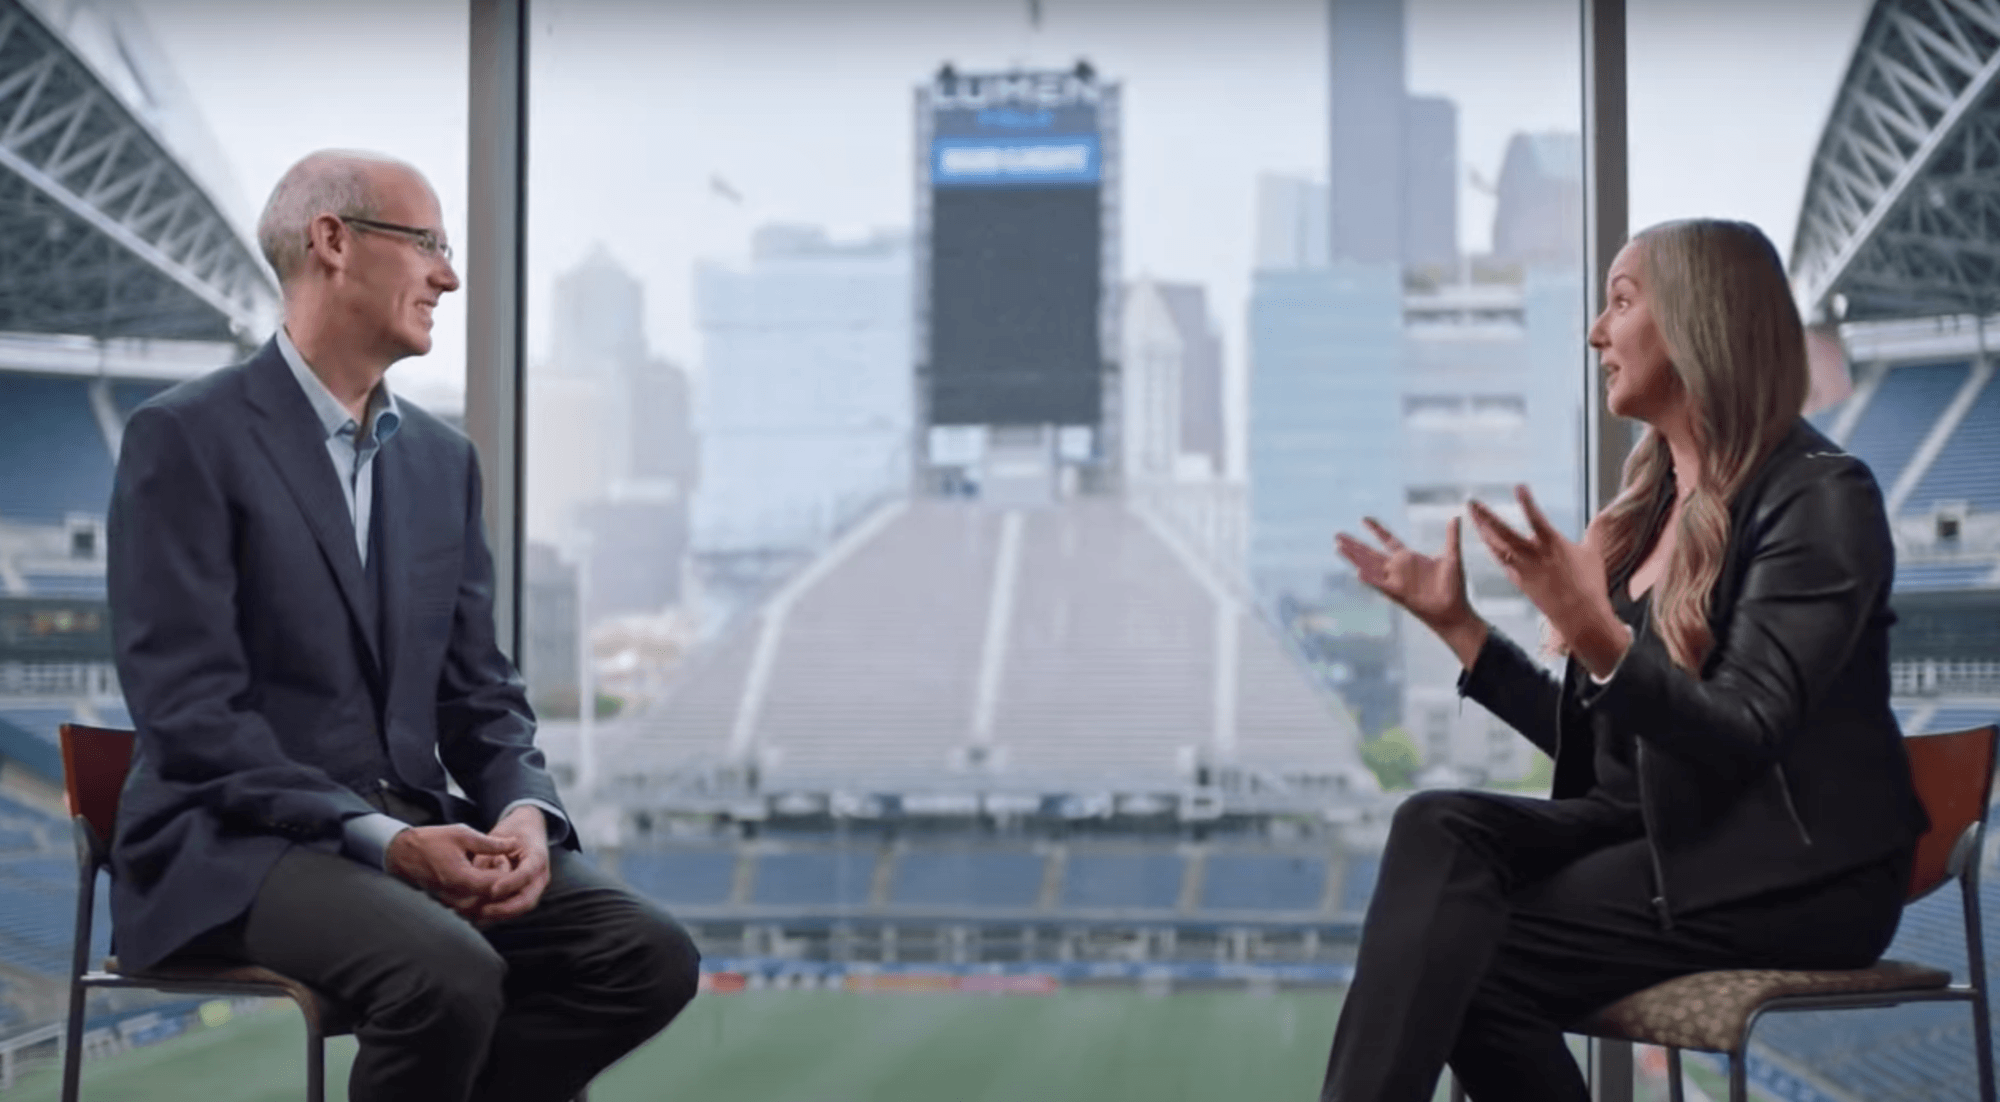
Mark Nelson chats with Seattle Seahawks Chief Revenue Officer Amy Sprangers.
A big part of our work at Tableau is also promoting the power of data as a force for good. Data used incorrectly, however, can also do harm. “We only get to come to work at the pleasure of our customers, and this trust is a responsibility we don’t take for granted. Neither is the responsibility to understand the widespread impact of analytics, and to use data ethically,“ Mark wrote in his blog.
Together, the Tableau Foundation and Urban Institute partnered to develop the Do No Harm Guide, a resource that guides data professionals on how to prioritize equity and inclusion when working with data. Urban Institute’s Senior Vice President Shena Ashley joined Mark for a conversation about how we can all better use data responsibly for positive change.
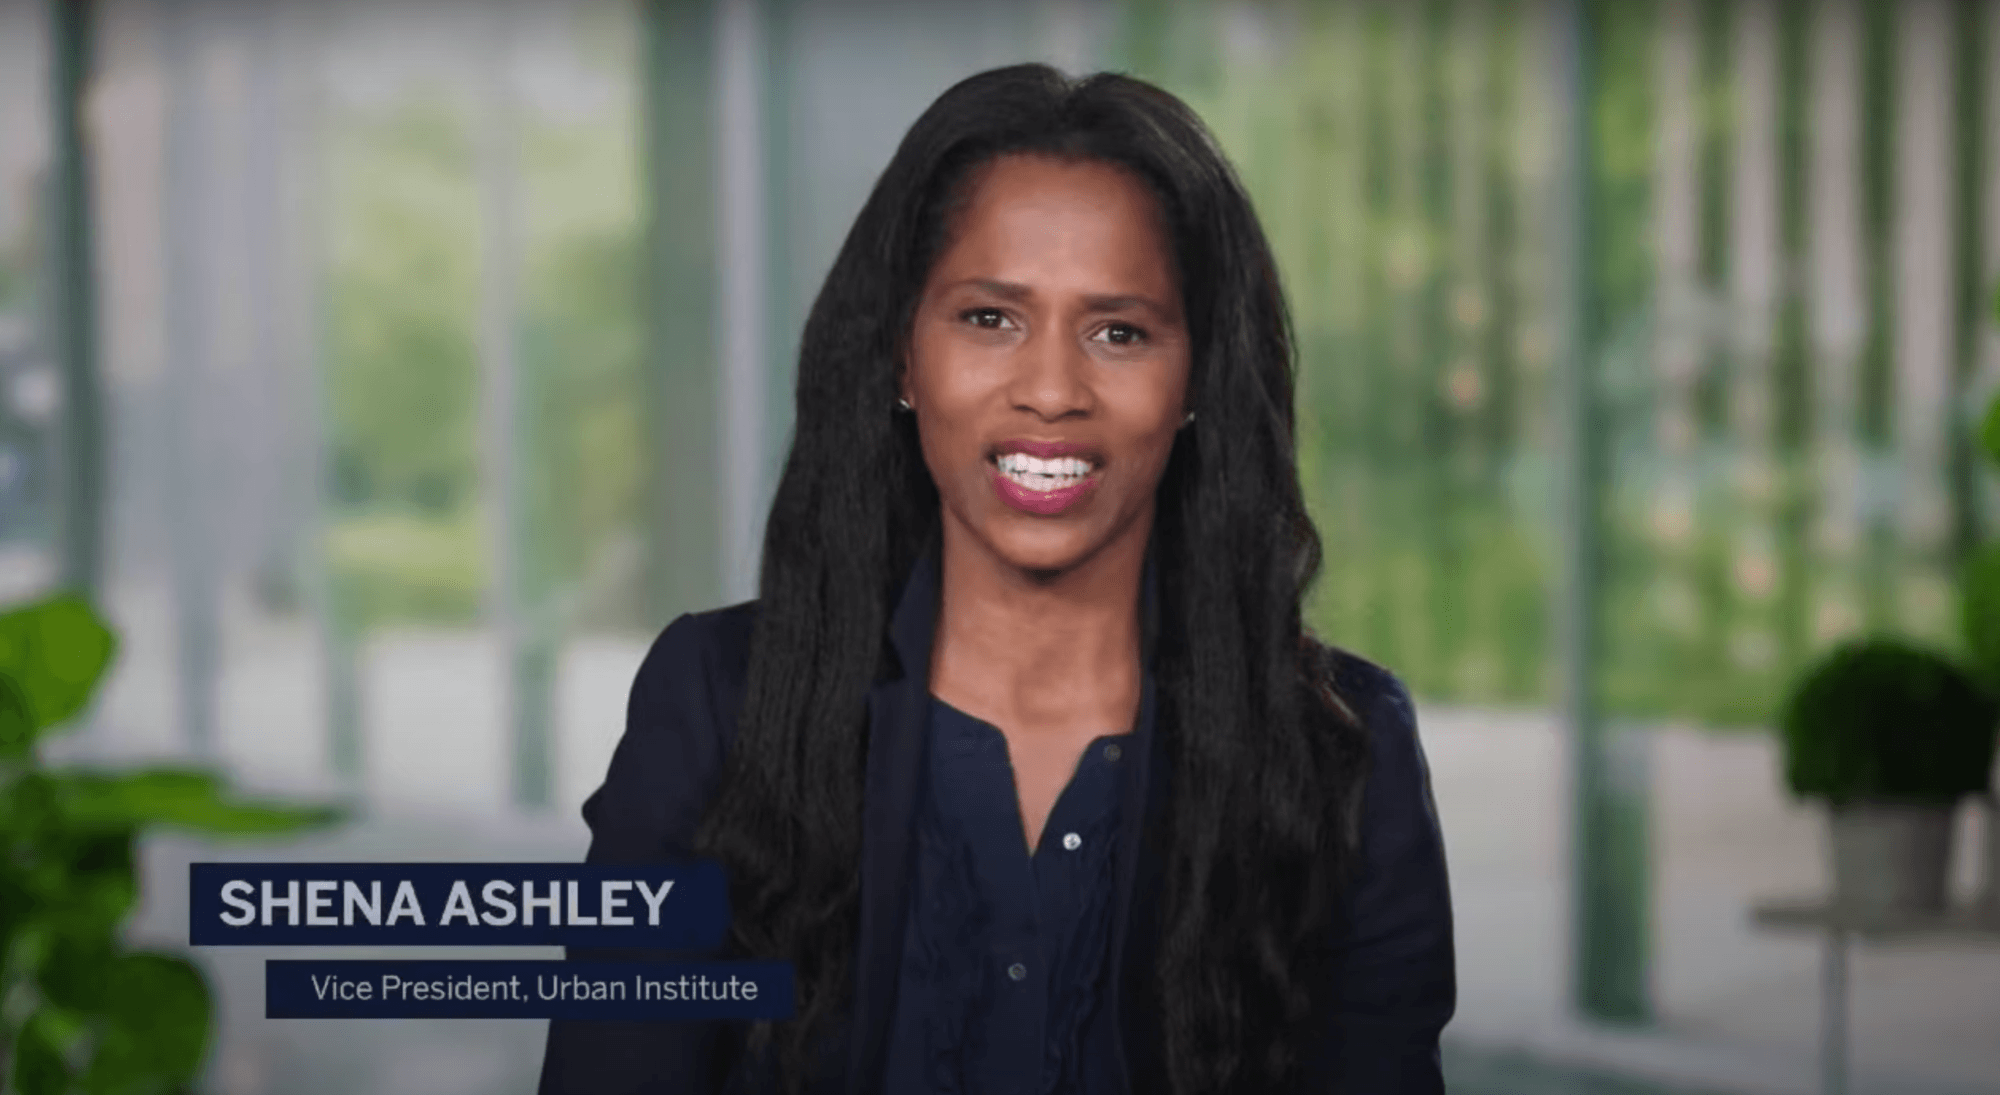
Urban Institute’s Senior VP Shena Ashley shared how they use Tableau to improve racial equity and the well-being of families and communities.
Democratizing analytics
Chief Product Officer Francois Ajenstat shared our product vision, outlining how we’re evolving the Tableau platform to better meet our customers and partners’ needs. Francois says speed, agility, and empowerment have become paramount to thriving in this new reality. We’re focusing on helping people sort through the data chaos so they can easily find insights, make better decisions, and thrive in this new data-driven world.
Francois recapped a big year in product innovation, highlighting new features we’ve brought to the Tableau platform. These included major product integrations with Slack that help people stay on top of their data directly where they work. We also shared more about Tableau Business Science, a new category of analytics that makes sophisticated data science techniques more accessible for business people. And we’ve made Tableau Data Management capabilities more robust and enterprise-ready, balancing empowerment with control so even more people can trust the insights from their data for fast decision making.
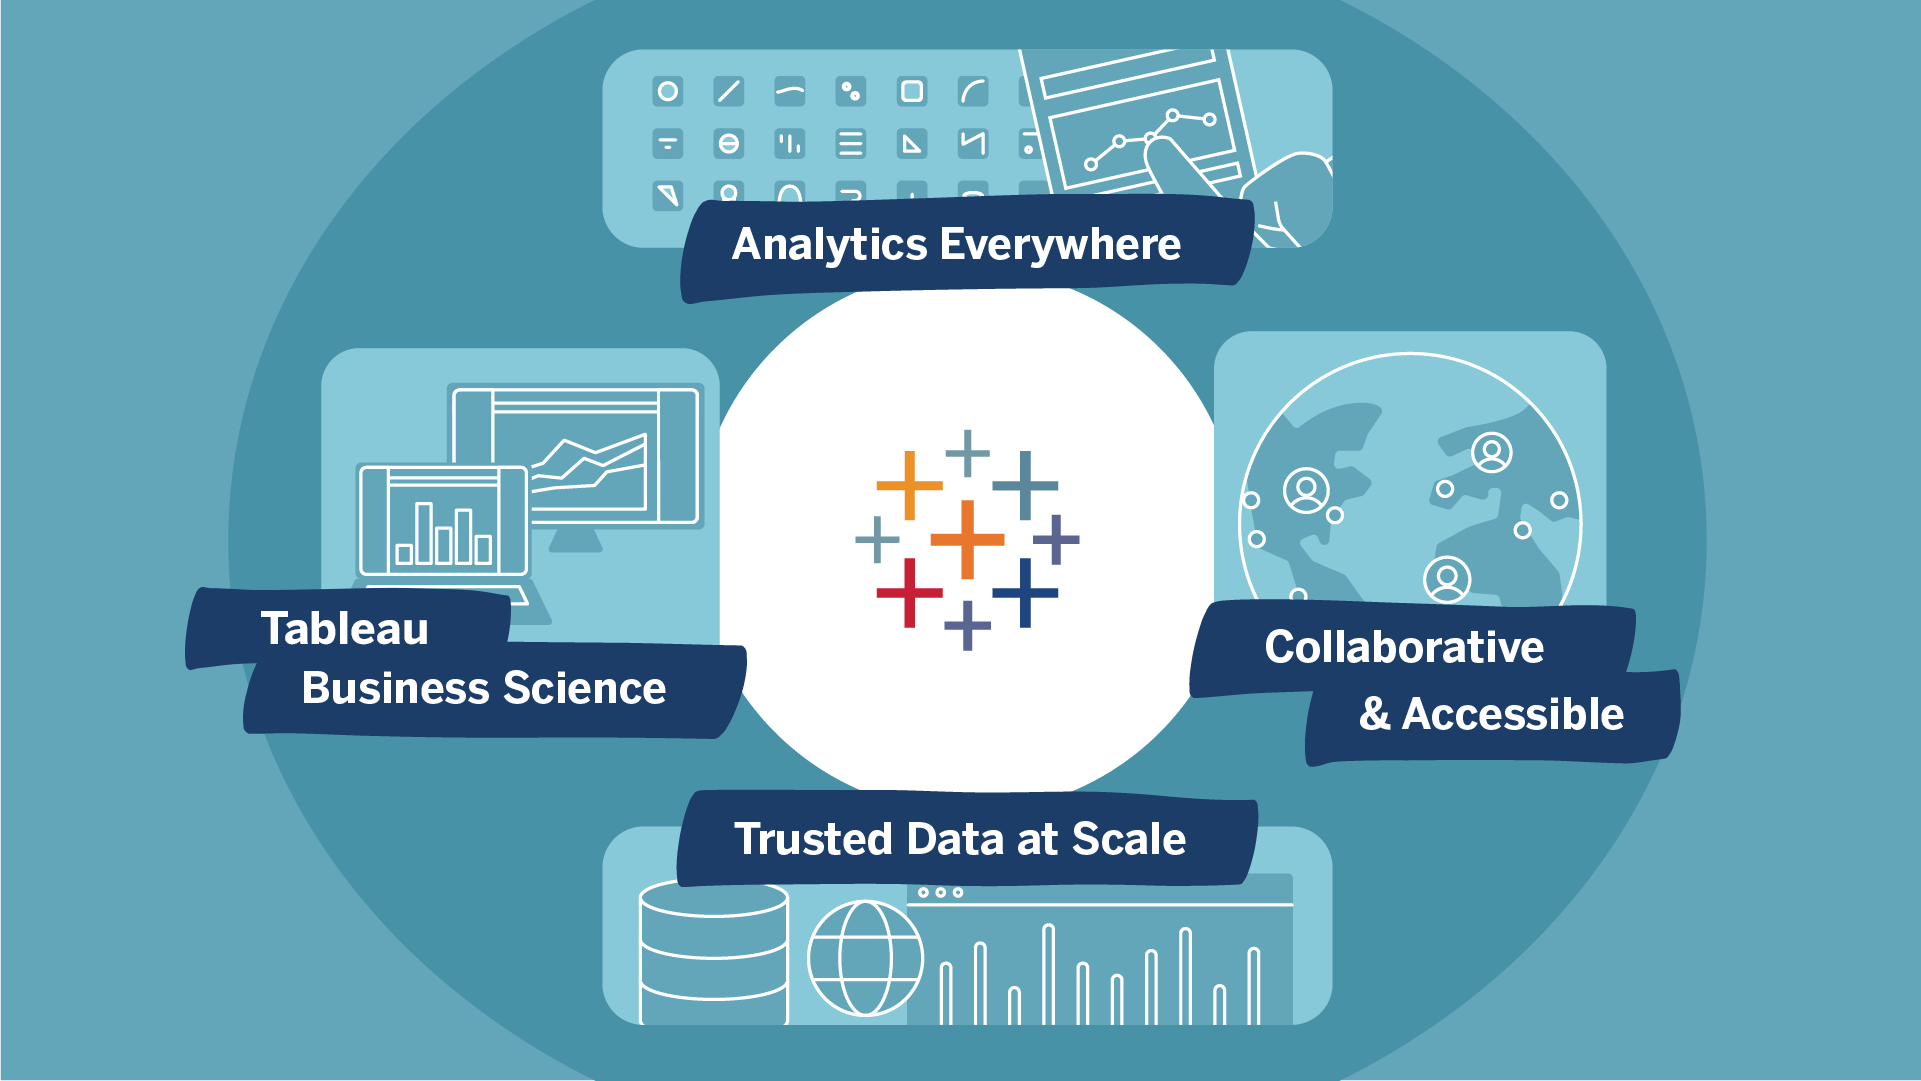
Tableau Chief Product Officer Francois Ajenstat shared some of the biggest product innovations that have been added to Tableau Platform this year.
Overall, Francois says that next year will be about “more”—more data sources, more extensions, more people, more use cases, more security, more power, more speed, more scale, more success. Our product team is truly focused on expanding capabilities so we can deliver analytics to anyone, anywhere with any data.
Let’s All Data
Tableau’s Community—the DataFam—was on full display as more than 113,000 registrants came together to connect with other data people, share best practices, and learn about next-generation analytics. Customers—from Lyft and T-Mobile to the University of Michigan—gave insightful presentations on Tableau's critical role in building a Data Culture and changing the way their organizations succeed.
In Iron Viz, the world’s largest virtual data visualization competition, data superstars battled it out to see who could transform raw climate data into engaging and insightful Tableau analysis in just 20 minutes. Hosts Andy Cotgreave and Keshia Rose’s excitement was contagious as they introduced this year's data rockstars, Pradeep Kumar G, Lisa Trescott, and Samuel Parsons, who earned their places by rising to the top from hundreds of incredible Data + Joy submissions.
The theme for this year’s competition centered around music. Chartmetric provided a deep, global data set of nearly 200 million records spanning several years. It included artist popularity, metadata, YouTube listening data, and loads of Shazam history.
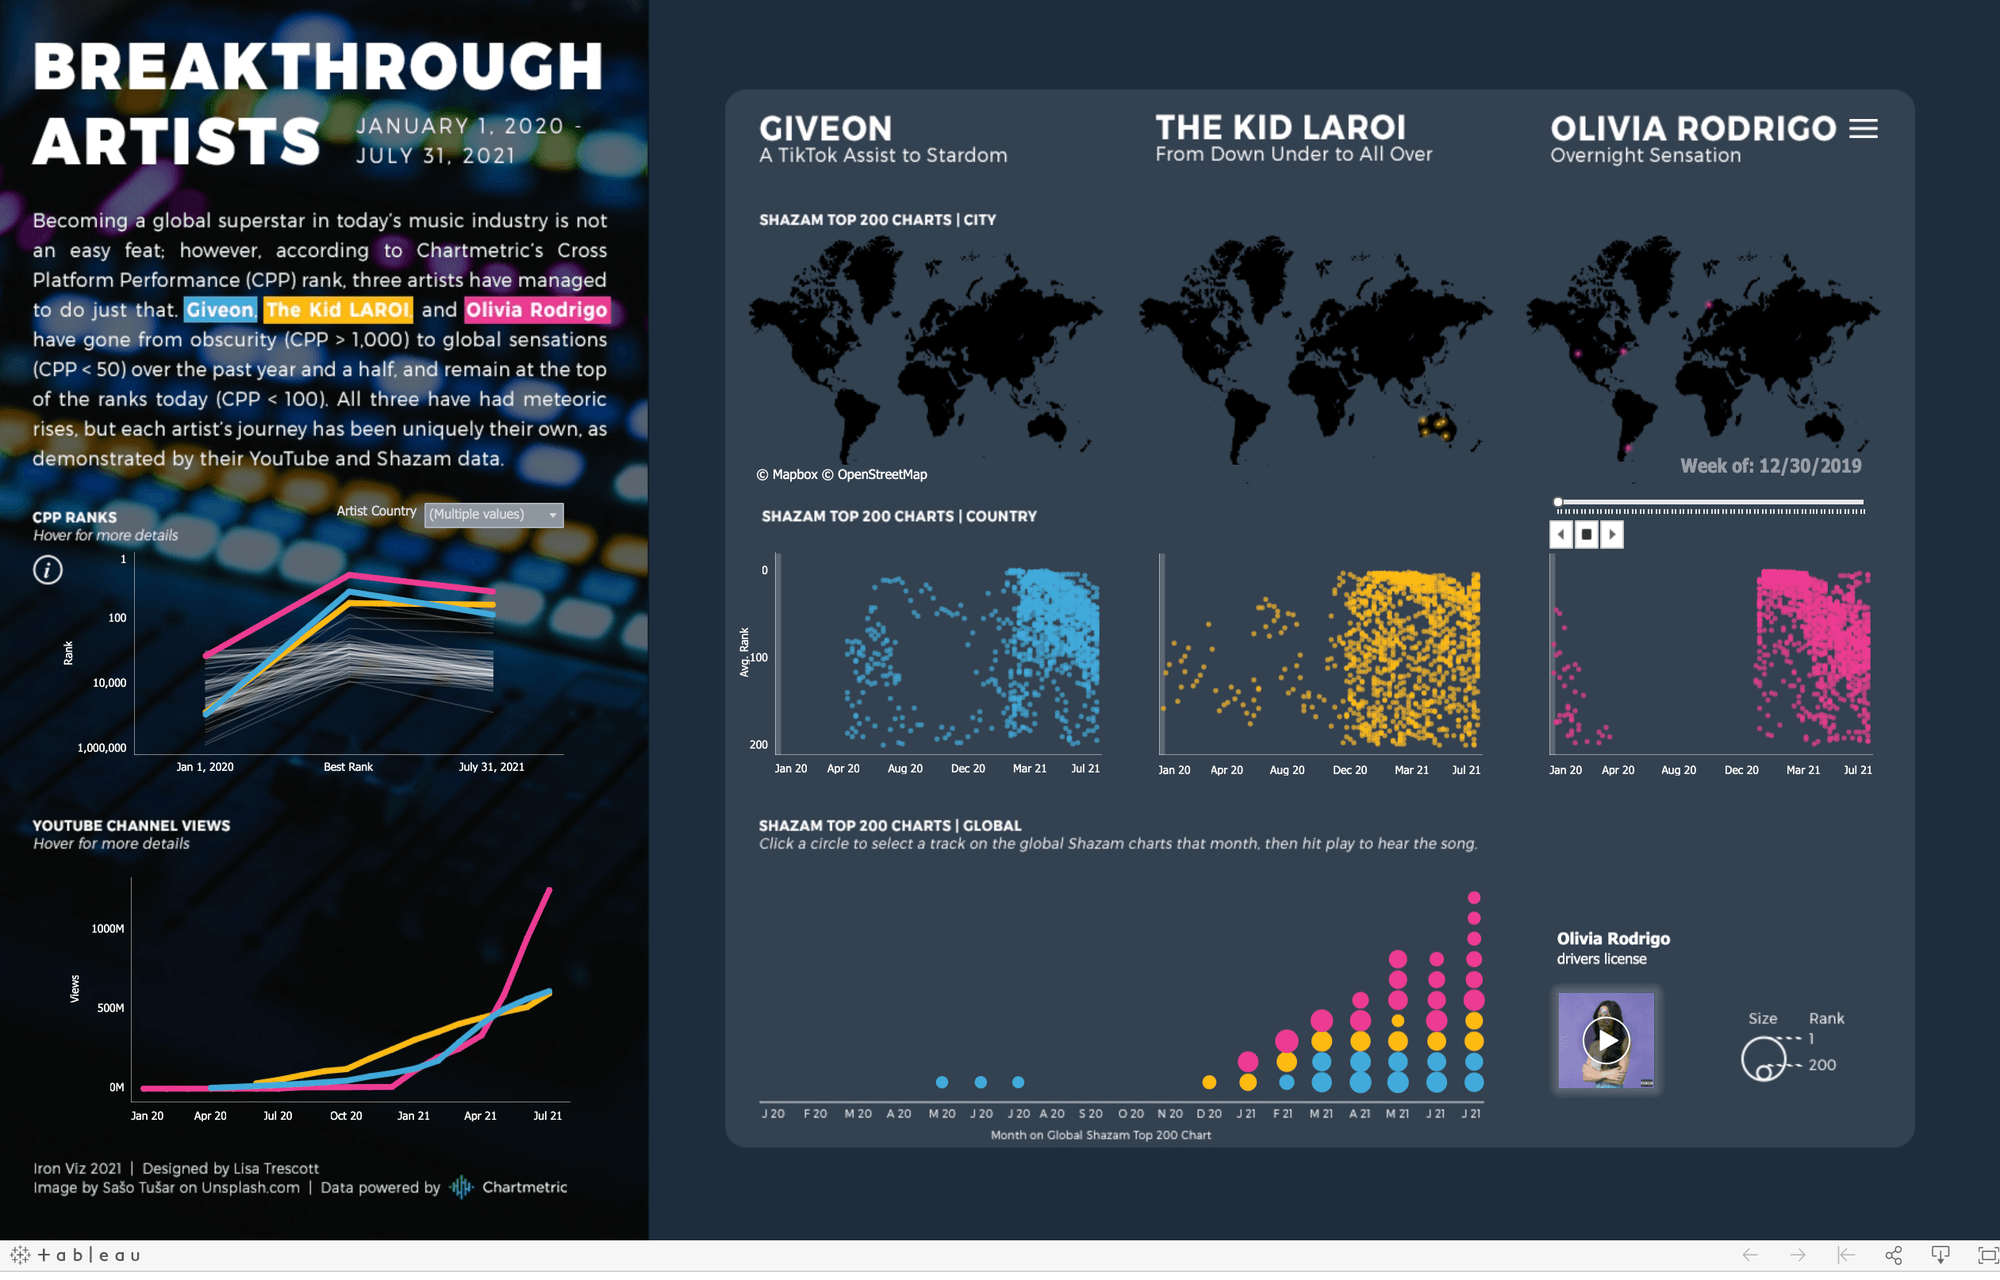
Iron Viz winner Lisa Trescott edged past her competition with vibrant charts, animation and storytelling around three breakthrough artists.
Lisa Trescott was this year’s Iron Viz champion. She edged past her competition with vibrant charts, animation, and storytelling around three breakthrough artists. Lisa is donating her winnings to PolicyLink, who partnered with the Tableau Foundation on the Racial Equity Data Hub—a comprehensive data visualization resource for organizers working on racial equity and justice.
Check out the TC21 opening keynote or dive into other sessions on demand by registering on the Tableau Conference website.
Related Stories

Top Announcements from Tableau Conference 2026
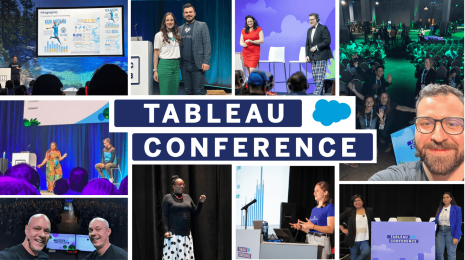
Tableau Conference ‘Call for Participation’: Tips for Submitting Your Session Proposal
3 tips to submitting a compelling Tableau Conference session proposal.