Now Available in Tableau 2022.4–Tableau External Actions, Image Role, and More


The newest version of Tableau is available now! Tableau 2022.4 has new capabilities for increasing productivity and saving time and money.
Let’s take a look at the highlights:
- Act at the point of insight. Run customized, data-driven workflows from Tableau dashboards with the click of a button.
- Improve insight comprehension with images. Dynamically render images in your visualizations at scale by designating URLs in the dataset as an Image Role.
- Work faster. Complete common tasks with greater efficiency with new features inspired by the Tableau Community.
- Optimize content. Identify ways to improve your content and make informed decisions based on workbook performance.
- Deliver personalized content at scale. Automate the management of Custom Views and embed them into web applications, portals, and more with new developer tools.
- Scale analytics across your organization. Pay by usage for external users rather than Viewer licenses.
Try Tableau or upgrade to Tableau 2022.4 today to take advantage of all these great features and more.
Now, let’s take a closer look at what’s in this release.
Act at the point of insight with Tableau External Actions
Going from insight to action typically involves pivoting between applications. As you switch between applications, you might lose context or your train of thought completely—requiring you to act on an imperfect memory or re-review information.
Now, you can make in-context decisions and automate workflows from within your Tableau dashboards with a single click. By natively integrating with Salesforce Flow, Tableau External Actions helps automate sophisticated business processes to save your organization time and money. Using this capability, you can connect your dashboard to Salesforce Flow to create an opportunity, escalate a case, and more without leaving Tableau.
The Tableau External Actions workflow connects any data in Tableau with a flow in Salesforce, enabling you to act on data outside of a Salesforce database and streamline multi-step processes involving various teams and tools into a single workflow. Tableau External Actions is available for Tableau Desktop, Tableau Cloud, and Tableau Server.
Improve insight comprehension using Image Role
Sometimes the subject matter of data visualizations can feel abstract, leaving people questioning its relevance to their work. By adding images to your dashboards, you can help people better recognize and connect to the subject matter. After all, a picture is worth a thousand words.
Image Role is a new field semantic that offers a scalable and automated way to bring image assets into Tableau. You can now more efficiently bring in, align, reuse, and update pictures. This new capability dynamically maps text strings to images, which can then be used in column and row headers. And since images are managed externally, Image Role keeps storage costs down, while keeping workbooks from getting too large to maintain and share. Image Role is available for Tableau Desktop and Tableau Cloud and coming soon to Tableau Server.
Work faster with features inspired by the Tableau Community
In addition to Image Role, there are a number of new capabilities sourced from the Tableau Community! We’re introducing three key features inspired by your ideas to offer more efficient—and simpler—ways to do common tasks.
Previously, replacing a data source would impact all worksheets using that data source. Now you can opt to replace the data source for only the current worksheet. This update opens up opportunities to capture time savings. For example, now you can create a templated worksheet, duplicate it, and replace the data source per sheet to deliver highly relevant visualizations on the right data. This capability is currently available for Tableau Desktop.
It’s now easier to hyperlink text to add context and help end-users navigate to additional knowledge sources. You can add and edit hyperlinks in the rich text editor by clicking the new link button in the toolbar which is accessible to keyboard-only users. This capability is available in Tableau Desktop and Tableau Cloud and coming soon to Tableau Server.
To format strings with correct case text, you can use the new PROPER() function instead of complex workaround calculations. This function provides a simple way to convert text strings to proper case so your text is formatted as your end-users expect. The PROPER() function is available in Tableau Desktop and Tableau Cloud and coming soon to Tableau Server.
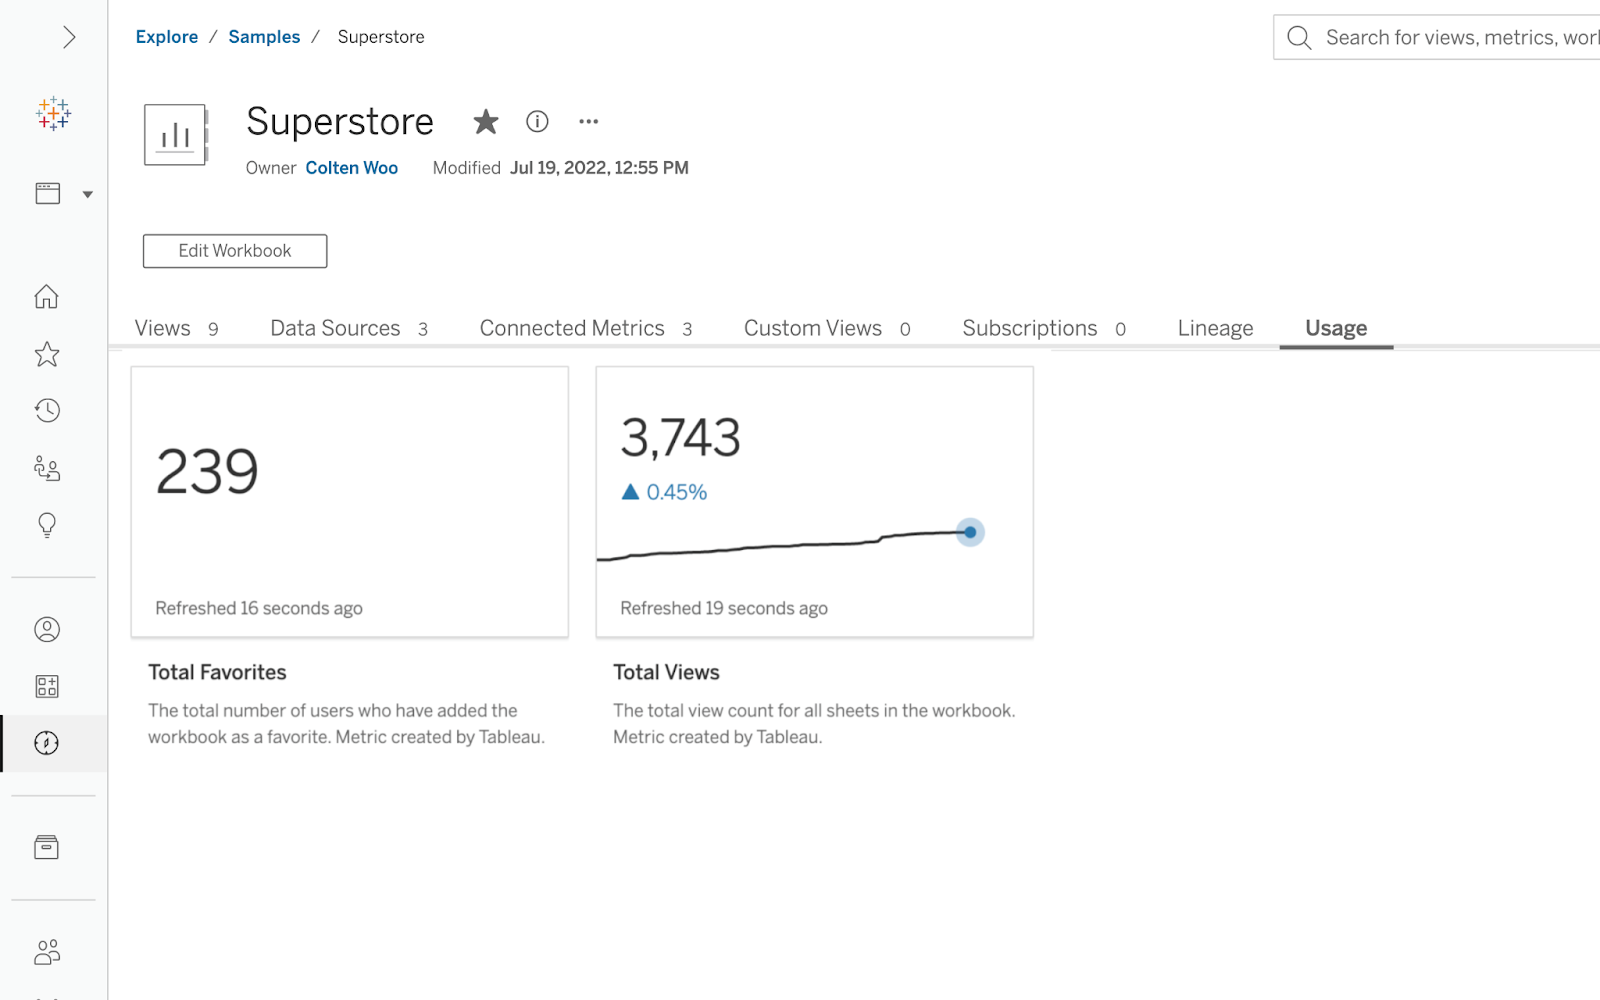
Optimize content leveraging insights from Usage Metrics
After building a workbook, it’s important to track its performance to make sure time and effort are being used wisely. By identifying what content is popular and resonating with your organization, authors can apply those learnings to shape future content.
Workbooks now have a Usage tab that displays built-in Tableau Metrics for the total favorites and views the workbook has received. These insights provide a feedback loop, showing authors what workbooks should be refreshed or retired for better self-service content management. Authors can view these Metrics as a time series to track performance over time and see if their updates improve usage. On the other side, viewers can leverage Usage Metrics to validate if the content is widely used and can be trusted. The Usage tab is available in Tableau Cloud and coming soon to Tableau Server.
Embed and automate the management of Custom Views
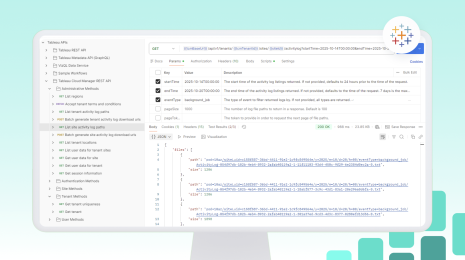
Automation meets personalization with Custom Views REST APIs. To get meaningful and relevant insights, you often need to filter, sort, or otherwise modify your view. Using Custom Views, you can save a personalized version so you don’t have to repeat your selections each time. And now with the Custom Views REST APIs, developers can automate the management of Custom Views at scale.
With the Custom View REST APIs, developers can get, update, and delete Custom Views, and filter them by workbook and owner. In conjunction with the Embedding API v3, the Custom Views REST APIs makes it possible to bring Custom Views to embedded scenarios, helping deliver personalized experiences to your users no matter where they work.
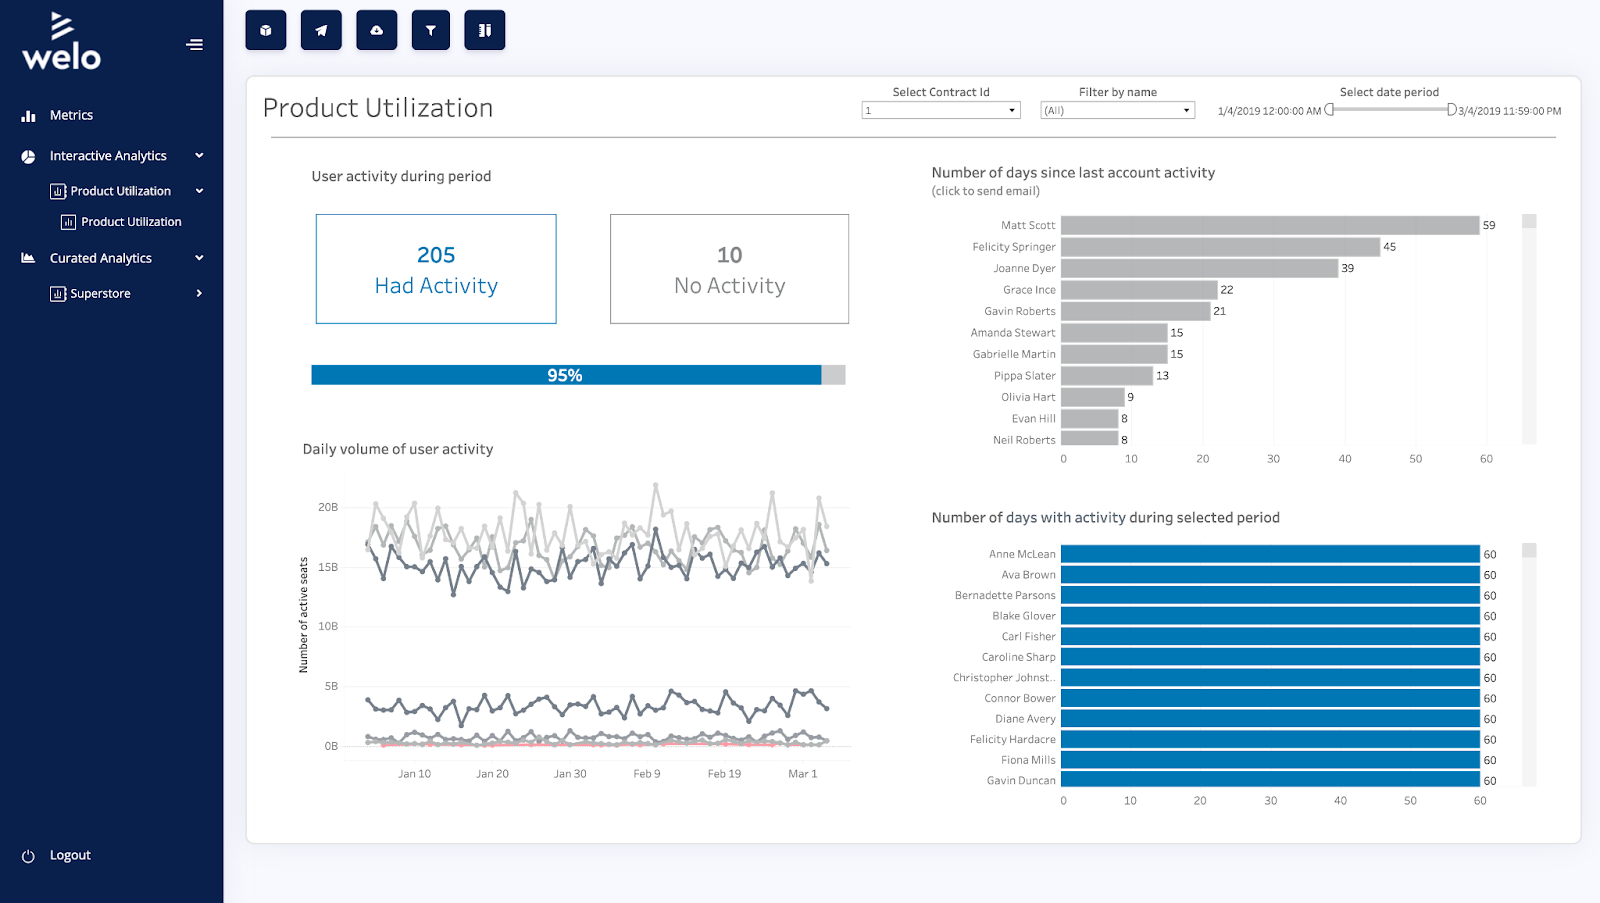
Scale analytics across your organization with usage-based licensing for Embedded Analytics
Product utilization can vary significantly between users. This disparity in usage is especially prominent in embedded scenarios where user needs can be unpredictable. In this case, paying per license may not be the right fit for your needs.
To address this, we're launching usage-based licensing for Tableau Embedded Analytics. Under this new licensing model, you only pay for the value you and your customers get. It is a flexible and cost-effective way to scale Tableau beyond the walls of your organization. This new offering brings together an innovative licensing model and a best-in-class analytics platform to maximize the value you receive from your data investments.
Thank you, Tableau Community!
You inspire us every day, and your partnership and support make each Tableau release possible. We couldn’t do this without your incredible expertise, creativity, and dedication to using data to solve problems.
Visit the Ideas forum to see all the capabilities we’ve incorporated in Tableau based on your suggestions. And don’t forget to upgrade to the latest version of Tableau to start using all these exciting new features.
Related Stories
Monitor Tableau Cloud Deployments of Any Size with the Platform Data API
 January 2, 2026
Tableau New Features Released in 2025 from Community Ideas
 December 30, 2025

Get Interactive with Dynamic Spatial Parameters in Tableau
 July 31, 2025