Data accelerates COVID-19 insights and action


In early March, COVID-19 was spreading wildly throughout New York City and NYC Health + Hospitals (NYC H+H) was in crisis mode. Jenny Smolen, a member of NYC H+H’s Office of Population Health, was responsible for many of the dashboards used by managers throughout the large health system. With the pandemic bringing patients to the hospitals and clinics in record numbers, and emergency departments overwhelmed, the team needed to help the organization use data to manage the crisis.
NYC H+H acted quickly to provide care to fellow New Yorkers, many of whom came from underserved populations. Jenny’s work led to dashboards that provided real-time tracking of available beds, staffing, and PPE supplies. The dashboards informed physicians, nurses, and managers what resources were available for use in the patient care at each NYC H+H facility.
Managers used the dashboards to allocate resources to where they were needed most while also diverting ambulances from overwhelmed facilities to others with available capacity to quickly care for patients. During the Tableau Unplugged session at 2020 TC-ish, I asked Jenny what she considered the greatest impact of her team’s dashboards. She responded, “The dashboard information saved many, many lives."
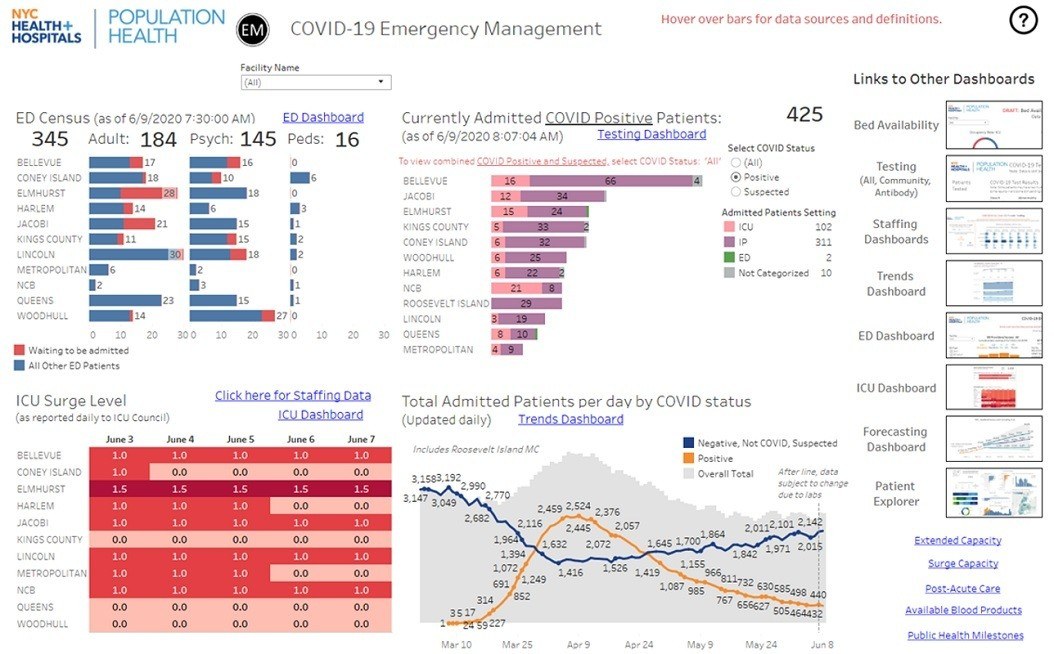
NYC H+H COVID-19 Emergency Management Dashboard
The rise of telehealth
As New York City hospitals became overloaded with COVID-19 patients this past spring, all non-emergent patient visits were suspended. Patients feared visiting their physicians in facilities filled with highly infectious COVID-19 patients. In response, provider organizations like NYC H+H scrambled to secure proper computer equipment and telehealth software to allow virtual visits. Patients responded enthusiastically to these virtual visits.
Before the pandemic, telehealth was only a small fraction of all patient visits. Now it exists as a significant offering of hospitals and clinics. Frost and Sullivan predicts an increase in the use of telemedicine of 64% in 2020, but I believe that is a very conservative estimate.
Telehealth makes visits easier for patients negating the need for travel to a provider’s office and the time and inconveniences associated with it. Although we are several months away from removing COVID-19 as a threat, the way physicians and patients interact has forever changed.
Managing telehealth services requires tracking productivity, quality, and patient satisfaction metrics to be sure that services are provided efficiently and effectively. Many organizations, including NYC H+H, now use dashboards to effectively manage their telemedicine service. These dashboards help managers identify processes requiring rework to enhance care delivery and the patient experience.
Health equity: impacts to at-risk and underserved communities
As the pandemic spread throughout New York City, morbidity and mortality patterns began to emerge. While we expected older patients to have a greater chance of dying from the COVID-19, we also quickly saw in the data that health disparities affecting minority and underserved communities are a factor in patient outcome. In addition, COVID-19 disproportionately attacks subpopulations including those with chronic diseases or limited access to healthcare services. More work is needed to better understand the impact of health equity on COVID-19 outcomes and to identify steps required to protect populations at risk.
Vaccine research and development
When the novel SARS-CoV-2 virus first appeared in China and Europe, scientists began collecting data to better understand the 120 nm RNA strand. Data was shared across thousands of research centers around the world, first describing the symptoms seen in COVID-19 patients and later identifying the actual genetic sequence of the virus and its various mutations. There has been no time in history where so many scientists have openly shared their research in an effort to develop a safe and effective vaccine. China’s sharing of the virus’ genetic sequence in early January started a global race among research centers. Just two weeks after the release of that 30,000 base pair genetic code, researchers in the UK created the first prototype of a vaccine that uses the virus’ spike protein to block infection.
Vaccine trials are one area that could benefit from more data transparency. Companies working on vaccine development are not always transparent about the protocols used in their vaccine trials, most organizations recognize the importance of transparency to gain the trust of citizens to accept vaccination.
Sharing the vaccine trial results in a visual way, using dashboards, can help explain the complicated statistics required to demonstrate the safety and efficacy of a particular vaccine. This openness will work to build trust that will help foster a vaccination rate of 80%+, the minimum level needed to achieve herd immunity, a level that will return us to a life without masks—and without restrictions on social, educational, and cultural activities or travel.
Data at the center of the New Normal
We can be sure that the new normal will not be anything like the old normal. As human beings we adapt and change to our environment. Those who can work from home may continue to work from home using tools that have been enhanced to better serve such a different workplace. Researchers, who formerly shared their work only at conferences, may continue to post their discoveries online allowing informal peer review and the sharing of insights with others working on similar problems. Our interactions with our physicians will now always include a telehealth option.
While these past several months have been difficult and disruptive, the changes it has brought are an opportunity to improve upon our “normal.” There are already signs that we have chosen the right path.
To learn more about how Tableau is helping healthcare organizations and government agencies use data analytics to be more responsive and more resilient in our rapidly changing world, visit the Healthcare Analytics Solutions and Government Analytics Solutions pages of our website.
Related Stories
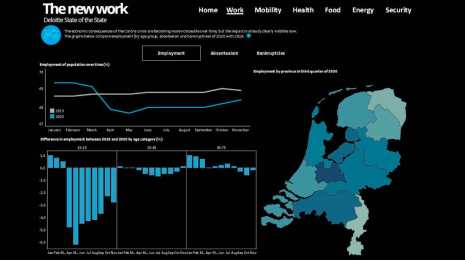
What we can learn from open data: COVID-19 in the Netherlands
 April 29, 2021

After a year of COVID-19 charts, eight data communication lessons learned
 April 19, 2021
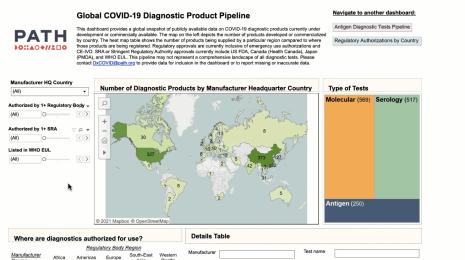
Data innovations in public health: PATH creates COVID-19 diagnostic test dashboard
April 2, 2021