Conversational AI Anyone Can Use, Answers Everyone Can Trust with Tableau Agent in Pulse


Every business is being asked to make smarter decisions and move faster by adopting AI agents. But speed without trust doesn't move you forward, it just accelerates you in the wrong direction.
For some teams, popular open-ended coding agents may look like a fast path to AI-driven productivity, but in practice they are expensive governance traps. Context windows fill up, token costs spike, orchestration frameworks may route sensitive data through unapproved paths, and a tiny prompt change can return completely different results with no audit trail. For highly regulated industries like healthcare, financial services, and other data-sensitive environments, one unverified answer is all it takes to undermine every decision that follows.
This tension is real. Organizations want the productivity and clarity that generative AI promises, but cannot afford analytics that sound confident while quietly changing the math, shifting the filters, or inventing conclusions that cannot be traced.
This is precisely why we built Tableau Agent in Pulse (formerly Enhanced Q&A): AI-powered, conversational analytics built on your governed Pulse metrics for trusted, deterministic insights.
A trusted path to conversational analytics
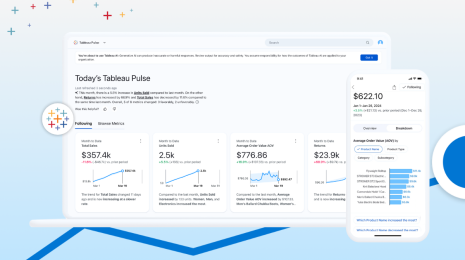
Tableau Agent in Pulse is a conversational analytics experience built directly into Tableau Pulse. It enables any user to explore the metrics that matter most to their business and get clear, source-backed answers, grounded in trusted business definitions.
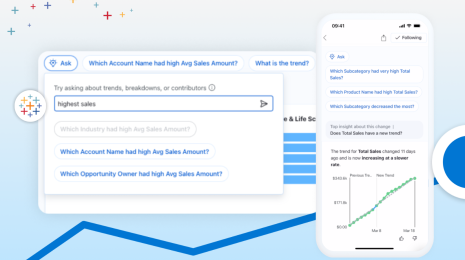
Users can ask questions like:
- What’s driving customer churn in the last 90 days?
- We appear to be at risk of missing our revenue goal, which products are underperforming?
- How are delivery delays and inventory backlog tracking together?
- Which offices contributed most to patient CSAT this week?
- Is there a correlation between churn rate and credit utilization?
Tableau Agent then responds with a structured, natural language summary, citing the sources behind every insight, visualizing the most compelling insight, and suggesting follow-up questions to keep the exploration moving. With Tableau Agent in Pulse, users can uncover the “why” behind metric changes and take action faster.
The architecture behind every answer’s accuracy and consistency
Tableau Agent in Pulse does not ask the LLM to perform math calculations or query data. All computation runs through the Pulse Insight Service, a deterministic system that uses governed metric definitions, filters, dimensions, time periods, and proven statistical logic to produce trusted insights across multiple metrics. The LLM then clearly explains the insights and their meanings with journalistic fluency. Tableau Agent in Pulse’s architecture reflects a deliberate separation of responsibilities unlike that of an open-ended chatbot, coding agent, or raw-data tool.
With Tableau Agent in Pulse, the same metric context produces an underlying insight that is repeatable, explainable, and grounded in the business definitions your organization already trusts. Not only are responses reliable, your data stays secure and is not used to train our AI models. With zero-data-retention LLM handling, sensitive-data masking, and full AI auditing, you stay in total control.
How Tableau Agent in Pulse is different
-
Every answer is backed by evidence
Tableau Agent cites the metric and statistical insight behind every 'fact' stated by Agent. You can follow the chain of evidence to verify responses.
-
Insights you can see
In every response, Tableau Agent renders in-line the visualization that best supports the key takeaway, so users don't have to imagine the insight, they can see it.
-
Ask where you work
Tableau Agent is accessible from the Pulse homepage, metric details, and the Tableau mobile app, so when a question forms, the answer is never more than a tap away.
Make the most of Tableau Agent in Pulse
Tableau Pulse transforms how your organization uncovers actionable insights and following these best practices will help you maximize its potential. Here’s how:
Step 1: Build meaningful business metrics in Pulse
Tableau Agent works best on metrics that are essential to your business. Investing in metrics that your leadership and teams understand and use is a key starting point.
Step 2: Ask a simple question and build from there
Craft a metric-specific question like "What's driving churn this month?" or "Which regions contributed most to the revenue drop?" Tableau Agent also suggests questions to either kick off or continue the conversation.
Step 3: Generate content for your business
Ask Tableau Agent to create an exec summary or an action plan, formatted for the audience and translated into additional languages. The presentation adapts, but the facts stay the same.
To learn more about what’s possible with Tableau Agent in Pulse and how it works, check out the help article.
Try it today, no complex setup required
Already a Tableau Cloud customer on Standard or Enterprise editions? You can start a 60-day self-guided trial with one-click and begin using Tableau Agent in Pulse on your own metrics and data. Tableau+ and Cloud+ customers already have access to Tableau Agent in Pulse.
Not yet on Tableau Cloud? Try Tableau Agent in Pulse for free in the Tableau Cloud trial.
Related Stories
Top New Tableau Pulse Feature Releases to Know
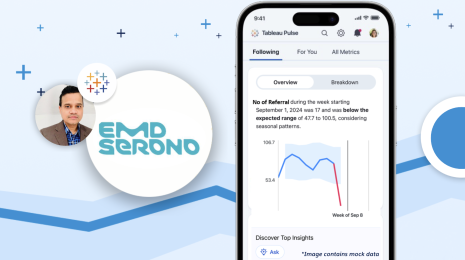
How EMD Serono is improving patient care with personalized, AI-powered insights from Tableau
 September 30, 2024
How Tableau Pulse Approaches NLP with Q&A to Empower Everyone
 July 9, 2024