Spring is in the Air
Fast meets Smart: As you may have heard, Tableau Desktop - Public Edition 9.0 was launched earlier this week! This brand new version of Tableau Public is packed full with new, rewarding features that create a faster and smarter data analysis experience. From automatic data preparation to drag-and-drop trend lines, we hope you will enjoy the user experience as much as we have.
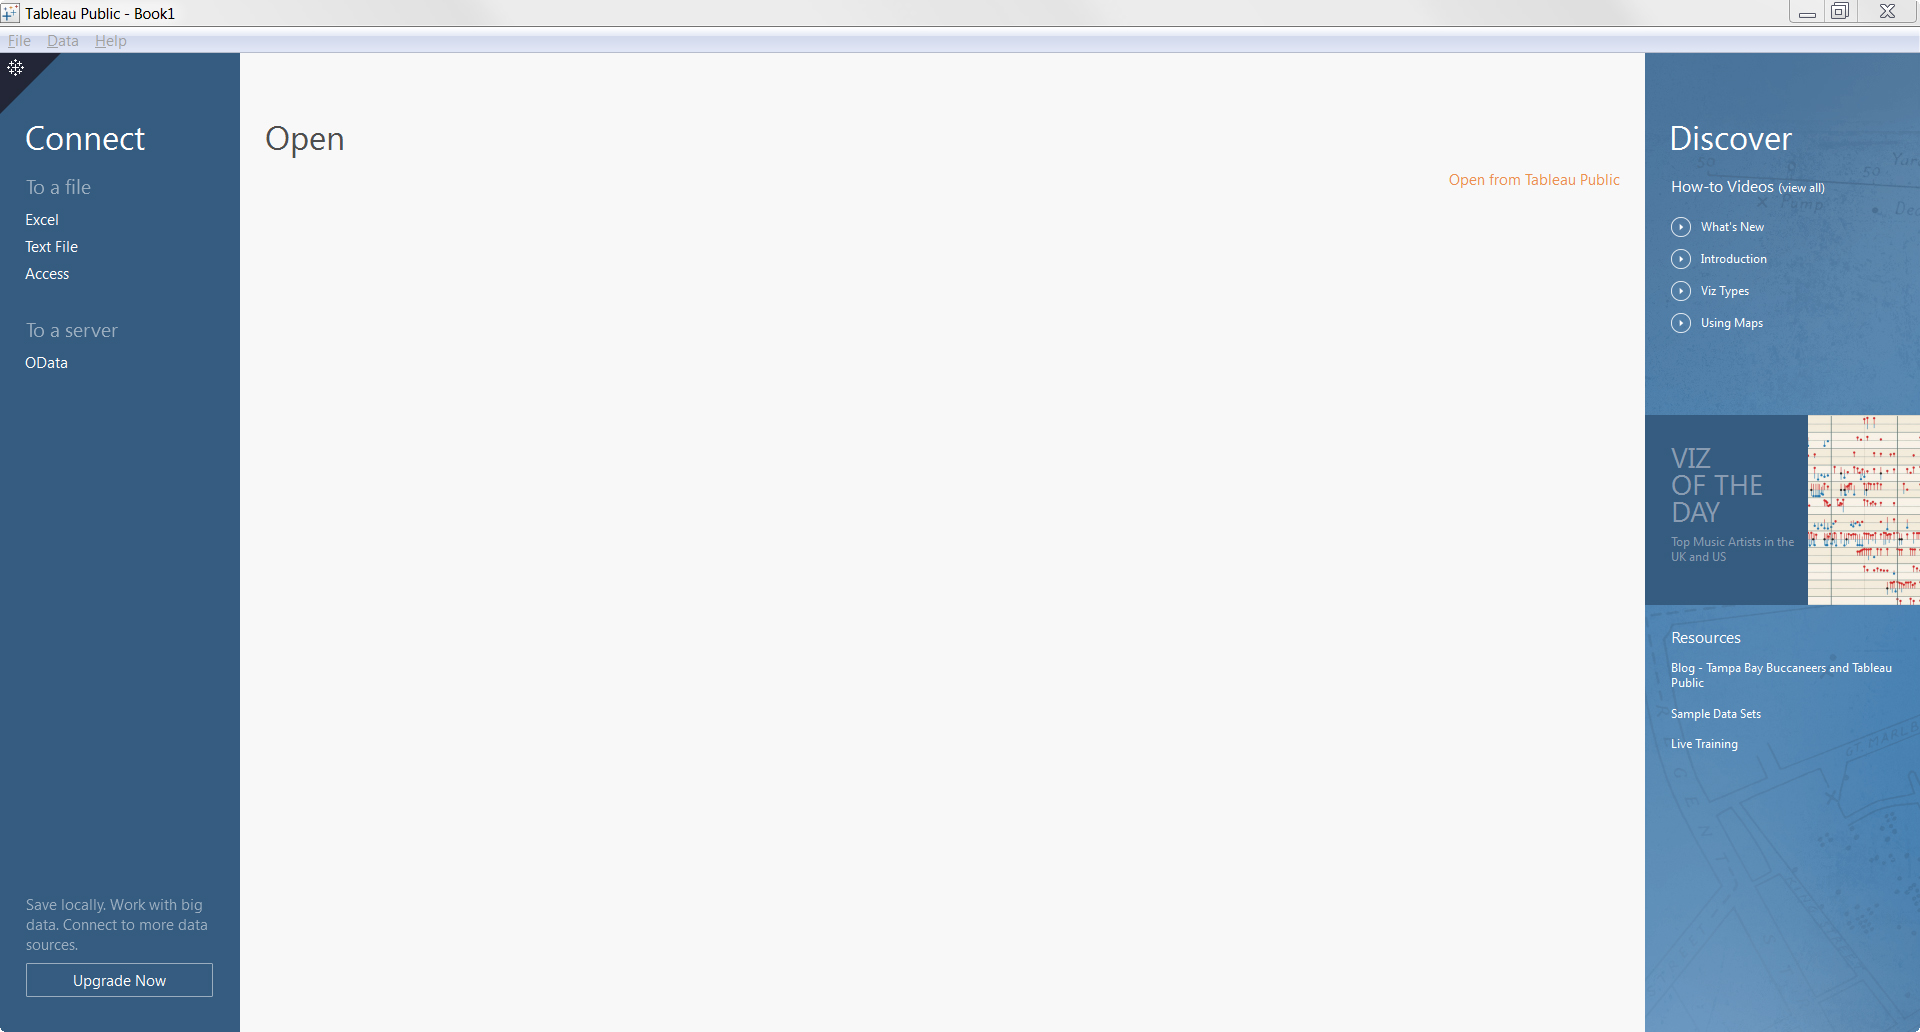
Over the next few weeks we will publish a couple of blog posts to look at examples of how these new features can be used in action. Today we will start with the new start page. This is the splash screen that you see when you open up Tableau Desktop Public Edition for the first time:

The new start screen
It is not only beautiful, it also matches the design of our new Tableau Public website.
If you are new to Tableau Public, you will appreciate the panel on the right hand side. It gives you one-click access to training videos and other useful resources, including sample data sets to get you started with Tableau. Just looking for inspiration? Then follow the link to Viz of the Day to explore what amazing things people all over the world create with their data every day.
Once you feel comfortable putting together your own first visualization (and with Tableau it’s so easy to do that there is no reason why you wouldn’t want to try it out), head over to the panel on the left-hand side and connect to a data set of your choice. In most cases that will probably be an Excel spreadsheet, in which case you simply click on “Excel” to load your data file.
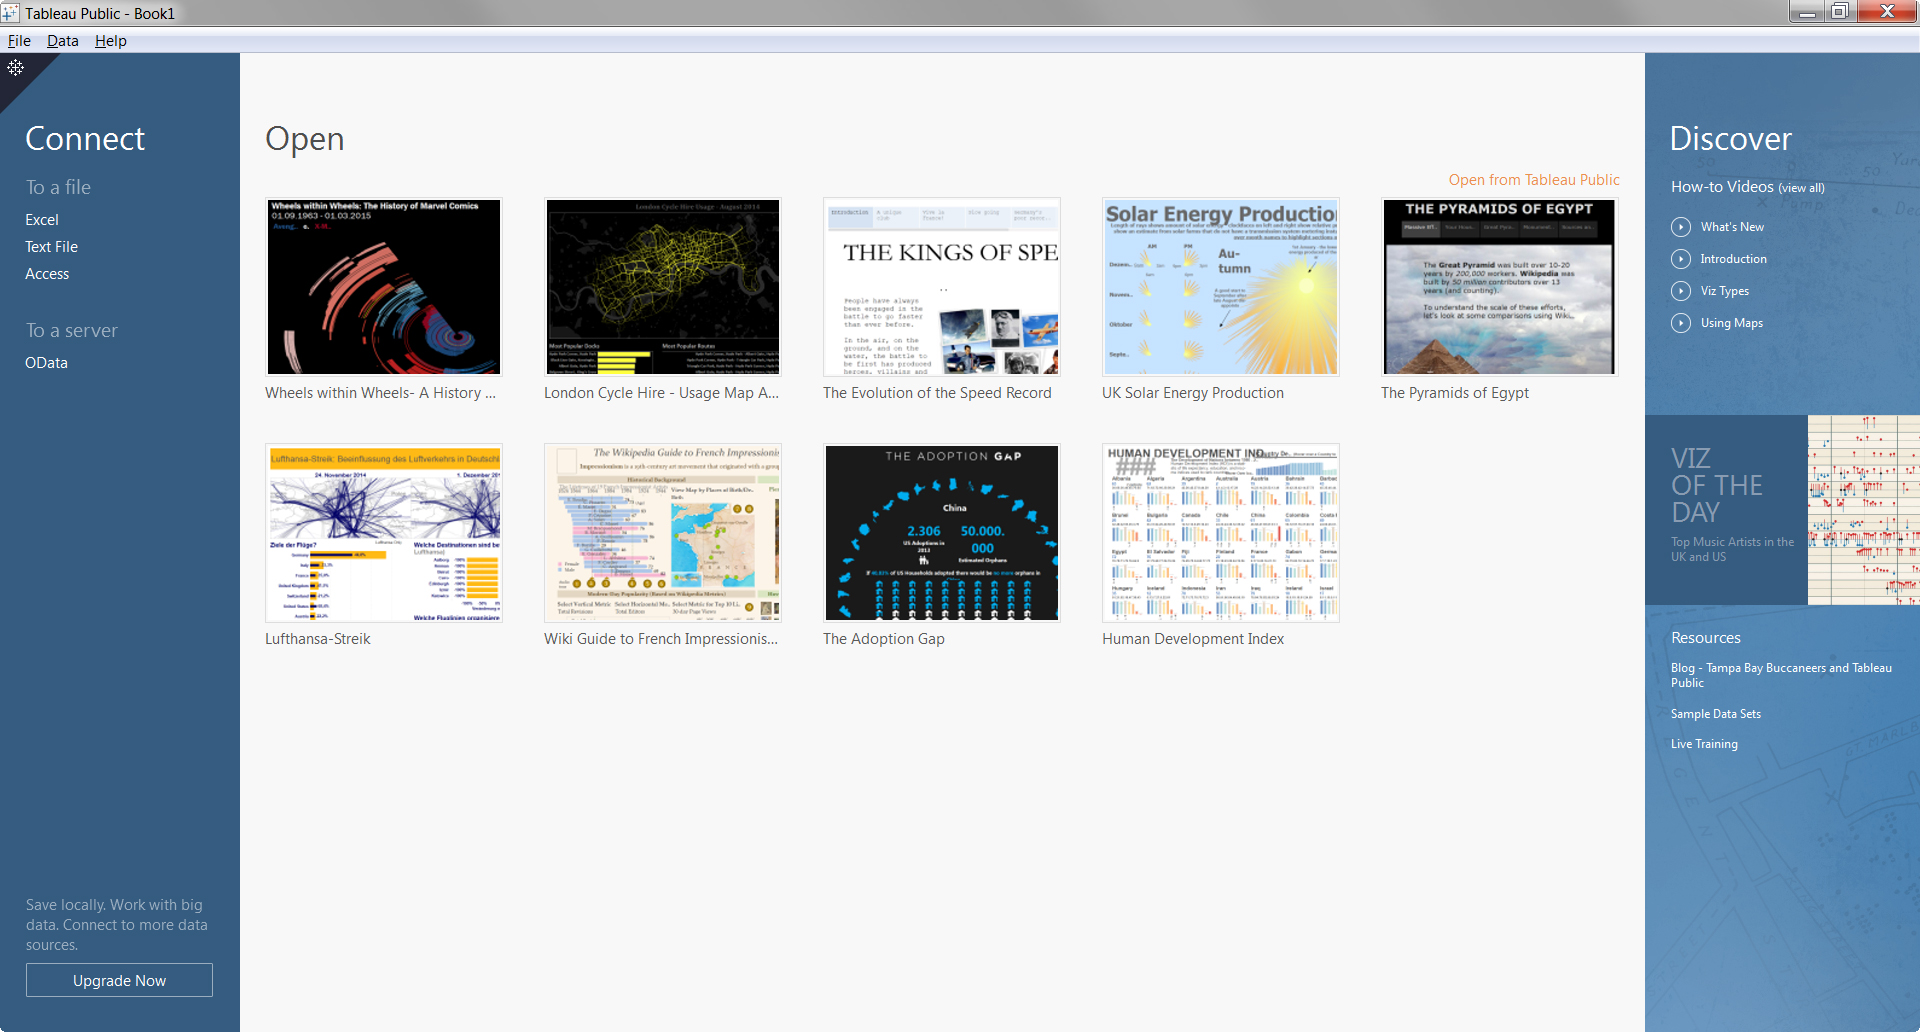
When you have created a number of vizzes, you will see your most recent workbooks appear in the middle of the start screen, as per the screenshot below. Note that you can “pin” frequently used worksheets to this panel using the little pin symbol (  ), so that you always have them handy.

Your most recent vizzes at your fingertip
If your desired workbook is not among the most recent ones, you can access all your saved workbooks by clicking on the orange link in the top-right-hand corner (  )
)
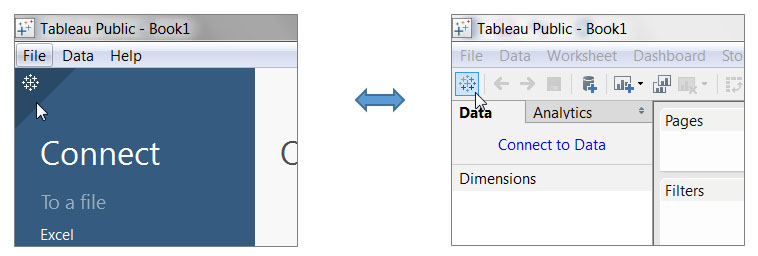
Finally, note that you can always toggle conveniently between this start page and the workspace canvas by clicking on the little Tableau icon in the top-left-hand corner (  /
/  ).
).

Switching between start screen and workspace
Like a clean desk after spring cleaning, we hope that this refreshing start page will make it just that little faster and enjoyable for you to get started with your data!
Stay tuned for more blog posts on other new features that will help you along the way as you create and publish vizzes on Tableau Public, including:
- Data Preparation - Data Interpreter, Pivot & Split
- Smart Maps - Search, Selection, and U.S. Census Data Layers
- The Analytics Pane & Instant Analytics
- LOD Expressions
- Rich Story Points Formatting


