How Do People “Read” Dashboards?




Before using a new dashboard, we first need to make sense of it: understand what it’s about, what questions it helps answer, and how to interact with it. Effective dashboard design can support this initial orientation through prominent titles, clear visual hierarchy, thoughtful layouts, and contextual cues that help users navigate information. In other words, they convey a sense of reading order, nudging users towards particular traversals to navigate dashboard elements in a more effective manner.
Dashboard design best practices have long drawn on principles from print and UX design, including F- and Z-shaped scanning patterns, visual hierarchy, and the inverted pyramid. These principles encourage placing important information, such as summary metrics, near the top or top-left. Findings from a past Tableau eye tracking study found that people are attracted to BANs and high visual contrast, suggesting that typography and Gestalt principles can influence user flows.
But knowing where people look is not the same as understanding how they navigate a dashboard, or why they choose one component over another. What happens when visual prominence competes with layout? When a user skips a chart to read an annotation? Or when the dashboard author expects one reading sequence, but users follow another?
These gaps motivated the work that Tableau Research will present at the upcoming IEEE VIS 2026 conference, which will take place in Boston this year. You can read the full paper here.
What do dashboard authors take into account?
We started by interviewing 13 dashboard authors from the DataFam to understand how they think about reading order when designing dashboards.From these interviews, we identified six interrelated factors that influence dashboard reading order:
- Layout. How components are arranged in the dashboard.
- Saliency. General visual design and formatting (color, contrast, white space, font size, etc); the idea is that highly salient components will attract more attention.
- Semantics. What components communicate and how they relate to one another, from high-level summaries to detailed evidence.
- Function. The roles components play, whether as titles, charts, KPI boxes, annotations, legends, or interactive controls.
- Interaction. How users engage with dashboard components to reveal information, filter data, or transform views.
- User context. The goals, familiarity, experience, and personal preferences that influence how someone approaches a dashboard.
These factors rarely operate independently. A prominent KPI may attract attention because of its size, position, meaning, or some combination of all three. This gave us a vocabulary for examining not just where people look, but how multiple design signals work together or compete to shape reading flows.
How do users flow through a dashboard?
Next, we invited 16 dashboard users to explore unfamiliar dashboards and describe the sequence in which they would naturally engage with the different components. We collected 64 user-reported reading flows across eight dashboards, representing different layouts, domains, and design styles. As an example, here is what an individual user flow looked like (Figure 1).
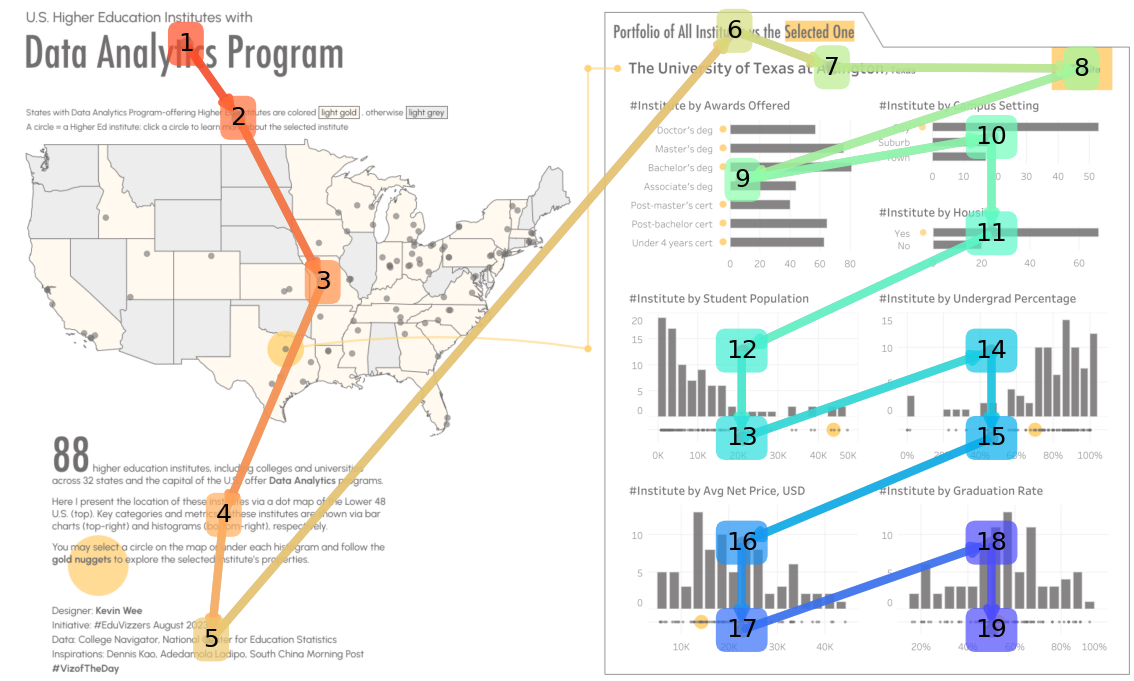
Figure 1. A dashboard flow from one of our participants, showcasing their “logical” sequence across the dashboard. It starts from the title, following a top-to-bottom path on the left side before repeating the same pattern on the right side.
Combined flows from all participants are shown below (Figure 2).
→ On the left, we have the eight dashboards used in the study, all from Tableau Public—thank you DataFam!
→ In the middle, we depict the average position across user flows. In other words, how early each dashboard element tended to figure in the flows: red means “read” earlier, and purple means “read” later.
→ On the right, we depict standard deviation of positions. In other words, how consistently users positioned these elements in user flows: here, blue means low variance (that is, users tended to agree on the position of this element), and red means high variance.
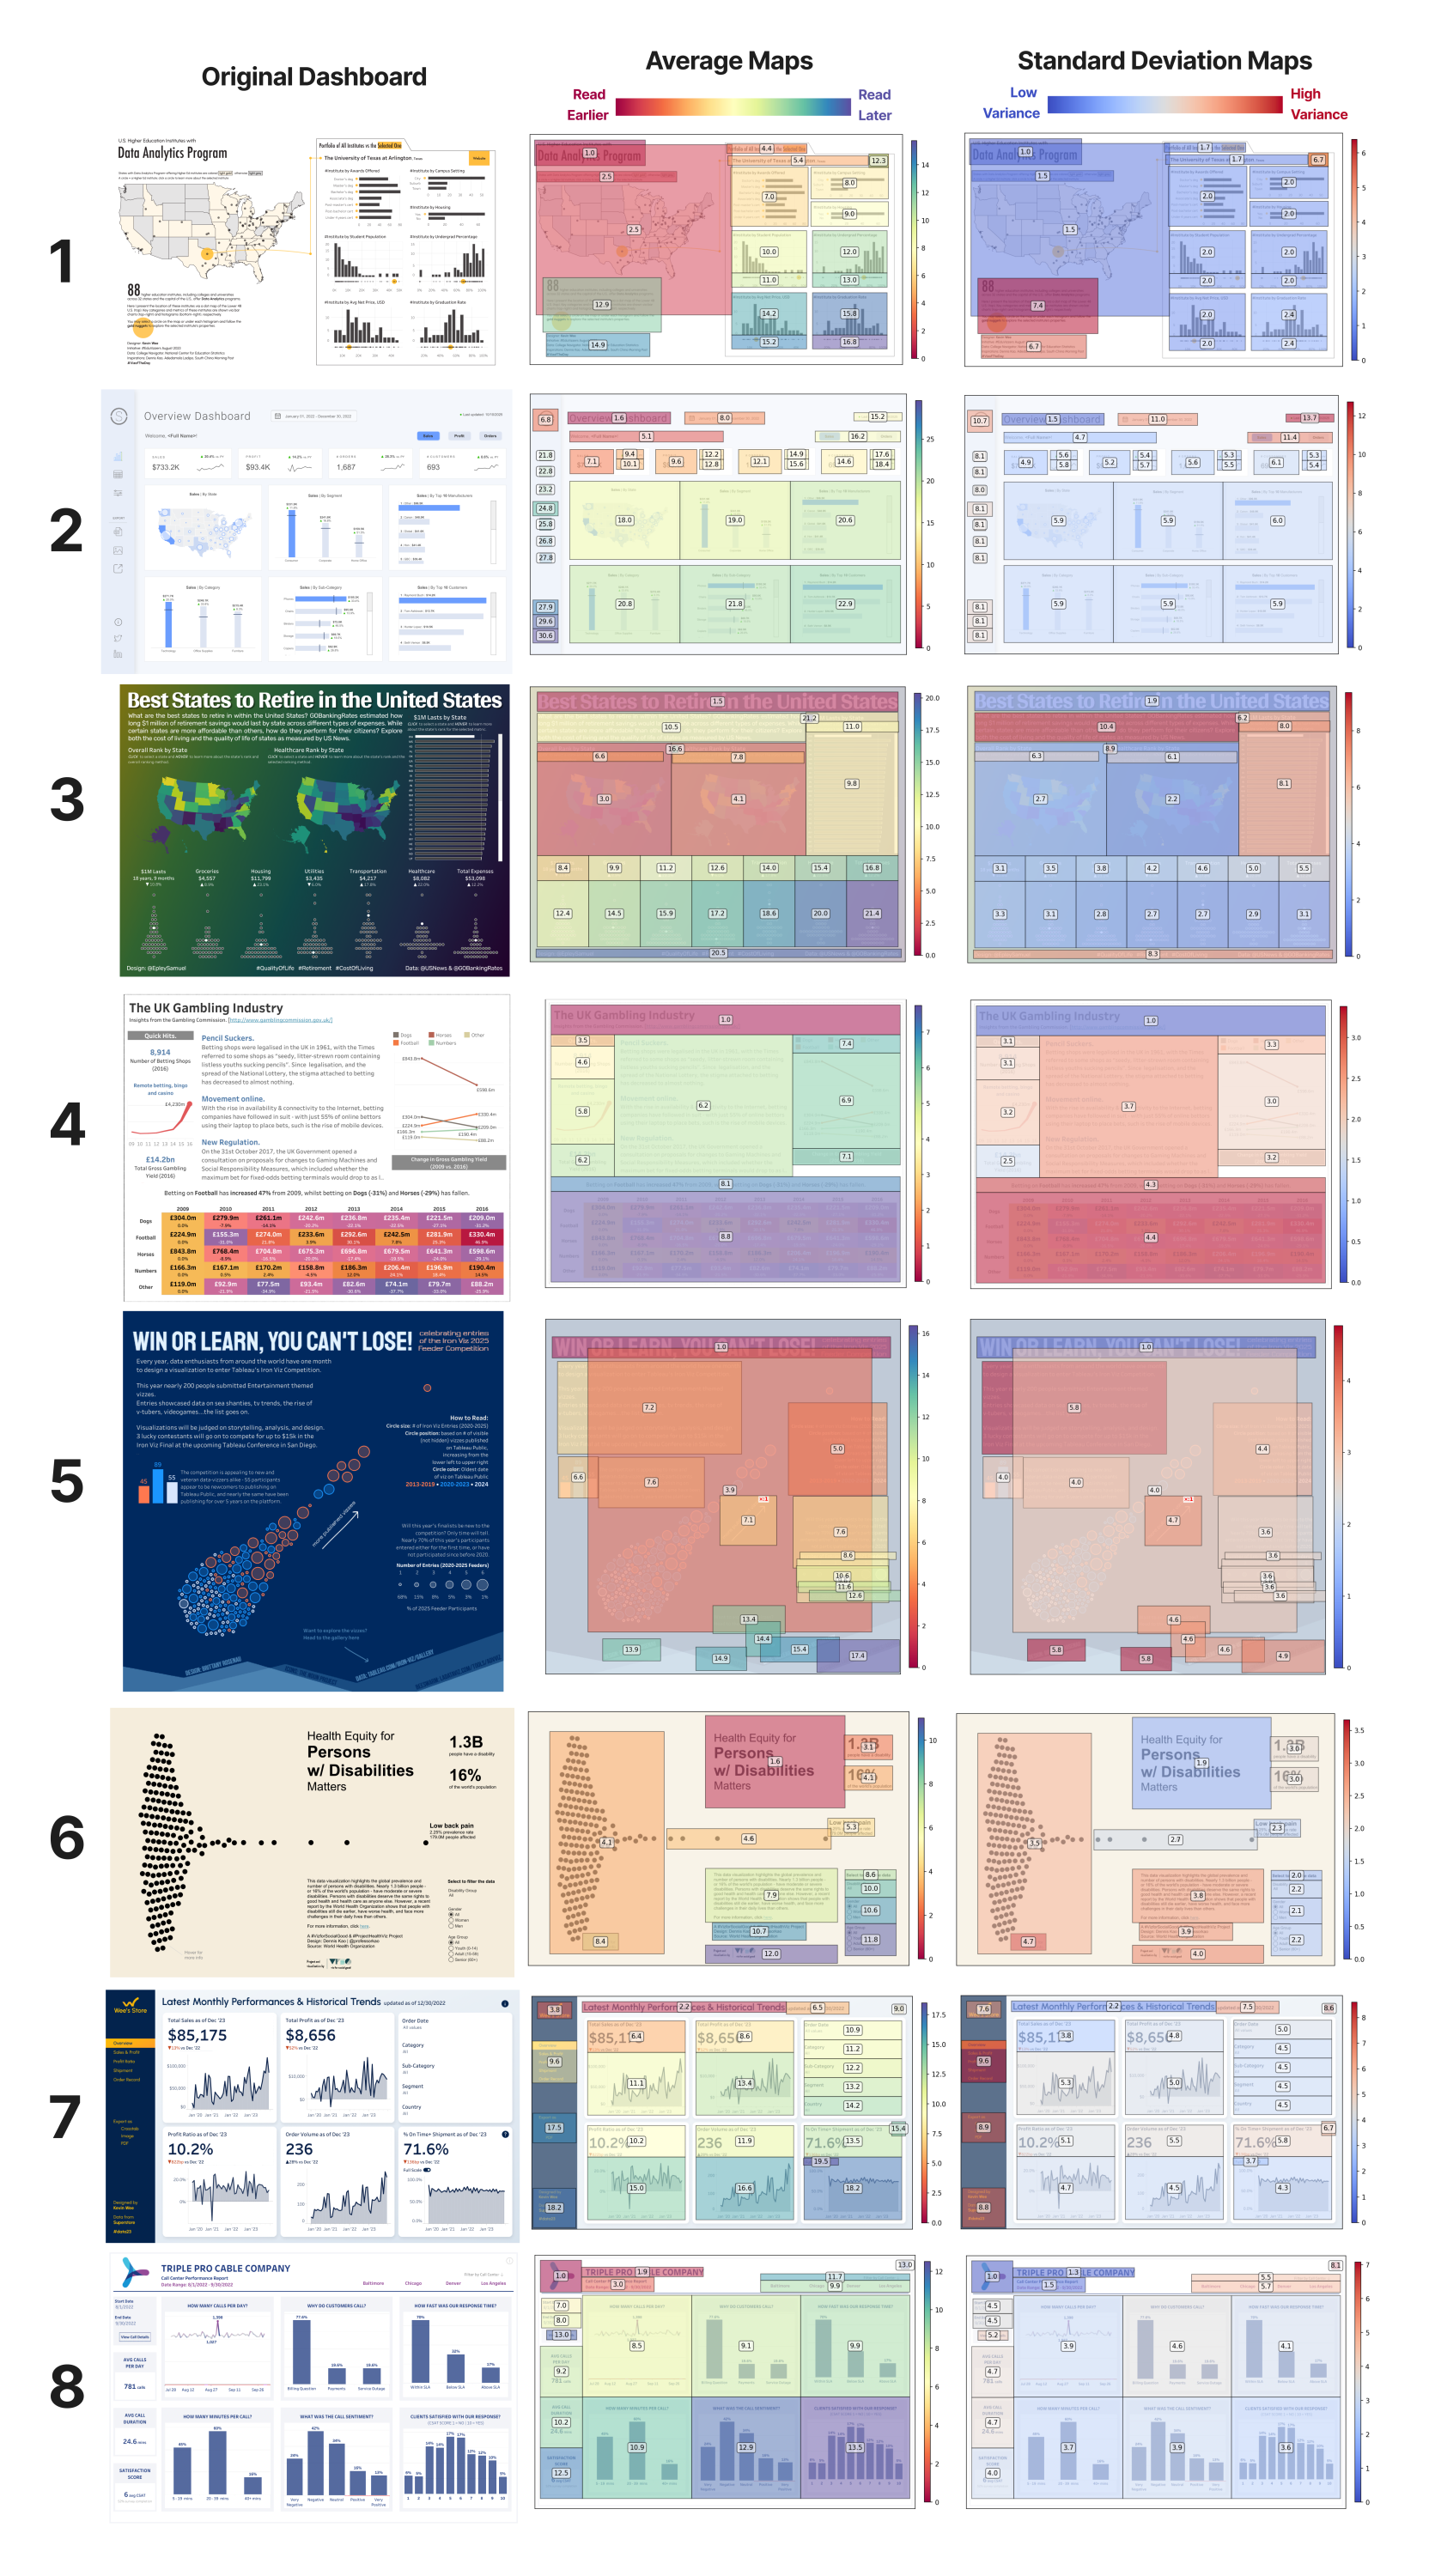
Figure 2. The eight dashboards used in the study, plus flow average and standard deviation maps.
A big thank you to creators for letting us use their dashboards in this research!
- U.S. Institutes with Data Analytics Program by Kevin Wee.
- Superstore Overview by Priya Padham.
- Best States to Retire in the United States by Sam Epley.
- The UK Gambling Industry by Ravi Mistry.
- Win or Learn, you Can’t Lose! by Brittany Rosenau.
- Health Equity for Persons w/Disabilities Matters by Dennis Kao.
- Wee’s Store Latest Monthly Performance and Historical Trends by Kevin Wee.
- Triple Pro Cable Company by Sarah Pallett.
What did we find?
The short answer: reading order is structured, but not fixed.
While participants shared common starting points and navigation tendencies, their paths diverged as they responded to different visual cues, interpreted relationships between components, and pursued different goals. Here are some of the most interesting findings, but do check our paper for more details.
Layout is a strong predictor of reading order. On average maps, we can see that the concentration of red on the top-left and purple on the bottom-right roughly aligns with the Gutenberg diagram, and confirms general expectations for top-down, left-right reading behaviors. However, layout worked more as an initial scaffold than a strict sequence. Users frequently departed from these conventions when other components appeared more informative, visually prominent, or relevant to their goals.
Saliency can significantly influence the immediate first pass on a dashboard. Large, colorful, or high-contrast charts often attracted attention early, even when they appeared outside the expected reading path. For example, the prominent visuals in Dashboards 3 and 5 drew participants away from surrounding text and other components. But attracting attention did not always help understanding. At the same time, semantically important elements without sufficient visual emphasis ended up buried in the tail end of flows, such as the KPI boxes on the left of Dashboard 8. This suggests an important distinction between attracting attention and supporting a coherent reading flow.
Titles are consistent starting points. Flows overwhelmingly and consistently started from the dashboard title, as evidenced by the extent of red in average maps (indicating an early start), and blue in standard deviation maps (indicating low variance). This trend held even when the dashboard title was outside of the top left quadrant, as seen in Dashboard 6.
Short text helps orientation; longer text is polarizing. Titles, text headers and BANs were consistently visited early, not just due to saliency but also for the readily available, summary-level information about the dashboard. Long paragraphs, on the other hand, were often deferred or skipped even in prominent locations, as seen in Dashboards 3 and 5. This behavior was frequent but not unanimous as some participants still favored early detail, leading to the divergences shown in standard deviation maps for the same elements.
Semantics shape reading flow beyond initial orientation. While titles and short text guided early flow decisions, individual strategies became more diverse deeper into the flow. Some continued to follow a gradual understanding approach by quickly scanning charts and deferring interactive deep dives for later. Others engaged with the data early, parsing each chart before moving on to the next and actively establishing correlations in the process. This was a major factor for mid-flow divergences across participants.
Low-stakes interactions happen relatively early. Interactive elements such as selectors, tabs, and filters figured later in flows, which implies their role as tools for refinement. But even as detailed analysis was deferred, participants often wanted to hover charts and take a moment to play with filters mid-flow. This suggests that interaction plays a meaningful role in early dashboard orientation.
Flows vary significantly across users. Sensemaking strategies and visual preferences were the most frequent reasons flows diverged, which happened often—no two flows were exactly the same for any of the dashboards. Even dashboard authors (who were asked to provide “intended” flows for their own dashboards on a separate occasion) were only partly successful in predicting user behaviors. That said, users followed similar flow strategies across the different dashboards we gave them, hinting at an opportunity to capture and predict flows at an individual level.
What should dashboard designers take away?
Our findings reinforce several established design practices, but also offer a more nuanced perspective on when those practices work, where they may break down, and how multiple design signals interact.
- If flow consistency is important to you, make sure that layout, saliency, and semantics align. As different users favored different design aspects of dashboards, the most effective way to avoid flow divergences is to leave little room for ambiguity in the first place.
- Leverage saliency effectively, as it can compete with layout and semantics. Make sure important information is visible at a glance, particularly summary-level information, and that secondary details do not compete for attention.
- Provide meaningful entry points. Dashboard titles, logos, BANs, and other header-level elements are essential in orienting users to the dashboard's context. Give them a little extra love.
- Use text purposefully. Key information conveyed in short, visually salient text is more likely to be noticed and visited early. Keep content as short as possible, make it salient (with good contrast and reasonable font size) and place them near or next to where the information matters most.
- Make interaction discoverable. Interaction plays a role even in early dashboard orientation, and providing clearly visible and appropriately placed interaction cues may encourage users to engage with interaction early.
- Design with diversity in mind. Different users may prioritize different components or pursue different questions. Rather than enforcing a single sequence, consider whether users can enter, navigate, and reconnect information through different paths without losing context.
Continue learning
- Read the full research paper.
- Come see Tableau Research presenting at the upcoming IEEE VIS 2026 conference in Boston.
Related Stories
Ptolemy: A Semantic Map of Exploratory Data Analysis
 October 28, 2026

Which Model Speaks Your Data Language? A User-Centered Approach to Evaluating LLMs for Conversational Visual Analytics
 April 14, 2026
Rethinking How Data Workers Revisit Analytical Conversations and Communicate Insights
 April 10, 2026