Inside the Release: Tableau 2022.3 for Analysts and Business Users


Tableau 2022.3 has arrived, delivering innovations that make it even easier for analysts and business users to uncover insights.
Improve confidence and understanding with Data Guide
A single dashboard can be full of visualizations, filters, and more. When used properly, these elements come together to produce powerful insights. But they can add a level of complexity that could be a little intimidating.
That’s why we're introducing a new capability called Data Guide. Data Guide demystifies dashboards with user-inputted context and resources, so you can get oriented with your dashboards. It provides a new level of visibility, giving you full transparency into the data behind your dashboard. And as you explore your dashboard, it helps you identify what factors—like filters and sorts—are influencing visualizations.
In Data Guide, you can access Explain the Viz which identifies outliers and helps you understand the causes behind them. These two tools help direct your focus so you can spend time on what matters.
Data Guide helps you take action faster. Getting started is as easy as opening the pane through the Toolbar. Data Guide does the rest of the work for you!
To learn more, read Explore Dashboards with Data Guide in Tableau Help.
Bring deep analytics to the core of Tableau using Table Extensions
Good visualizations start with good data. You can unlock its full potential by modifying and augmenting it.
Table Extensions bring the flexibility and power of scripting and open APIs to the data layer in Tableau,so you can integrate the scripting tools of your choice. You can query new data and perform deep data transformation and analysis using scripting, opening up opportunities to create and scale full-fledged data science applications using Tableau.
Here’s how to use Table Extensions: In Tableau’s data model, connect to an Analytics Extension and drag a Table Extension into the data model. Then, use the Script section to modify your data. Finally, run your code with the Apply button, which will return an Output table that you can use like any other data from a live connection. The result is a unified experience that supports all of your advanced analytics needs in Tableau.
To learn more, read Table Extensions in Tableau Help.
Create custom experiences with dynamic zone visibility
Personalized experiences drive better understanding. When viewing a generic dashboard, it can be hard to understand its relevance. It’s easier to understand the purpose of dashboards when they are tailored for you.
That's where dynamic zone visibility comes in, which allows you to configure when to show and hide dashboard elements without complicated workarounds. Now, you can quickly develop unique and tailored experiences for a diverse set of audiences. In turn, you can meet the needs of all your stakeholders without taking on excessive amounts of work.
In the Layout pane, just check "Control visibility using value". From there, configure when to show and hide dashboard elements based on parameter and field values. Just like that, you have an interactive dashboard that updates based on your users’ inputs and actions.
To learn more, read Use Dynamic Zone Visibility in Tableau Help.
Hone your analytical questions with Ask Data phrase recommendations
Everyone is at a different stage of their analytics journey. To make it easier for everyone to make decisions faster with data, we’ve enriched Ask Data with new capabilities.
You can already use Ask Data to build visualizations with natural language. Now it will help you hone your questions through recommendations for grouping and filtering dimensions.
Recommendations will appear as you type—or point and click—to build your query. Just click on a recommendation to add it to your query. Ask Data will automatically update it, and the visualized answer will include the change.
To learn more, read Automatically Build Views with Ask Data in Tableau Help.
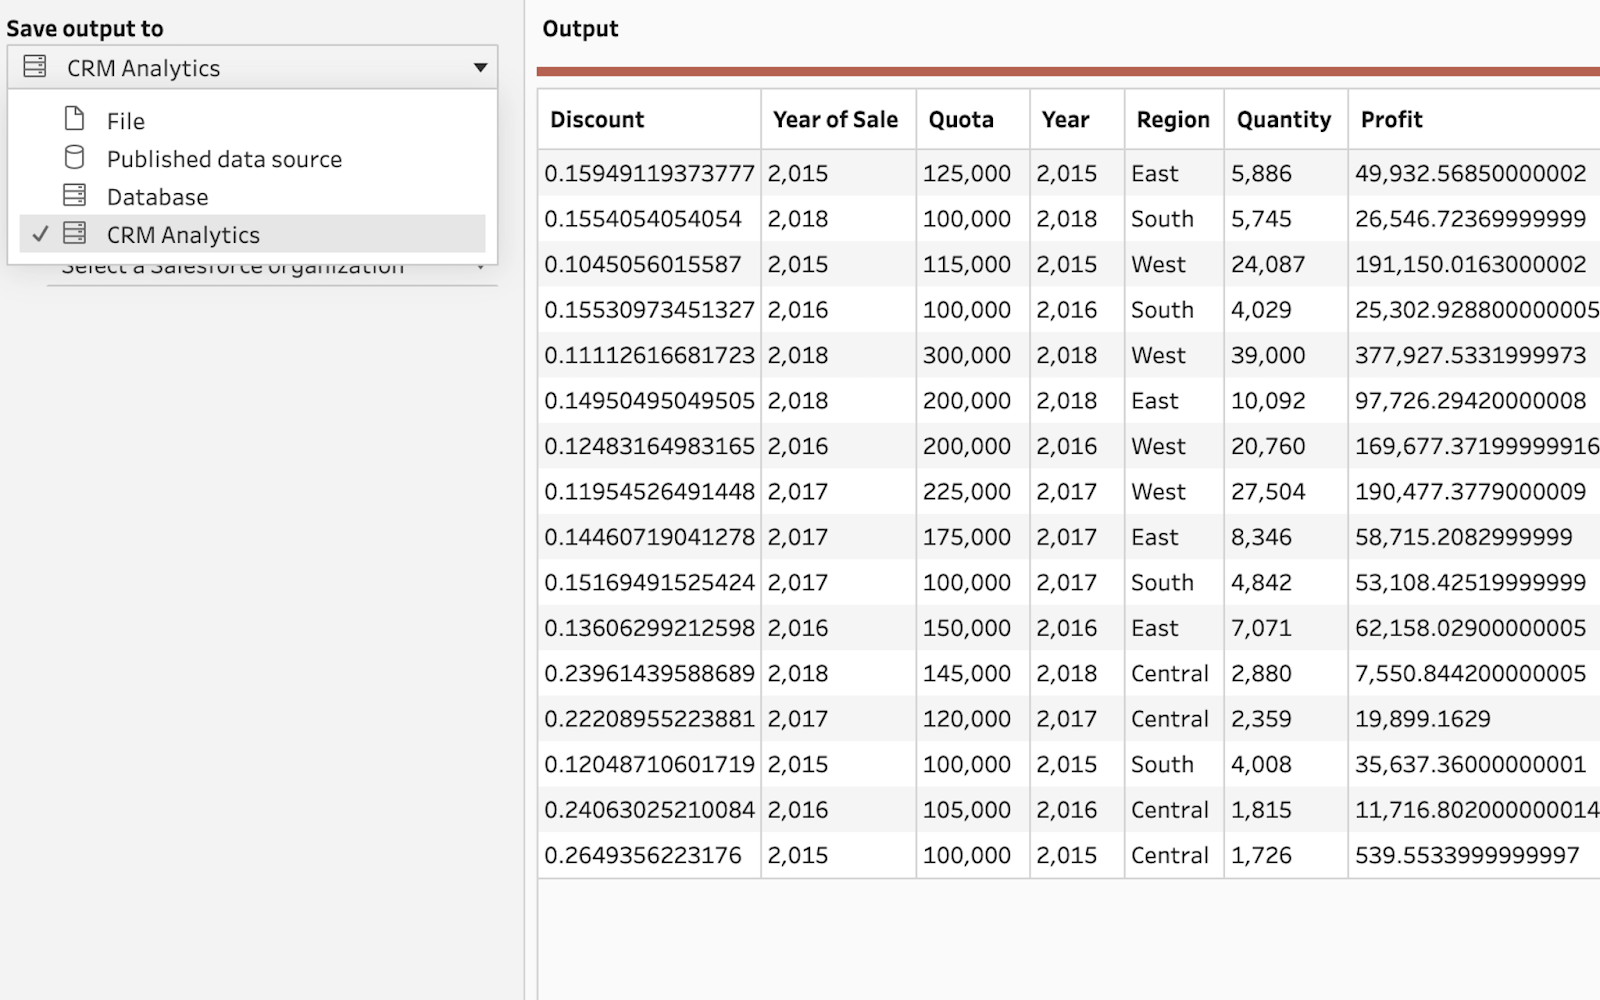
Leverage best-in-class data preparation and analysis tools using Write to CRM Analytics with Tableau Prep
Salesforce and Tableau are better together. Tableau Prep offers an intuitive way to combine, shape, and clean data. CRM Analytics provides predictive, contextual, and actionable insights in the flow of work. When combined, you get best-in-class data preparation and analysis for rich insights.
With this latest release, you can now write Tableau Prep outputs to CRM Analytics. In doing so, you can leverage Tableau Prep's native connectors to simplify connectivity. Instead of recreating data builds, you can save time and effort by using Tableau Prep flows for CRM Analytics content.
In the output step, just select "CRM Analytics" from the list of options. Once you authenticate to CRM Analytics, you can pick the app where you want to store your data.
To learn more, read Save flow output data to Datasets in CRM Analytics in Tableau Help.
Create natural-language narratives on any data with Data Stories
Even the best dashboards benefit from written summaries. With Data Stories, natural-language narratives complement visualizations to emphasize what matters most. What used to be a time-consuming task is now automated, saving countless hours.
To further speed up your time to insight, you can now generate Data Stories on any data source type. This improvement removes the step of publishing a data source and creates a more streamlined setup experience.
To get started, drag and drop the Data Story object to your dashboard. In three confirmation steps, you'll have a dynamic and customizable story before you even click Done!
To learn more, read Create a Data Story in Tableau Help.
Build visualizations with greater efficiency
There are many tips and tricks you can use to boost authoring efficiency. In Tableau 2022.3, we've introduced more to improve your productivity and Tableau's ease of use.
You can now copy dimensions as a measure in the same worksheet with a simple gesture. Simply drag a dimension using the modifier key (Windows: Ctrl, OSX: Cmd) over the dimension-measure separator.
We’ve made two key improvements to the data pane. First, when you create a hierarchy or folder, the data pane scrolls to the proper position and selects it for you. Second, you can change data type in the data pane while authoring on the web.
Finally, when authoring on the web, you now have a dynamic display of formatting settings. This provides guidance on which formatting options are available, like the new option to format borders and dividers of total and subtotal cells.
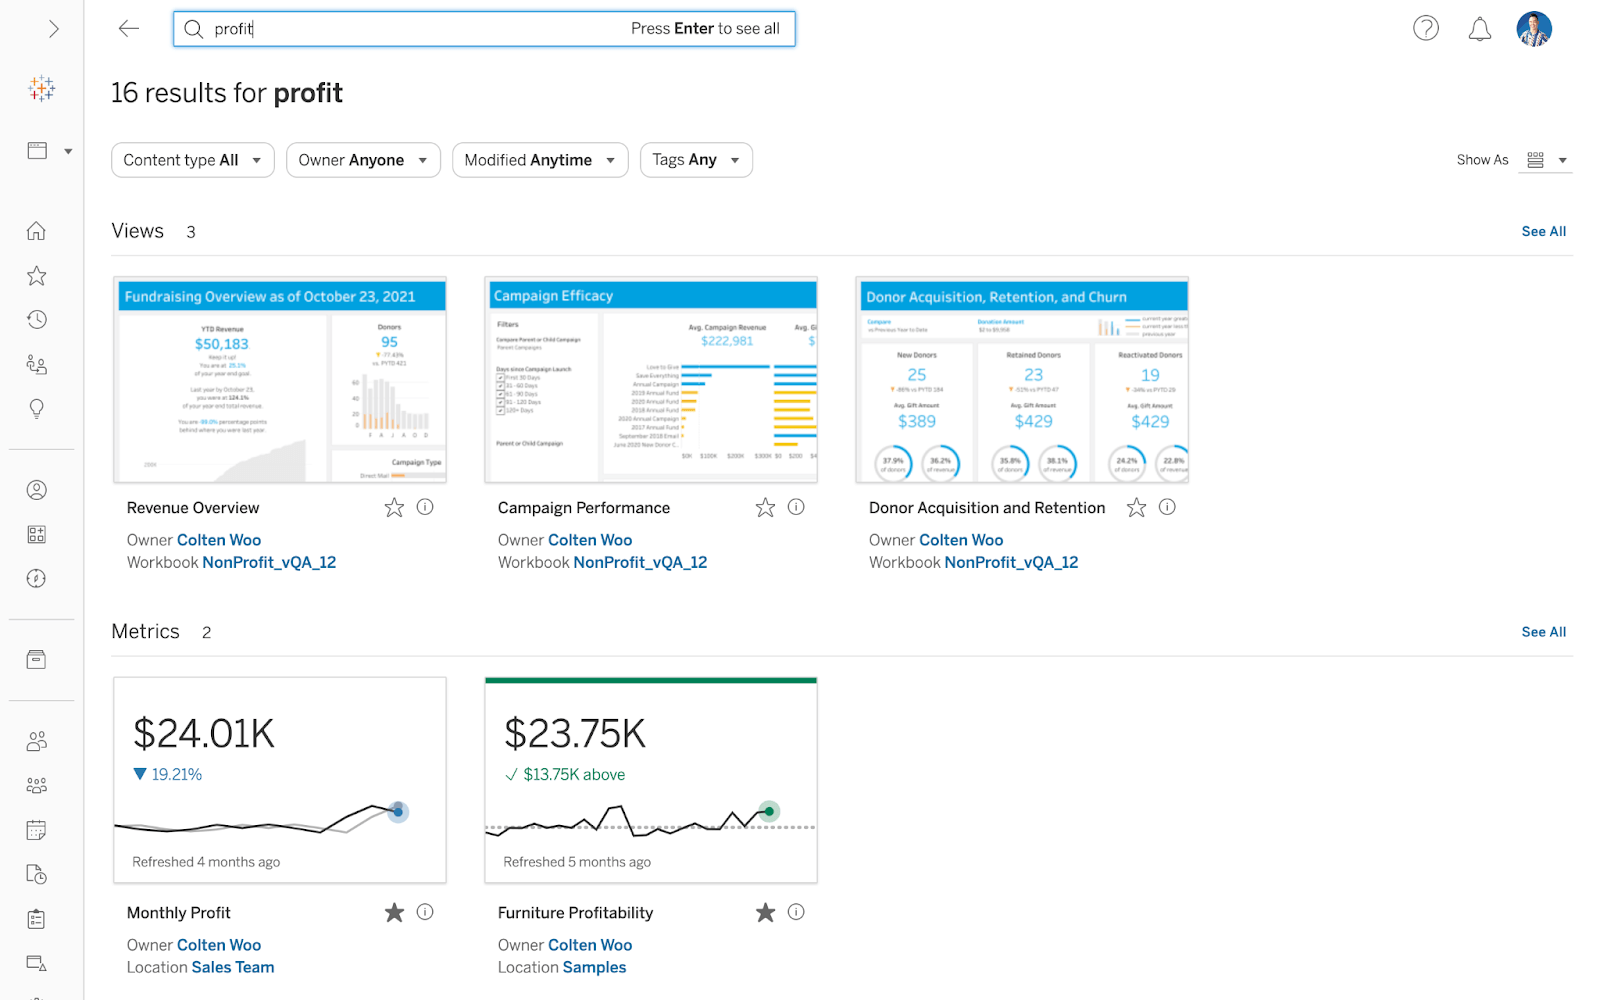
Get to relevant insights faster with personalized search results
When relevant content is hard to find, it slows down your decision making. To make data-backed decisions, you need to readily access content tailored to your needs.
We've been improving our search experience with every release to ensure useful content is surfaced early. With Tableau 2022.3, we've infused personalization into search results, which reflect your personal preferences and usage. To get into specifics, search now incorporates signals based on content you’ve previously viewed and favorited.
Stay aligned with your team with improvements to sharing
Sharing content with your colleagues ensures everyone is working off the same information, creating alignment and focus. To further assist with content discovery, we've modernized the sharing experience.
You can now seamlessly share and manage permissions. If you share content with users who do not have access, Tableau will send you a prompt to grant them access. Other features new in Tableau 2022.3 include sharing content via Tableau Mobile and expanding sharing in Explain Data to include email and Slack so you can stay in sync with your team around relationships in your data.
Want more?
- Upgrade Tableau today to take advantage of these capabilities and many more.
- See the full list of new features from our latest releases, or get the highlights from Tableau 2022.3 in our release announcement.
- Watch this recorded webinar for demos of the Tableau 2022.3 features.
- Visit the Ideas forum and let us know what you want to see next in the Tableau platform.
- Explore the Tableau Release Navigator to find out which version of Tableau has the mix of features your organization needs.
Related Stories
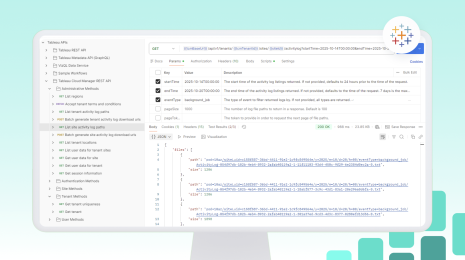
Monitor Tableau Cloud Deployments of Any Size with the Platform Data API
 January 2, 2026
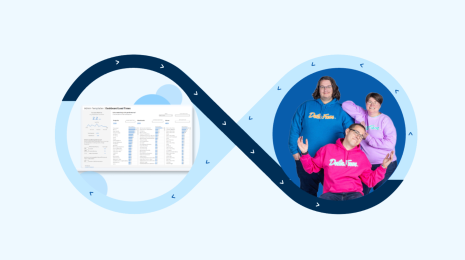
Tableau New Features Released in 2025 from Community Ideas
 December 30, 2025

Get Interactive with Dynamic Spatial Parameters in Tableau
 July 31, 2025