DataFam Roundup: December 12-16, 2022


Welcome! Dig into this week's DataFam Roundup—a weekly blog that brings together community content all in one post. As always, we invite you to send us your content—and the DataFam content from your peers that have inspired you! Find the content submission form here.
DataFam content

Ken Flerlage, The Flerlage Twins: Half Donut Chart in Tableau
Dive into content created by the Tableau Community:
-
Claire Niemeier: The Music of Data
-
Esther Odiri Metieh: Game of Thrones Casualties Visualization — My First Tableau Project
-
Ken Flerlage, The Flerlage Twins: Half Donut Chart in Tableau
-
CJ Mayes: Data Mavericks with Zach Bowders
-
Prasann Prem: Continuous and Discrete in Tableau
-
Anne-Sophie Pereira De Sa: Viz 7 wonders: how I created my viz
-
Tim Ngwena, Tableau Tim: Tableau Image roles: Working with Images in Tableau | New in Tableau 2022.4
-
Vicky Wells, MuleSoft Blog: How to generate business value with a modern data stack
Team Tableau
Upcoming events and community participation
-
Community Calendar and Upcoming Events: stay up-to-date on the latest Women in Dataviz events and other data visualization-related events. If you'd like to submit an event to the calendar, please fill out this form.
Vizzes
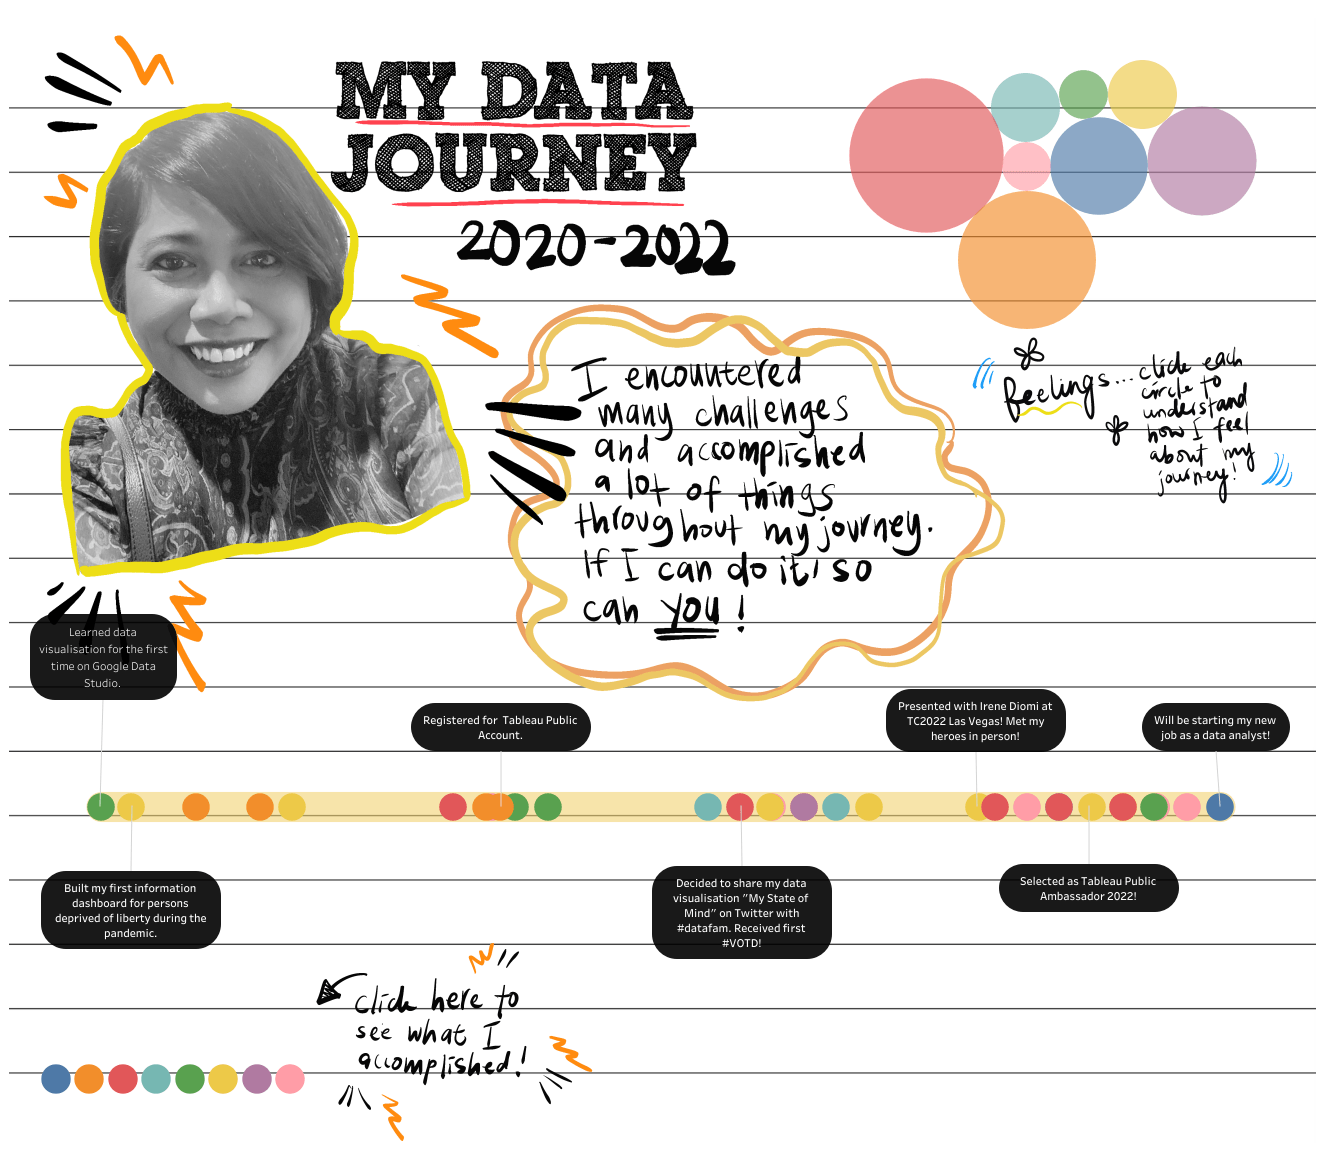
Shazeera Ahmad Zawawi: My Data Journey
See the latest Viz of the Day, trending vizzes, featured authors, and more on Tableau Public.
Check out some inspirational vizzes created by the community:
- Shazeera Ahmad Zawawi: My Data Journey
- Jeff Plattner: NBA Lords of the Rings
- Nir Smilga: FIFA rankings vs World Cup Finals
- Zsofia Nika: Which country gets the most paid vacation days? MakeoverMonday
-
Aakarsh R: Countries with most paid vacation days - #MakeOverMonday
-
Muhammad Azhar: Paid Vacations Worldwide
-
Felipe Sebben: MoM 2022 - wk 49 | How Americans Perceive Demographics
-
Rebecca Finlay: Unpaid work done by Men and Women
Community Projects
Back 2 Viz Basics
A bi-weekly project helping those who are newer in the community and just starting out with Tableau. Not limited just to newbies!
Web: Back 2 Viz Basics
Twitter: #B2VB
Week 25: Use an Image
Workout Wednesday
Build your skills with a weekly challenge to re-create an interactive data visualization.
Web: Workout Wednesday
Twitter: #WOW2022
Week 49: Can you make a pie chart?
Makeover Monday
A weekly social data project.
Web: Makeover Monday
Twitter: #MakeoverMonday
Week 49: How Americans Perceive Demographics
Preppin' Data
A weekly challenge to help you learn to prepare data and use Tableau Prep.
Web: Preppin’ Data
Twitter: #PreppinData
Week 49: Cleaning Status History (HR month)
DataFam Con
A monthly challenge covering pop culture and fandoms.
Web: DataFam Con
Twitter: #DataFamCon
November 2022: Don’t blink, or you’ll miss traveling through space & time.. and data!
EduVizzers
A monthly project connecting real education data with real people.
Web: Eduvizzers
December 2022: Salaries by College Type
Games Night Viz
A monthly project focusing on using data from your favorite games.
Web: Games Nights Viz
Twitter: #GamesNightViz
October 2022: IronViz Edition: Tips from the Team
Iron Quest
Practice data sourcing, preparation, and visualization skills in a themed monthly challenge.
Web: Iron Quest
Twitter: #IronQuest
November 2022: Weird or Wonderful
Public Policy Viz
Bridging the gap between analytics professionals and policy practitioners.
Web: Public Policy Viz
Twitter: #PublicPolicyViz
Project 1: Redlining in Pittsburgh, PA
Data Plus Music
A monthly project visualizing the data behind the music we love!
Web: Data Plus Music
Twitter: #DataPlusMusic
July 2022: The Intro
Storytelling with Data
Practice data visualization and storytelling skills by participating in monthly challenges and exercises.
Web: Storytelling with Data
Twitter: #SWDChallenge
November 2022: comedic charts
Project Health Viz
Uncover new stories by visualizing healthcare data sets provided each month.
Web: Project Health Viz
Twitter: #ProjectHealthViz
August 2022: Mental Health Care Professionals Shortages
Diversity in Data
An initiative centered around diversity, equity & awareness by visualizing provided datasets each month.
Web: Diversity in Data
Twitter: #DiversityinData
September 2022: Global Women
Sports Viz Sunday
Create and share data visualizations using rich, sports-themed data sets in a monthly challenge.
Web: Sports Viz Sunday
Twitter: #SportsVizSunday
October 2022: Row, row, row your boat
Viz for Social Good
Volunteer to design data visualizations that help nonprofits harness the power of data for social change.
Web: Viz for Social Good
Twitter: #VizforSocialGood
Sept 2-Sept 30 2022: India Water Portal/Arghyam
Real World Fake Data
Create business dashboards using provided data sets for various industries and departments.
Web: Real World Fake Data
Twitter: #RWFD
Session 3: Community Service Requests
SDG Viz Project
Visualize data about Sustainable Development Goals provided by the World Health Organization.
Web: SDG Viz Project
Twitter: #TheSDGVizProject
Related Stories

DataFam Roundup June 2026
Tableau Ambassador Nominations and Applications are Open
 June 10, 2026
