Touchdowns and Trends: College Football Through Data Visualization


Hello college football fans! My name is Sam and I am a Lead Solution Engineer at Tableau. My journey into the world of data visualization has led me to embrace a unique passion: college football. As a former student equipment manager at Iowa State University (#CyclONEnation), college football became an integral part of my life and shaped my interests and passion around collegiate athletics. Now, after over three years of engaging with the #DataFam on Tableau Public, I'm excited to present a curated collection of college football data visualizations that capture the sport's essence like never before.
College football isn't just about games; it's about stories waiting to be told. My journey has revolved around using data to explore these untold narratives. From fierce rivalries that ignite stadiums to the intricacies of conference realignment, the visualizations presented here offer fresh perspectives on familiar and fascinating topics.
Explore heated rivalries, conference realignment, Heisman Trophy winners, stadium capacity, fan maps, game predictions—the topics are endless! See how college football can be visualized with the curated collection below showcasing some incredible vizzes from the Tableau Community. Click on each viz to visit it on Tableau Public, Tableau’s free online platform used to explore, create and publicly share data visualizations.
College Football Tableau Public visualizations by Sam Epley


College Football Rivalry History

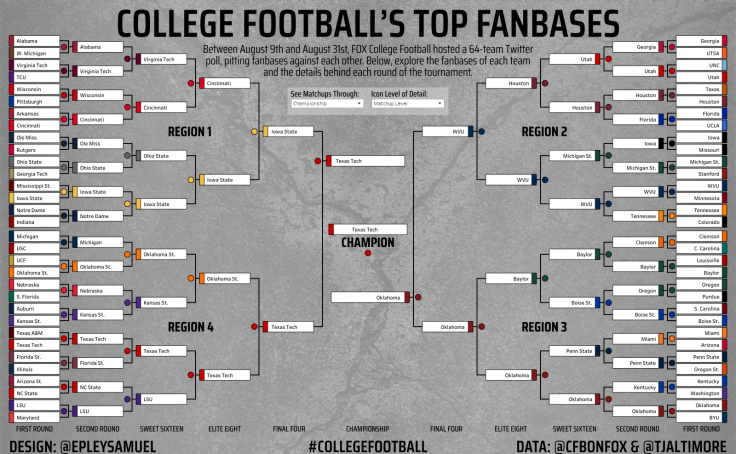
College Football’s Top Fanbases
14 College Football Visualizations by the DataFam

College Football Blue Bloods

A Visual History of College Football

Striking The Pose

College Football Rankings
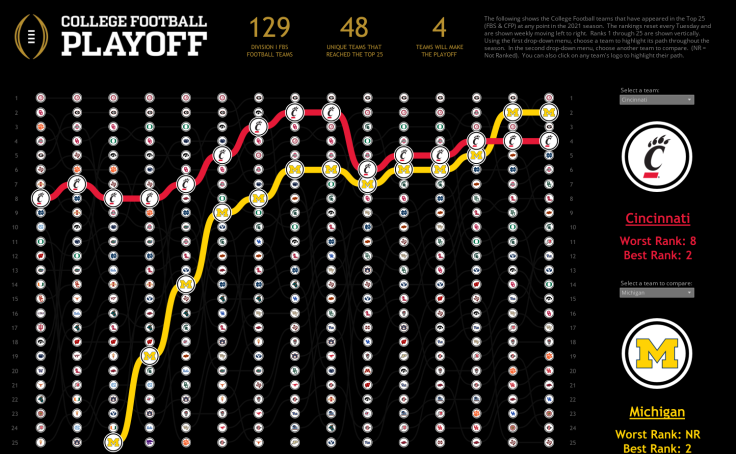
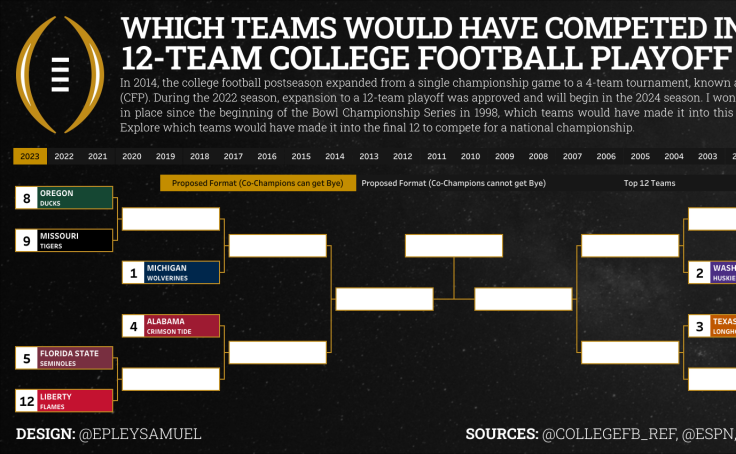
Road to the College Football Playoff
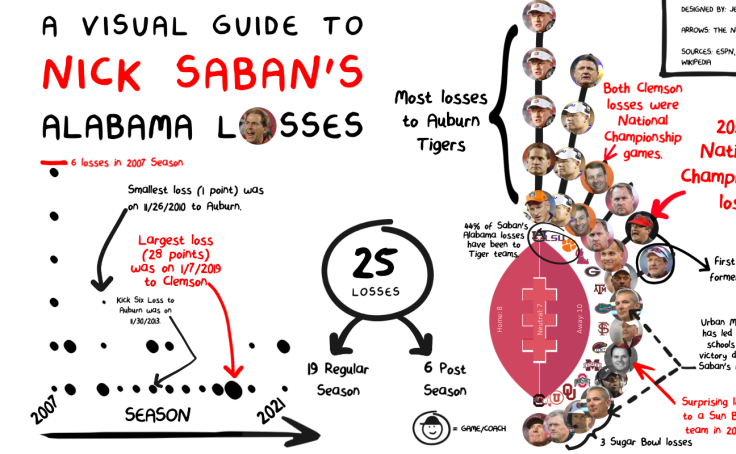
Nick Saban’s AL Losses
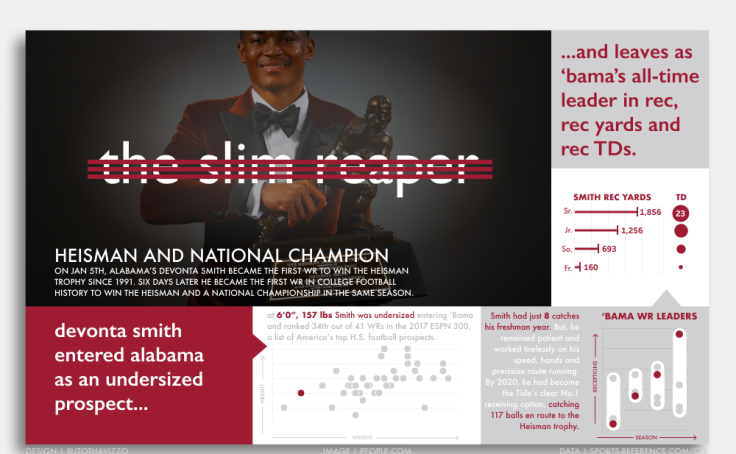
DeVonta Smith

College Football Fan Map
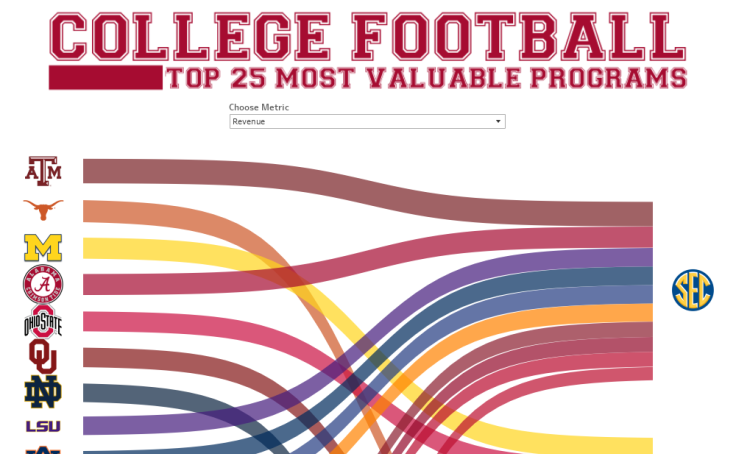
College Football’s Most Valuable Teams

Michigan Football: A Visual History
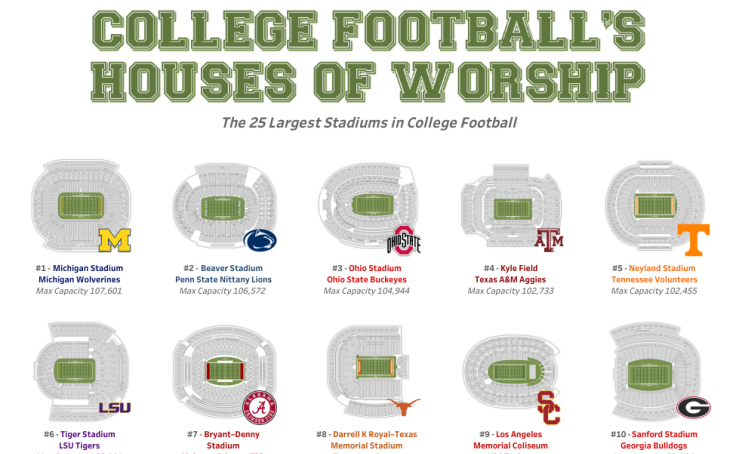
College Football’s Largest Stadiums
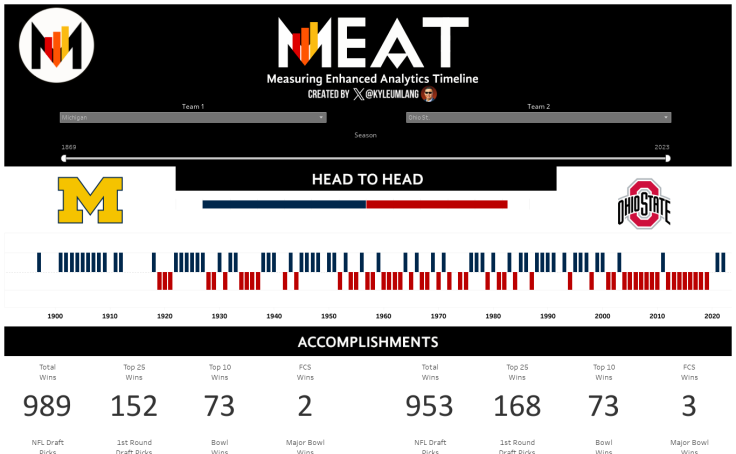
Measuring Enhanced Analytics Timeline (MEAT)

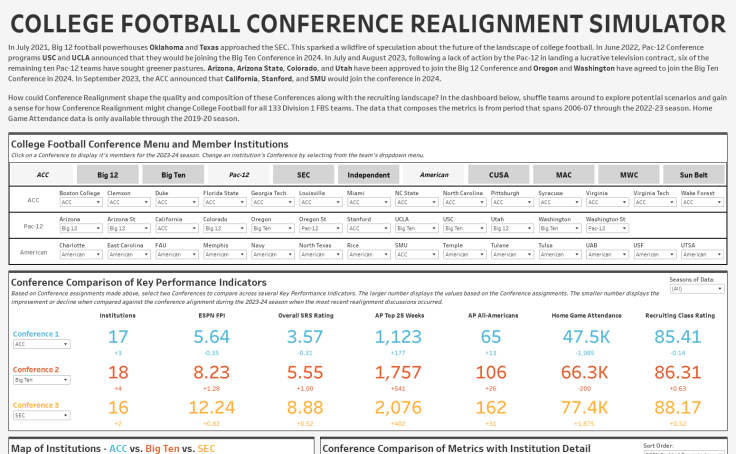
College Football Conference History
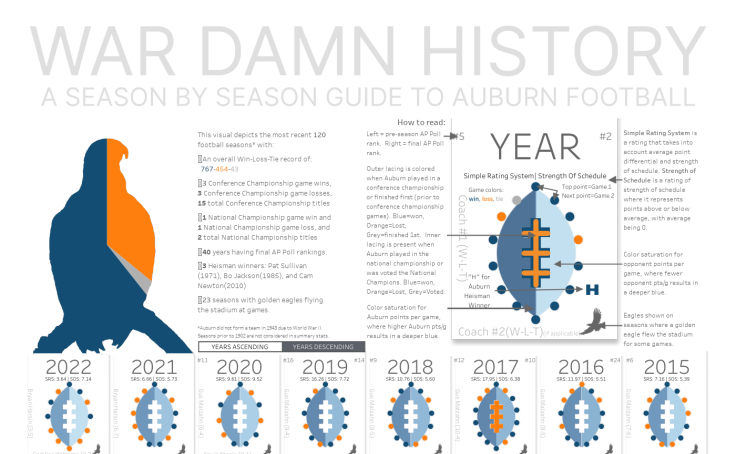
War Damn History
Related Stories

DataFam Roundup June 2026

Tableau Ambassador Nominations and Applications are Open
 June 10, 2026
