Alliance for Boys and Men of Color: Driving state and local policy change through data
Foreword by Clifford Hodges. Clifford is a Strategic Customer Success Manager for Tableau based in Kennesaw, GA.
February is Black History Month. If you are not part of the community, you may find it easy to tune out the information that arises throughout the month. You may believe celebrating Black History does not relate to your experience, but I disagree—I think everyone can use this month to share and learn. Black history is a part of HISTORY and an opportunity to focus on inclusion of the past and future as a human and business imperative. At Tableau, we are all about the data so let me share a few facts:
- If properly implemented, diversity efforts could net the IT industry an extra $400 billion in revenue each year. According to CompTIA CEO, Todd Thibodeaux, “Companies in the top quartile for ethnic and gender diversity are more likely to surpass industry norms for revenue and operating margin. Companies in the bottom quartile for diversity aren't just lagging behind, they are rapidly losing ground."
- A higher percentage of black college graduates (2.8%) earn degrees in computer science than whites (2.6 %), yet blacks make up less than 5%of the workforce in social media and technology companies (National Urban League).
- Compared to overall private industry, the high-tech sector in 2014 employed a larger share of whites (68.5% tech vs. 63.5% private sector). It also employed a smaller share of African Americans (7.4% tech vs. 14.4% private sector), according to the US Equal Employment Opportunity Commission (EEOC).
At Tableau, we recognize this business opportunity with our ongoing #VisualizeDiversity initiative, and we are excited to feature two blogs in the month of February. In this post, you’ll hear from one of Tableau Foundation’s newest partners, PolicyLink, on their work with the Alliance for Boys and Men of Color (ABMoC), a grassroots network of over 200 organizations and community leaders across nine states. PolicyLink uses data to build communities of opportunity and advance racial and economic justice so that all boys and men of color can reach their full potential.
Later this month, we’ll celebrate African American scholar and activist W.E.B. Du Bois as Jason Forrest explores the impact of Du Bois’s “The Exhibit of American Negroes” at the Exposition Universelle of 1900.
Tag #VisualizeDiversity on Twitter throughout February and we’ll post the most interesting, innovative, and inspiring to our Tableau Public gallery—coming soon.
_________________________________
Across the country, boys and men of color are leading the way towards building healthier and safer communities. However, it is no secret that our communities are struggling with a web of laws, institutions, and systems that often act as barriers to the success of boys and men of color in America.
At PolicyLink, which coordinates the Alliance for Boys and Men of Color (ABMoC), we lift up the voices and leadership of boys and men of color and their families in our campaigns to win policy changes that are essential to the health and strength of our communities.
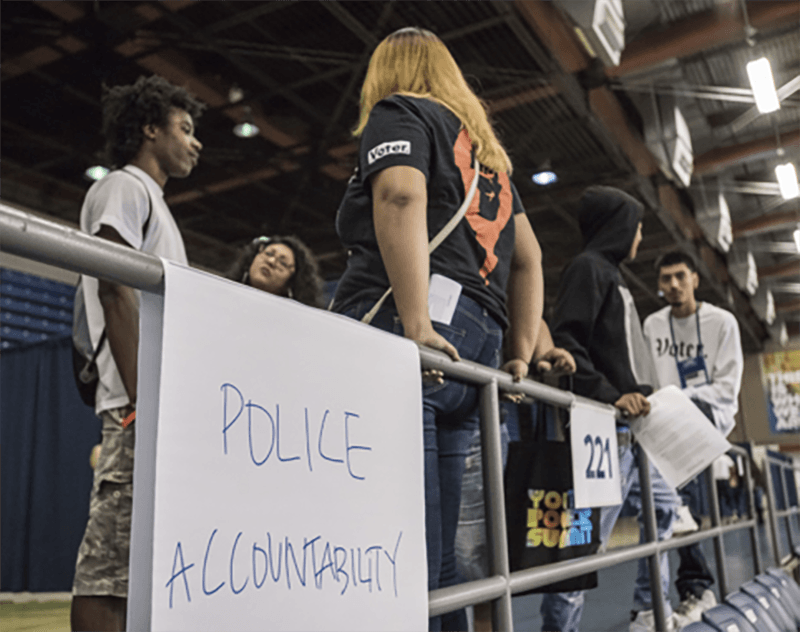
These policy solutions are created by the people directly impacted people by these problems. They address root-causes that can often be invisible to outsiders, but easily seen through the data. As our partners often say, “The people closest to the pain are the ones closest to the solution.” Together, we build power across issues like police accountability and student rights, and deepen our impact by learning from and supporting each other.
In our advocacy, data allows us to measure the disparate impact certain policies have on our communities, measure the magnitude of a problem, and enable us to pinpoint the root causes of the harm. We can also identify interventions, ensure that we design solutions at scale to address the problem, and finally, data allows us to monitor the impact of the work.
Data fellowship
Every day, ABMoC leaders are working in their state capitols and communities to change laws and improve outcomes for boys and men of color, but they don’t always have the data capacity they need to illustrate the inequities in their community, and the potential impact of policy proposals.
That’s why we are partnering with Tableau Foundation to launch the inaugural 2019 ABMoC Data Fellowship. The fellowship will allow community leaders to grow their data capacity and support their ability to educate policymakers and hold them accountable to their commitments, while inspiring further collective action to enact policy change that can improve the lives of everyone in their community.
Policy wins for greater data access and transparency
Over the years, we’ve encountered challenges in properly understanding the magnitude of a problem because data is not publicly available or may simply not exist.
In 2015, the Alliance advocated for and won AB 71 (Rodriguez) which mandated that every law enforcement agency in California furnish a report to the California Department of Justice (DOJ) detailing any officer-involved use of force incidents. In 2017, the data became publicly available through the Attorney General’s OpenJustice data portal.
Drawing on data enabled by AB 71, a January 2019 Los Angeles Times report found that Blacks and Latinos were injured or killed by law enforcement in California in greater percentages than their share of the population. Of the 741 violent encounters in 2017, Blacks and Latinos accounted for about two-thirds of the incidents—a significantly larger percentage than their combined share of California’s population. Through our advocacy, we now have a deeper understanding and community partners are advancing policy interventions to address the problems revealed, in part, by the data.

Leveraging data in advocacy
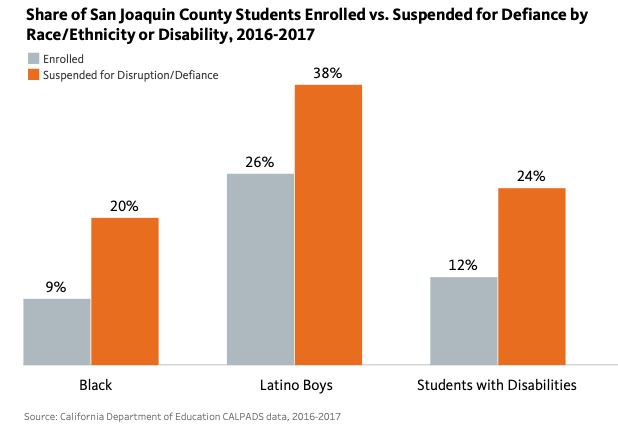
Last year, ABMoC advocated for SB 607 (Skinner), a California bill that would have expanded the state’s ban on so-called “disruption and defiance” suspensions for kids in grades K-8. The Alliance worked with the American Civil Liberties Union (ACLU) to leverage data in advocating for the policy change. The chart below, an example from San Joaquin County, demonstrates the disparate impact of these suspensions. Black, Latino boys, and students with disabilities were significantly more likely to be suspended for willful defiance-related suspensions as compared to their share of enrollment.

The Alliance shared factsheets with partners about their respective counties. The disaggregated data showed the glaring racial disparities of willful defiance-related suspensions that persuaded important stakeholders like the Association of California School Administrators to switch from opposing the bill to supporting it. In the end, though the bill in full was not signed by former Governor Jerry Brown, ABMoC was successful in winning a permanent ban on willful defiance expulsions for all grades and suspensions for grades K-3. In 2019, the Alliance will push for a permanent ban for the remaining grade levels.

What’s next?
Situations like this are part of the reason we are excited to partner with Tableau Foundation to advance racial and economic justice and improve the lives of boys and men of color. We’re committed to democratizing data in 2019 by:
- Building the data capacity of The Alliance’s grassroots partners through the Data Fellowship
- Developing a Dashboard that will visualize key indicators to advance learning, reveal disparate impact, and identify advocacy opportunities in four California counties
- Enabling greater integration of data into policy campaigns
We are honored to be joined by Tableau and our community partners on this journey towards greater use of data advocacy. We look forward to bringing these skills to more partners in our movement for racial justice and deepening our collective commitment to using data for the public good.
Follow us on Twitter and Facebook to keep up to date on our fellows program and advocacy with data.


