Build a custom web analytics dashboard with these resources


Ready to start building a custom web analytics dashboard? This post continues a series of posts based on the Tableau Conference breakout session Tableau on Tableau: Advanced Website Analytics (Hear the audio here). In this post we'll provide resources for you to build your own advanced web analytics dashboard. Most of these are resources we used ourselves (or discovered after we did it the hard way).
For those who couldn’t attend Tableau Conference 2017, I’ll briefly recap what we covered in our Advanced Web Analytics breakout session. For those of you who were there and don’t need a recap, no worries—jump to the main content
Web analytics session recap
Our session, Advanced Website Analytics, focused on how two of Tableau marketers—Hannah, a Senior Analyst and Josh, an SEO specialist—addressed the need for a single source of truth in our web analytics at Tableau. Create a login on the TCLive website to listen to our presentation.

Over 50 percent of marketing departments use at least 10 tools, according to a Hubspot survey. Google Analytics, Adobe Analytics Cloud, and Mixpanel may all be current sources of website traffic data, but they aren't the only ones. Marketers use a host of tools that include search engines, Google Adwords, social media platforms, email marketing programs, and over a dozen flavors of web content management systems (CMS). Each of these adds another chapter to the story of your site's web traffic and each has different KPIs. Interpreting all this data is difficult, not just for the individual contributors (ICs) reporting on their work, but for non-subject matter experts like CMOs, VPs, and board members who consume the reports. This means the IC’s have to spend extra time typing out a synopsis of what’s going on with the data and why. It’s a hassle and, frankly, not the best use of time. We set out to create a reporting dashboard that was intuitive, regardless of who was using it, and that told the whole story of the website’s traffic.
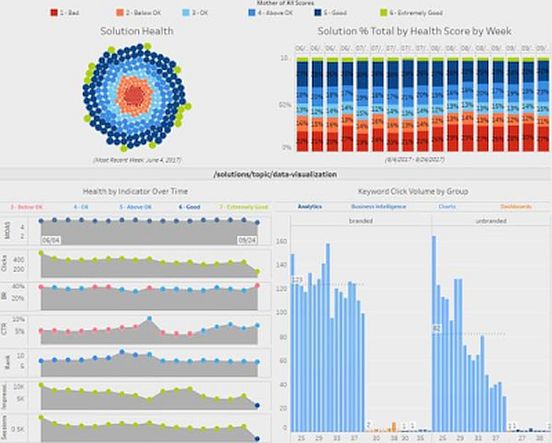
We ended up with a set of dashboards that drill down in detail from whole-site metrics, to categories, to pages. Each dashboard tracks business-level and detail-level KPI's in each viz. We created some custom metrics to simplify the visuals and get right to the heart of what’s happening with our organic web traffic. It’s a work in progress and we’re sharing it with you as we go. Our dashboards have been exceptionally useful to us and we think they'll be useful to you as well.
This post will cover all the resources we used to create our custom web analytics dashboard.
Building your own web analytics dashboard in Tableau
While Hannah, my Analyst colleague, and I are pretty experienced in our respective fields, this project required a lot of knowledge we didn’t have. From database development and ETL writing to the secret calculations of Google Analytics, we had to consult a lot of other sources. Fortunately, there were plenty of people who’d chronicled their work on bits and pieces of what would become our whole.
Below is a list of resources and short descriptions to help you find the information you need to get your web analytics Tableau dashboard off the ground. This information will give you something to help with planning and thinking about what you want to build, as well as other sources of information to get the ball rolling. It's been a fun journey so far (if a little frustrating at times) and we hope you'll build along with us.
What data do you need in your web analytics dashboard?
First things first: the size of your company is going to determine how you approach this. For large companies—or perhaps medium-sized companies with LOTS of data and lots of software—you’ll probably want to use a data warehouse such as Google BigQuery or Amazon Redshift. If you’re using Google Analytics 360, good news! This is as simple as flipping a switch. In fact, Lunametrics has a great post on how to get started with GA360 and BigQuery.
For non-Google Analytics 360 users, there’s some work to be done and as far as we can tell, it’s similar work for non-Google Analytics users. You’re going to want to get the data out of your tool and into a database. It doesn’t really matter what type of database, as long as Tableau can connect to it. Here’s some helpful posts on getting that data into a Tableau-consumable format:
- Adobe Marketing Analytics Data Warehouse Integration
- Exporting data from Mixpanel
- Exporting Piwik Data
- Export Google Analytics Data using reporting app script
If you're using a different web analytics platform you can ETL your data to a database of your choosing. Many web analytics platforms also allow you to export data in CSVs, which you can use to populate a database. You can also use ETL tools like Alooma or middleware product Fivetran to drop your Google Analytics data into a data warehouse. They also have the ability to combine that data with other, non-GA data; sort of like what we did with our database.
Data shaping and calculations for web analytics dashboards
As you may have heard in our talk, we had ignored a lot of best practices in order to get a working prototype up and running. Don’t make this mistake. Do it right from the start.
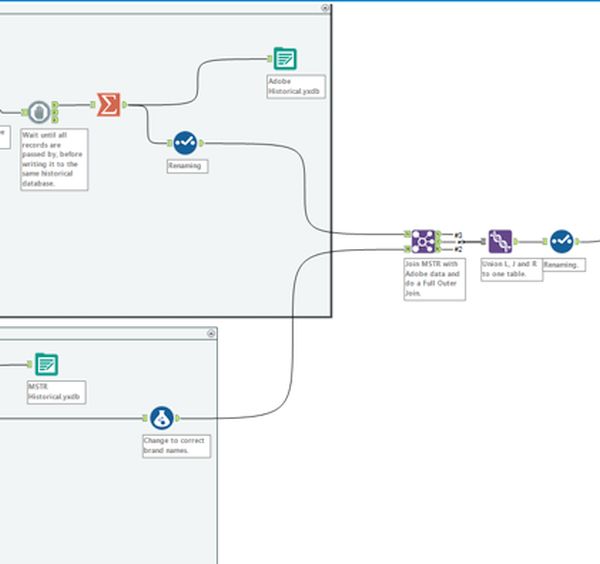
We used Alteryx to join and shape data and perform calculations, all with the goal of creating a more performant database and more performant queries. We even used it to help create custom metrics and scoring models. It isn’t a required step though, most of what we did in Alteryx can be done in BigQuery. Alteryx just allowed us to do it without code. We’ll walk through this in more detail in a later post since this is some heavy lifting.
What will your web analytics dashboard track?
Knowing your metrics seems pretty obvious, but is it? In order to keep queries optimized and data clean, you’ll want to track just your core metrics. You can do this by channel to keep it concise. Our suite of workbooks are focused on organic, but we’ll later create dashboards for other web traffic channels such as Paid and Social, then connect the group.
Not sure if what you’ve been tracking is what you should be tracking? Start with these resources:
- 7 core web analytics metrics everyone should be tracking
- Social media metrics you can’t miss
- Essential PPC analytics metrics
It’s important for you, the individual contributor, specialist, etc. to track the website metrics you need to do your job. It’s also important to be mindful of the KPI's your managers, VPs, and CMOs/CEOs will want to see. Plan for these now. Ask questions and be sure to create web analytics dashboards that answer their questions. A great web analytics dashboard will anticipate their questions ("What is that spike/trough?", "What campaigns were running?", "Did the increase in traffic translate to an increase in conversions?") and deliver the answers with a click.
New to Tableau dashboards?
No problem. For this project one of us had experience with Tableau and the other did not. Fortunately, Tableau has plenty of free training videos that can help you learn the skills you need to build effective vizzes and communicate your data clearly. View our library of free training videos here. You can also learn how to leverage Tableau’s features to get more from your metrics than mere stats.
How data-driven is your marketing strategy? Determine where your department lands on the spectrum of analytical maturity.
Related Stories

VizQL Data Service from Tableau: Use Your Data, Your Way
 August 8, 2024

When and How to Use Multi-fact Relationships in Tableau
 August 1, 2024

Top data books of 2021
 December 12, 2021