Find hidden insights in your data: Ask why and why again


Note: This piece first appeared in ComputerWorld.
We’ve all encountered a curious little kid who wouldn’t stop asking “why.” But did you ever think that, in the business world, you should actually aim to be that kid? That’s because people—whether we’re talking about children, journalists, scientists, managers, or data analysts—don’t succeed by simply asking “what.”
Let’s say sales are down, costs are high, and resources are underused—all familiar scenarios, right? Being able to identify these problems is the easy part. The hard but crucial part is actually getting to the root cause of a problem so you can take action.
How do you do that? By asking why, and then asking it again.
There’s a good chance you’re familiar with something called the “5 whys” technique. Sakichi Toyoda, the founder of Toyota Motors who’s known in Japan as the "king of Japanese inventors," created it.
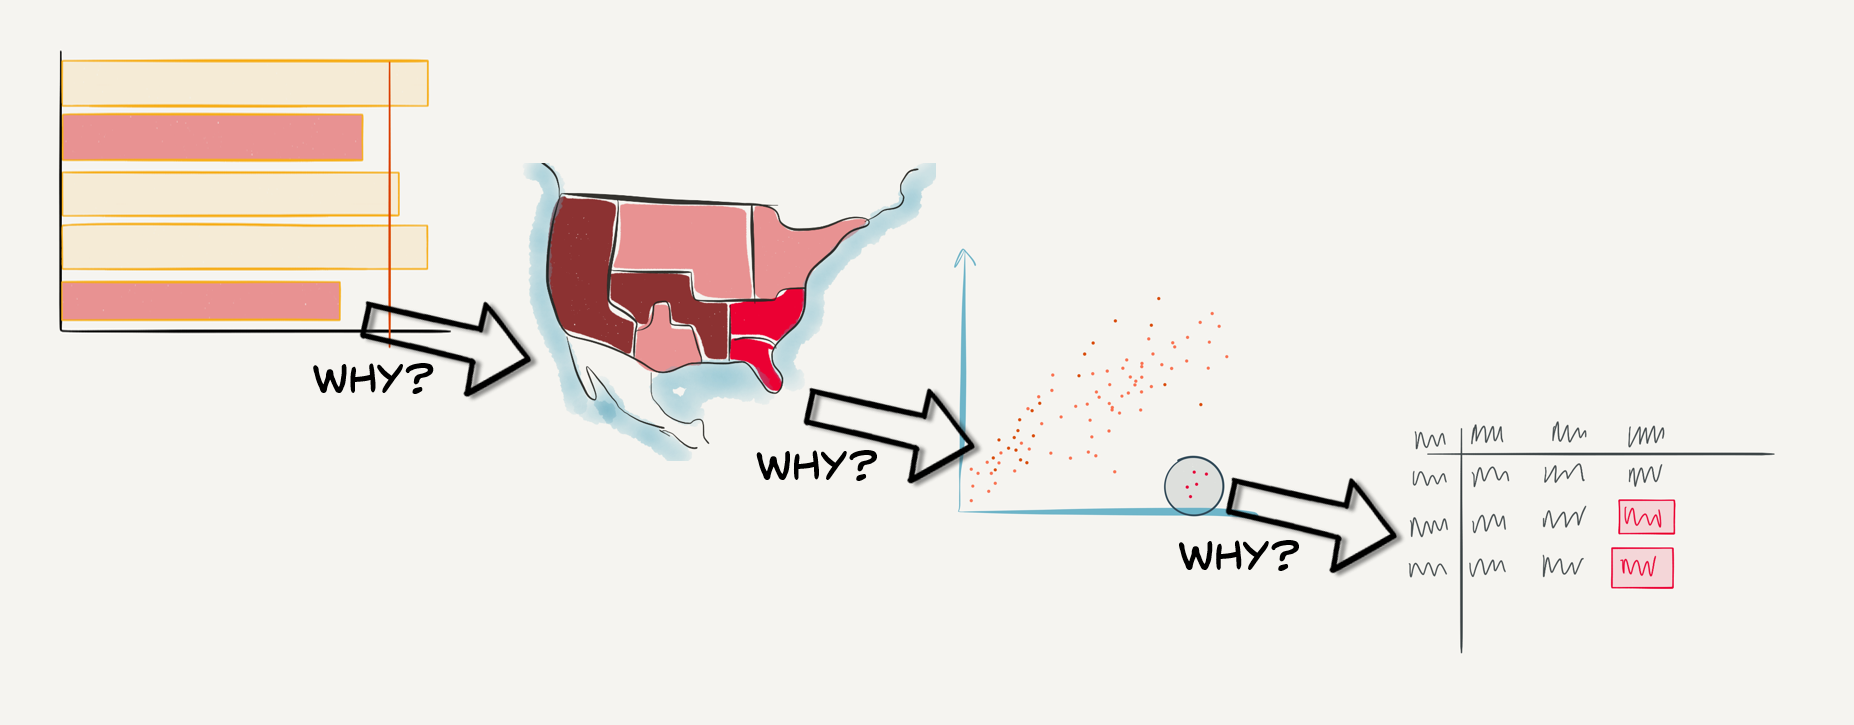
In a nutshell, you ask “why” of a problem that’s been identified, and then continue asking “why” for each answer or explanation given. The primary goal of the technique is to determine the root cause of a defect so you can fix it.
Many businesses don’t enable this, to their detriment. Lots of businesses have dashboards or reports. They’re great at answering the “what” questions but what happens when you need to know more about what the data is showing? To apply the “5 whys” technique, you need to be able explore the data beyond the limits of the dashboard. This way, you can answer the unexpected questions.
Put another way, dashboards should be the start, not the end.
Let’s walk through an example. Pretend you are a big-box retailer and you have a beautiful dashboard showing your sales and profits. As you can see in the figure below, a bar chart answers the question: How are sales and profits in our main categories? It reveals a problem: As you can see, furniture is far from its profit target.
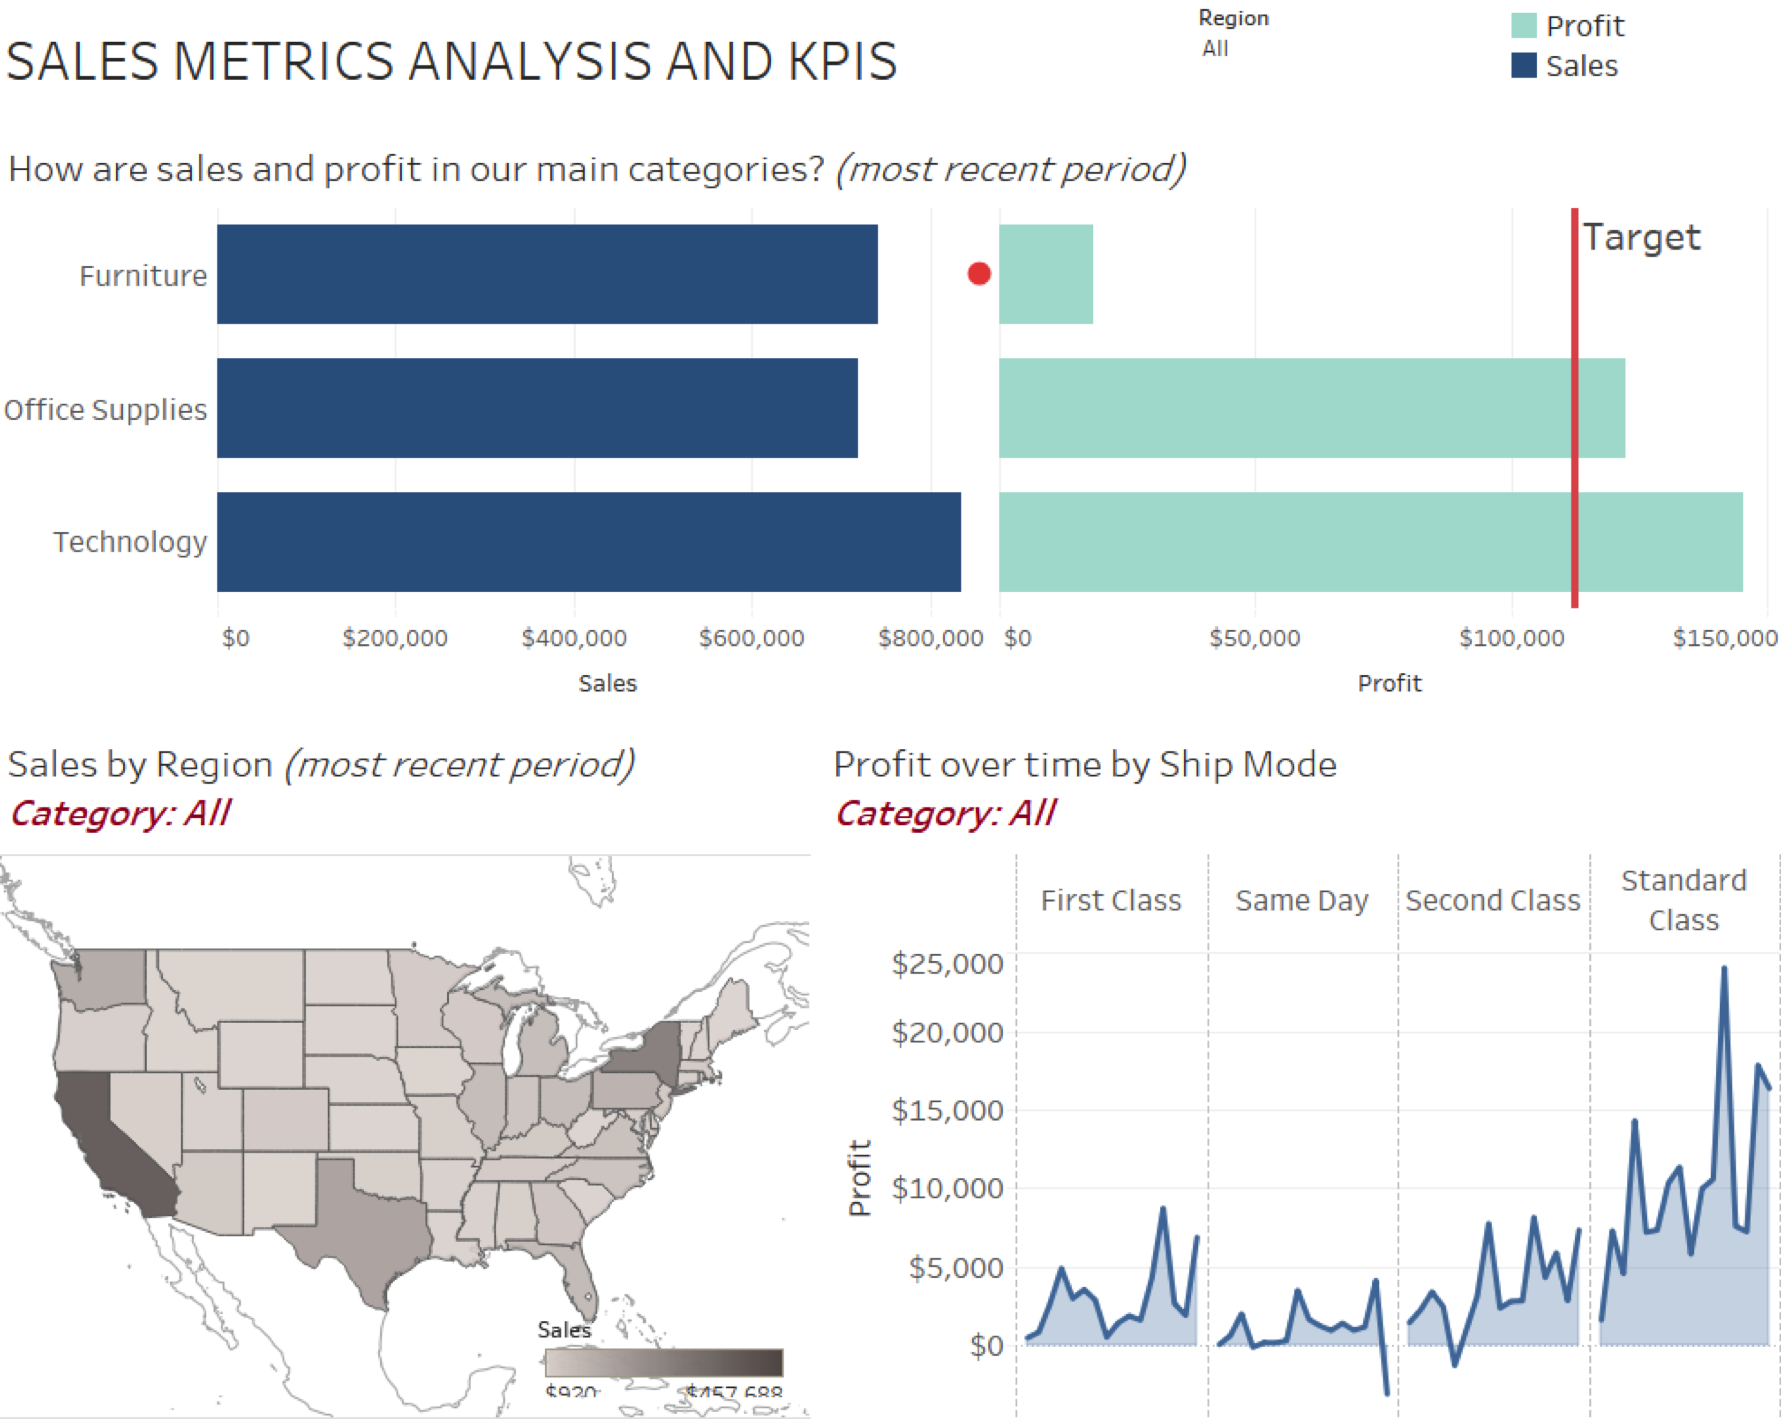
So, what do we do? We ask why.
One thing we can do is filter down to different regions or click on a category to show more detail in the map and line chart at the bottom:
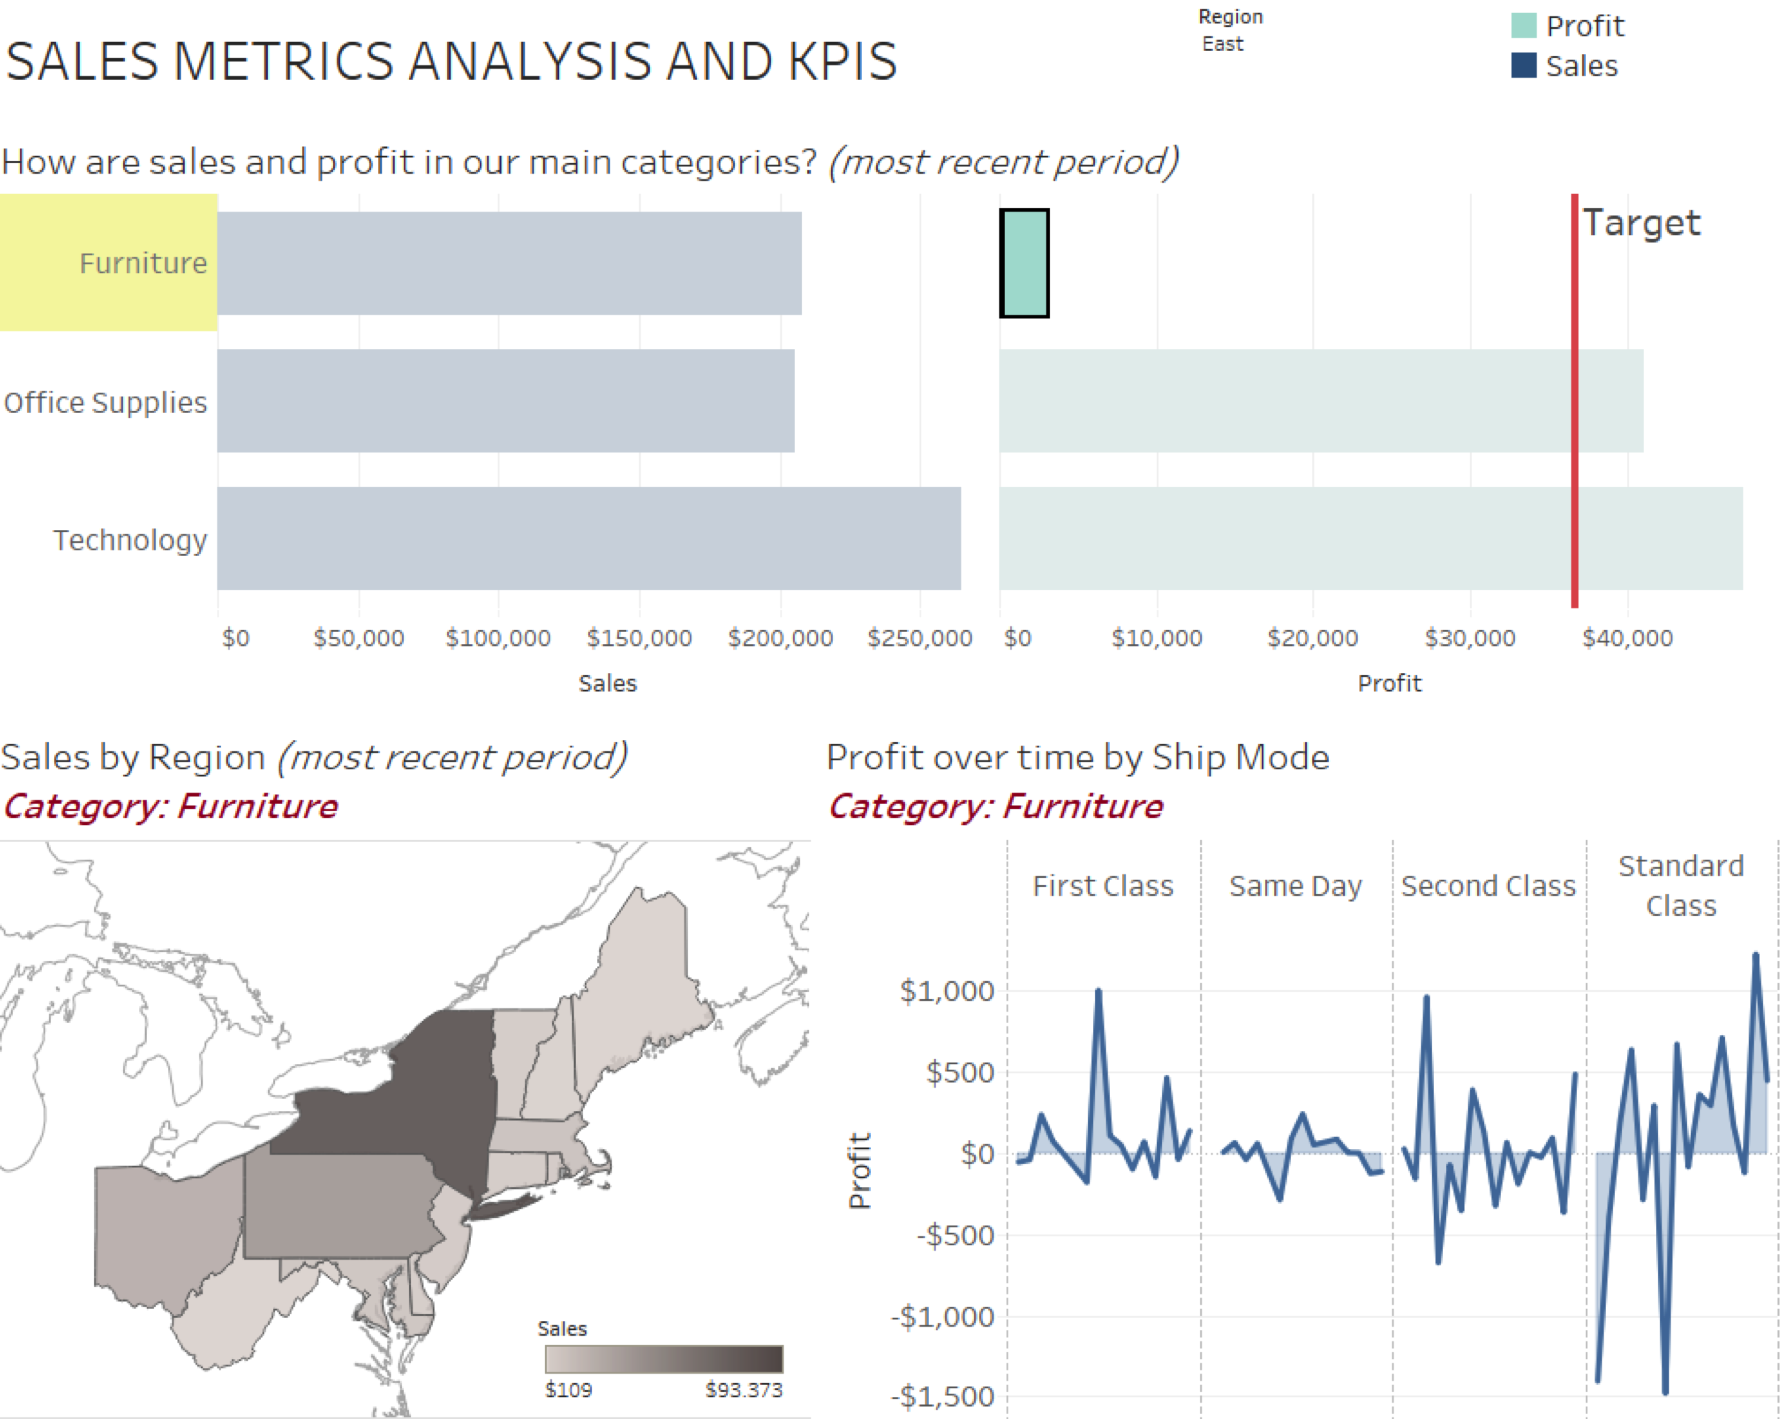
But while this gives us more information, as seen above, it doesn’t really answer the question “Why are furniture profits low?” And that illustrates a key point: Investigating a question may start with drilling down and filtering. But with those steps, all we’re really getting is new views of the same question. We’ll only get to the root cause by playing with the dashboard’s data directly, beyond the limits of filters and interactions.
So let’s manipulate the data into a new format in order to answer our question. For example, we could look at sales and profit of the different types of furniture we sell:
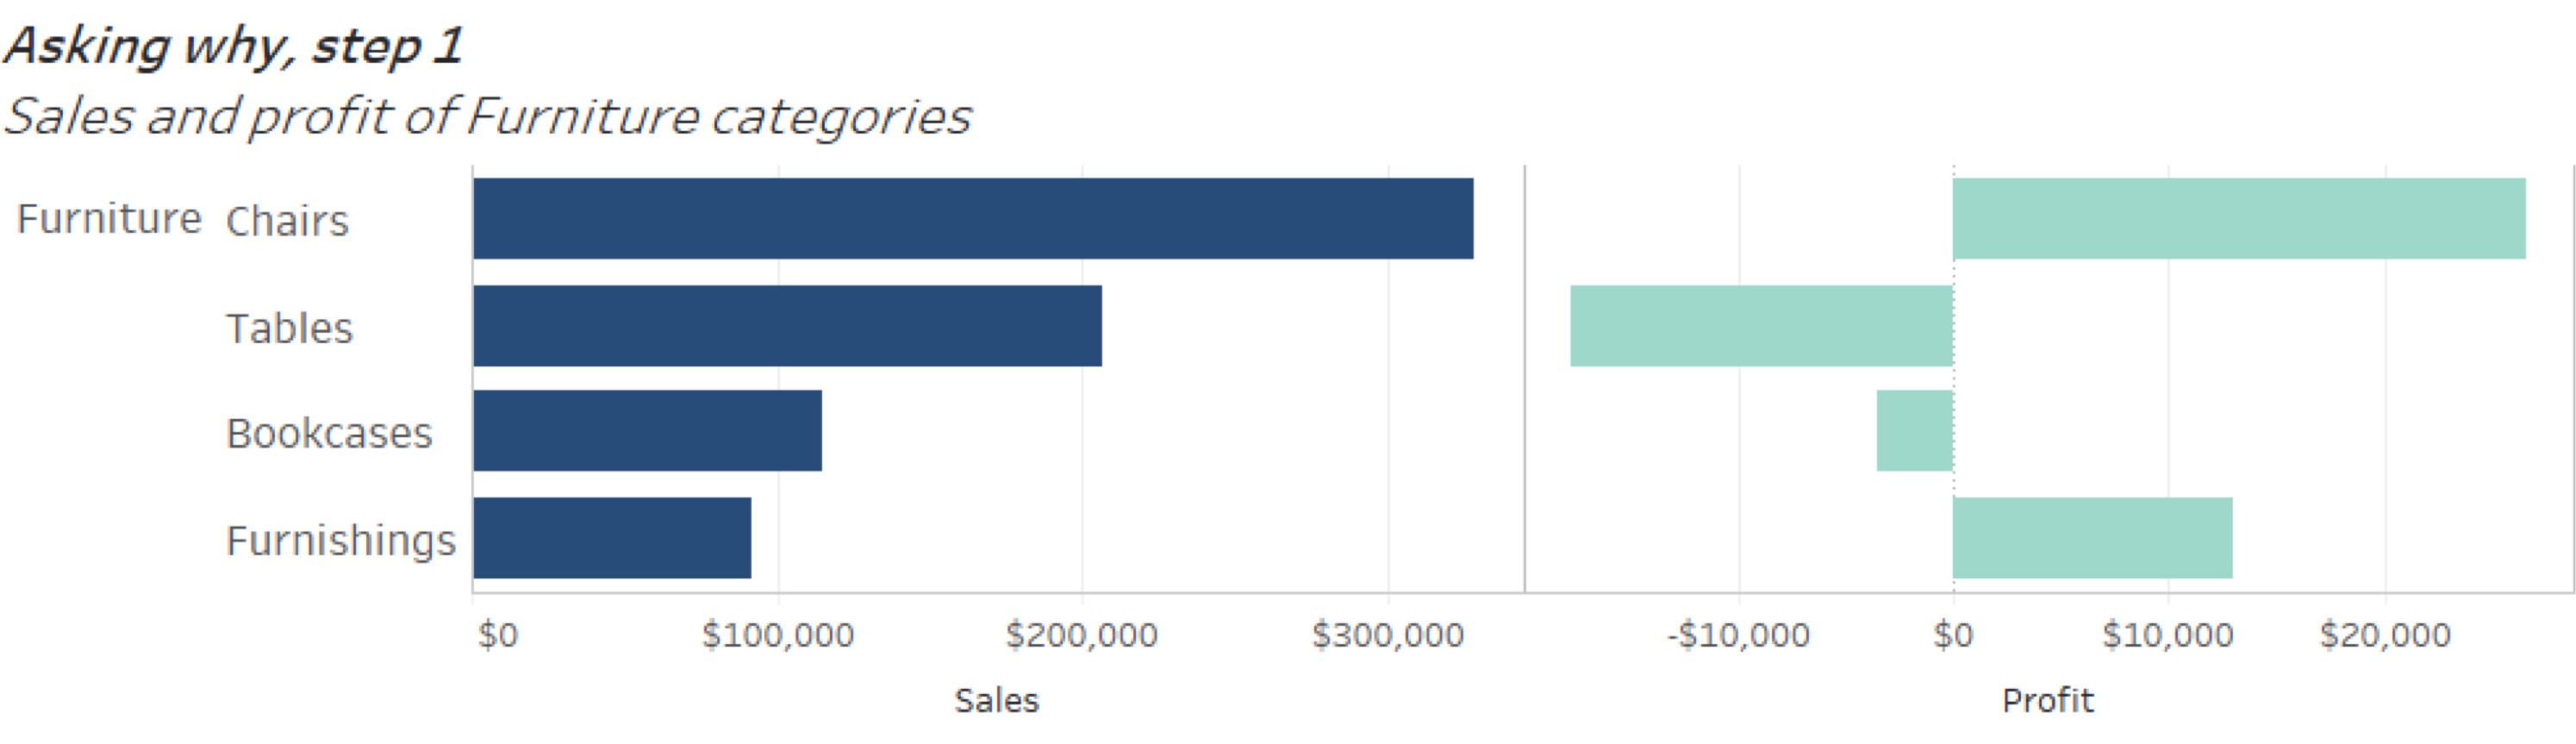
This reveals that tables are actually losing us money. So we ask why again.
Perhaps we investigate sales and profit for table manufacturers:
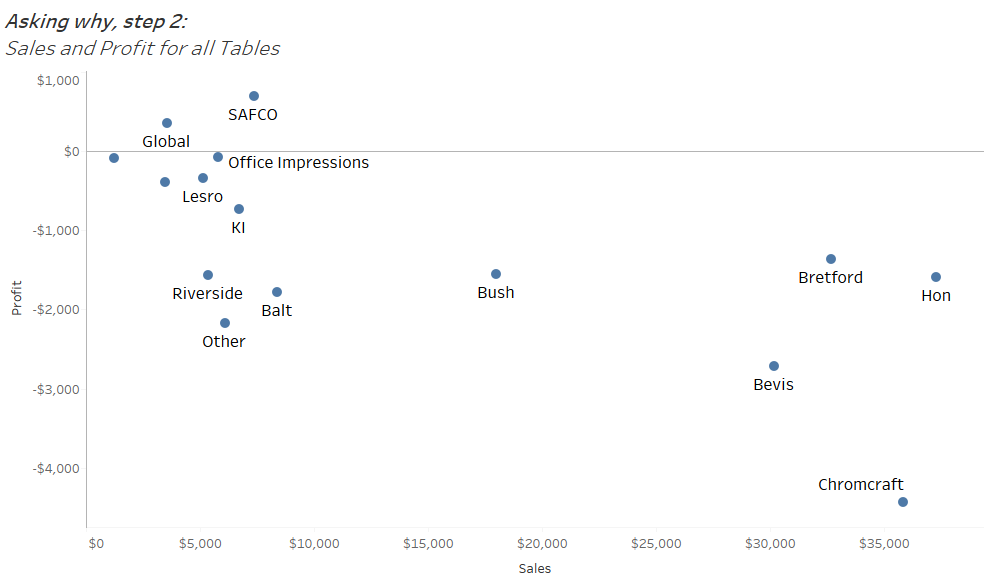
Doing so reveals that only two are profitable. Why are so many manufactures losing us money? Again, we manipulate the data to see if we can find an answer.
Perhaps we break out all our table sales for these manufacturers, and then look at various shipping modes. Nothing jumps out. Then we manipulate it by customer segment. Same story. We must keep looking for the why.
We could try looking at discounts and see that our sales folks are dramatically discounting these tables and completely killing our profit margins.
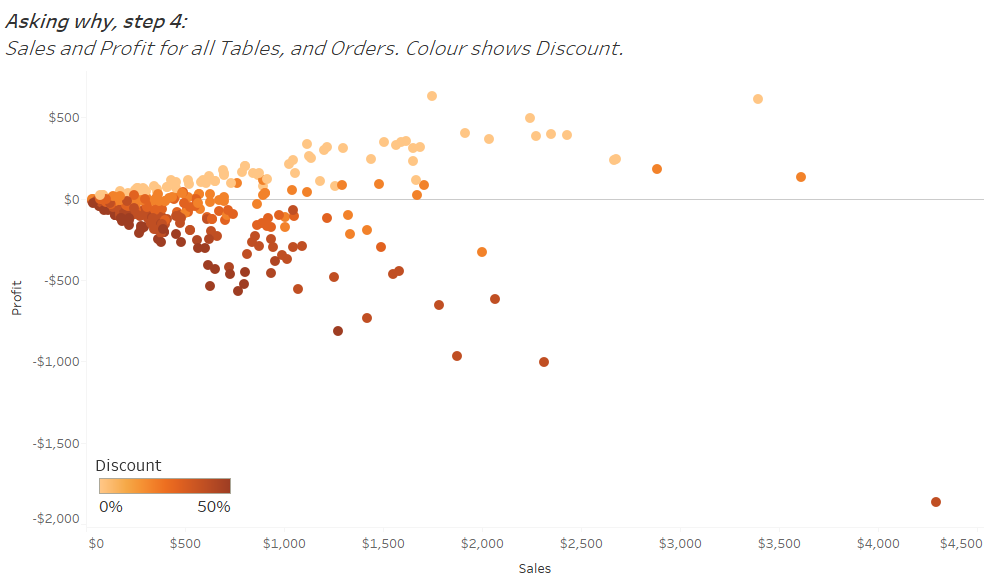
Look at that—when we provide a discount, we make a loss. We’ve gotten to the root cause of the problem. Asking why repeatedly led to an actionable step (addressing our discounting strategy) to help solve the original problem our dashboard highlighted (furniture’s lack of profit).
This technique can really impact the bottom line as seen in this example with unprofitable table sales, or with a real-life example courtesy of Aer Lingus. Jonathan Capper, production planning manager of Aer Lingus, has used this kind of investigative data analysis to better do his job: deliver the lowest cost per seat for Aer Lingus passengers.
The interesting thing, says Jonathan, was that people thought the company was doing well—until they found a huge negative cost. Then came the flood of whys. Visually exploring the data, Jonathan followed the trail of whys, looking at the average per month, the average per day, and so on.
“Within two days, I'd literally reworked the whole instruction, sent it out to people, and off we went. As a result, it’s been a very significant difference in terms of US dollars,” he says.
Such discoveries will only happen when we dig really deep, asking why again and again, and again. In fact, by asking why, that curious little kid could grow up to be a data-analytics hero!
Related Stories

5 Ways to Use Tableau Public to Achieve Your Goals
 January 11, 2025

World Mental Health Day: Elevating Awareness Through Data Visualization
 October 10, 2024

From TV Screens to Tableau: Visualize Your Favorite Shows with IMDb
 August 31, 2024