World Food Programme scales by 12x in 24 months with Tableau Blueprint
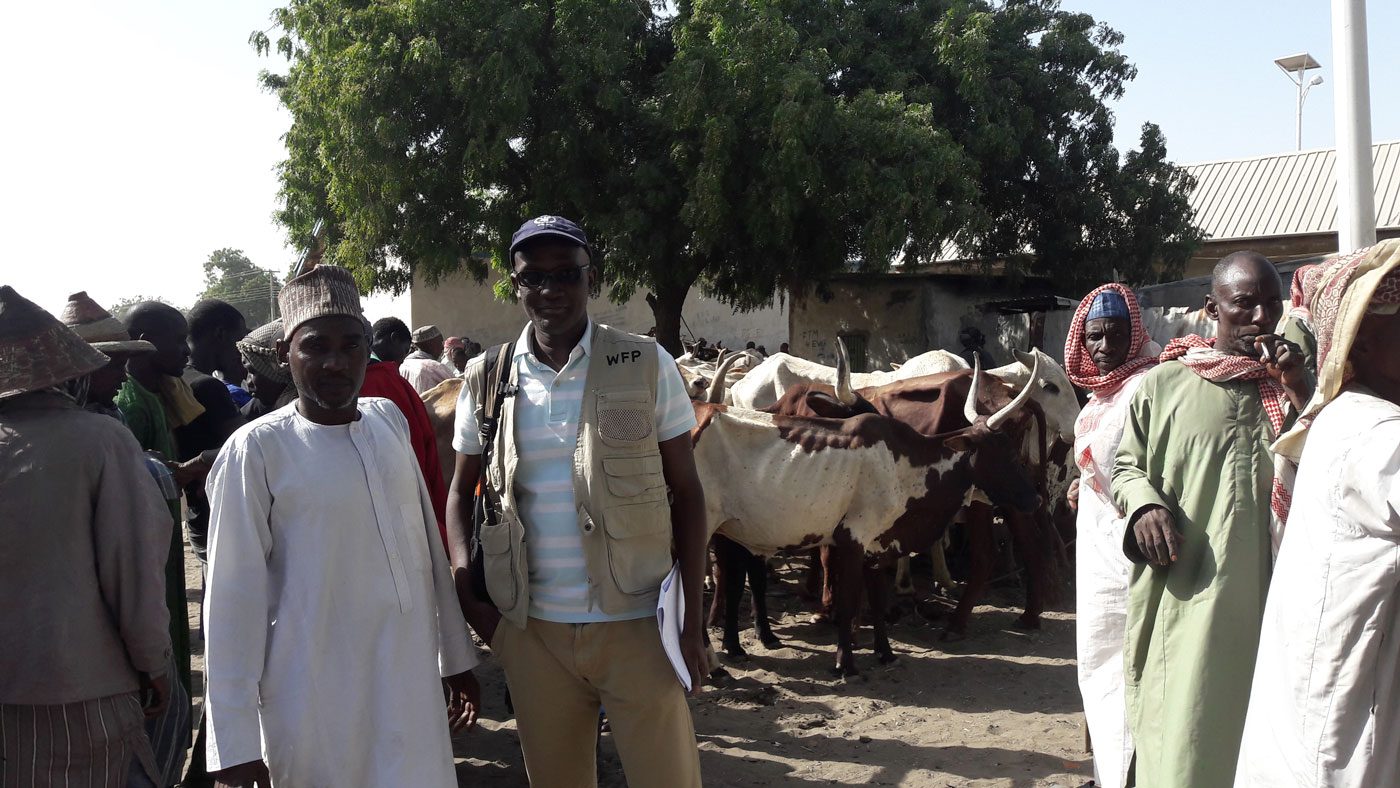
The United Nations World Food Programme (WFP) is a leading humanitarian organization that works with communities to improve nutrition, build resilience, and help deliver food assistance in emergencies. In the last year, WFP provided assistance to 91.4 million people in 83 countries.
WFP started using Tableau thanks to a partnership contribution from the Tableau Foundation, with early use supporting the Vulnerability Analysis and Mapping (VAM) unit— a network of 250 analysts around the world who collect, manage, and analyze data from a variety of sources, working closely with national governments, United Nations partners, and NGOs. With Tableau, analysts can identify food insecure populations to combat hunger. As more people got excited about the partnership and analyzing data, the Tableau community blossomed to over 3,000 users within WFP.
The data team at WFP realized that they needed to set teams up for success with a formal governance strategy to support and encourage future growth. “We had a lot of organic growth and we wanted to bring in some governance. But we didn’t have a very clear outline of the different components of what this structure could look like,” shared Prianka Nandy, World Food Programme’s Chief Data and Analytics Officer.
To broaden, deepen, and scale their use of data, World Food Programme leveraged Tableau Blueprint to guide them through the process of building out capabilities that supported a flourishing, organization-wide Data Culture.
Increasing agility with data strategy and content governance
WFP’s analytics team started with what they call a “server reboot,” focusing on content management within their Tableau Server environment. As a result of rapid growth—about 12 times the size within 24 months—there was an abundance of published dashboards on their Tableau Server, with very little organization, impacting discoverability. This also led to unnecessary work, since people were recreating dashboards and data sources that already served a specific purpose.
“We found that some people were publishing multiple versions of the same data source, so we wanted to consolidate and bring some order to the chaos,” shared Prianka.
The team set out to create a sandbox environment so administrators could monitor server content and end users could have more clarity about what are ready-to-use products. This meant tracking high-profile content that could then be certified for widespread use or flagged for potential deletion if the content was stale.
Tableau Blueprint helped the team bring structure to some of the questions they were getting from employees around data access—for example, “where is the data I need?” or “why can’t I access this data source?” Blueprint’s governance framework helped them identify gaps in their data strategy, particularly around data quality and content management. They now understand the steps they needed to take to ensure data is fresh and trusted, as well as used responsibly across the organization. It also came in a good moment, since WFP is launching a new data strategy this November that will allow the organization to increase the amount of data available for analysis.
“In this moment, we’re making data a more powerful asset within the organization, bringing our data to a new level internally,” shared Prianka. “Previously we thought of each track linearly, but Blueprint changed our perspective—that they need to run in parallel.”
As part of these strategic discussions, they found clarity around roles and responsibilities, particularly around server management and governance. They also found that they needed additional headcount to support their plan and to help advocate for best practices moving forward.
“Blueprint helped us to identify the need for a new headcount to head up governance and help with the robust server configuration change we needed, including training our users and administrators on how to publish and certify data sources. The lack of knowledge on this has been generating a huge number of avoidable tickets and really impacting our daily work,” explained Prianka.
In this moment, we’re making data a more powerful asset within the organization, bringing our data to a new level internally. Previously we thought of each track linearly, but Blueprint changed our perspective—that they need to run in parallel.
Fanning the flame of community engagement
Since WFP started using Tableau in the field with their VAM unit, they already had a solid foundation of community engagement. For example, the team had partnered with Tableau Visionaries to build out a Data Week to encourage learning and sharing data analytics best practices. But previously, this community was largely organic, growing from one-on-one mentor relationships.
With Blueprint, the team saw an opportunity to channel the power of this organic community into a more structured program. To start, they focused on the internal users—understanding who is using the product and who could use more support. This meant establishing a Tableau Champions Group that advocates on behalf of the wider group of users across the organization. Blueprint acted as a starting point for these conversations so the team could establish drivers for each of the necessary community initiatives.
“Blueprint has a community chapter that gives specific examples of activities you can start, as well as how to engage your user base,” said Maria Christina, Head of Data Architecture.
Increasing analytics proficiency with internal training
The World Food Programme analytics team decided to use their solid community foundation to kickstart a training program for employees. Because of their focus on content management, WFP spearheaded trainings on this topic. After just three training sessions, the team already saw increased involvement from users and they’re now planning new sessions to help project leaders and publishers to better understand the role they play on server health. An example of topic planned for these sessions is how to publish a dashboard to Tableau Server—including details around permissions, how to use sandboxes, and how to get a view certified for wider use.
Community engagement activities continue to spark new ideas around training topics. Maria explained how “training is generating engagement and the engagement is generating ideas for the training. So the process has been very circular in a sense. These things grow on each other and help to move our strategy forward.”
Blueprint helped us identify the need for a new headcount to head up governance and help with the robust server configuration change we needed, including training our users and administrators on how to publish and certify data sources.
Planning for the future
As the team plans for the future, they want to use Blueprint as a guide for strategy and headcount decisions and to keep everyone on the same page as they kick-start conversations about additional technology investments.
“I have a feeling that we’re going to keep on iterating in the cycle of growth. We are going to see each branch in the Blueprint subway map develop on its own. At the same time, we are making sure that we adjust to ensure that we don’t lose sight of the bigger picture,” shared Maria.
The next step in their journey is to assess all of the disparate data sources within WFP to break down silos and prioritize data quality. There is also more work to be done around governance at the data source level, while balancing the need for self-service business intelligence.