Honoring Black History Month with the Tableau Community


The Tableau Community has put together some ways we’re celebrating Black History Month. Join us!
Participate in a Community challenge
Community challenges are created by and for the DataFam as an opportunity to learn, practice, and apply your data skills across a variety of topics, products, and causes.
Du Bois Challenge (Feb 7 - Apr 18)
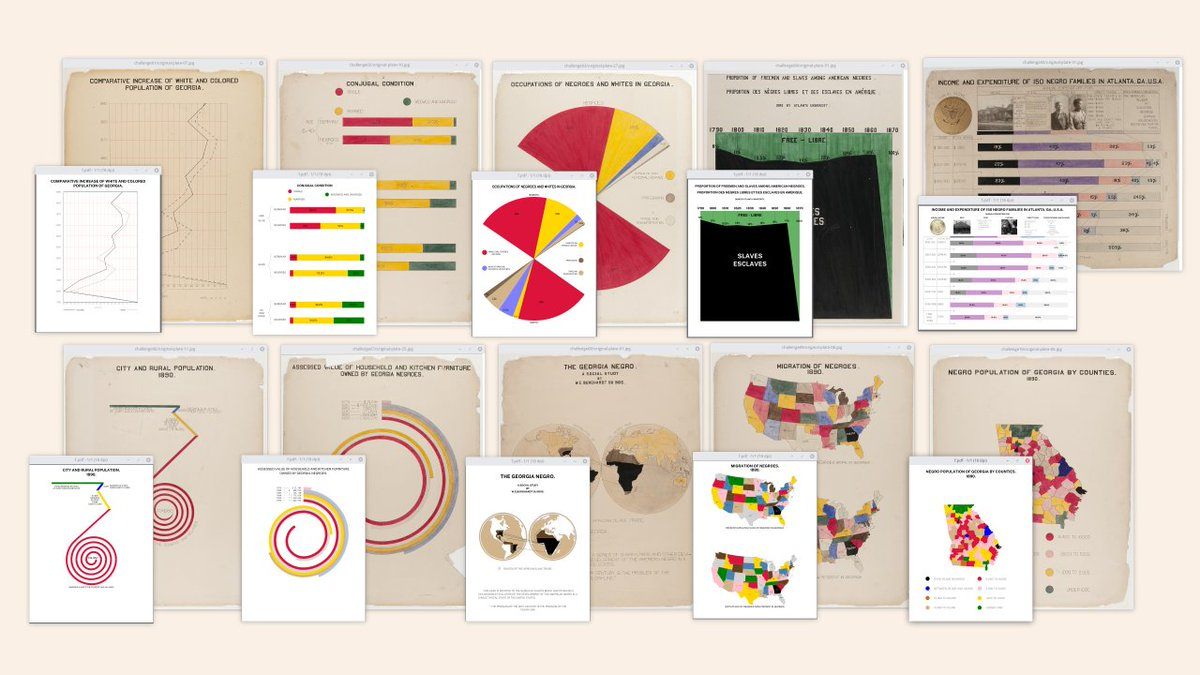 2021 DuBois Challenge catalog, with re-creations
The Du Bois challenge celebrates W.E.B Du Bois’ data visualization legacy by recreating his visualizations showcased at the 1900 Paris Exposition using modern tools. This challenge is co-led by two members of the Tableau Community Equity Taskforce, Allen Hillery and Sekou Tyler, alongside Anthony Starks, developer and designer who has dedicated much of his time and work to recreating Du Bois’ visualizations. The Du Bois Challenge will run for ten weeks (starting February 7), each week focusing on one of Du Bois' visualizations. Learn more behind the challenge and what to expect here—and follow along using #DuBoisChallenge2022 on Twitter and LinkedIn.
Tuskegee Airmen Challenge (Feb 7 - Feb 28)

Tuskegee Airmen, ca. 1943
The Tuskegee Airmen challenge showcases data visualizations using data sets around the Tuskegee Airmen, a group of primarily African American military pilots and airmen who fought in World War II. Learn more about the Tuskegee Airmen story, challenge and data set here—and follow along using #TuskegeeAirmenChallenge on Twitter and LinkedIn.
Upcoming Data+Diversity Events
The Data+Diversity series provides a platform for community conversations surrounding the challenges and solutions to diversity in data. This includes, but definitely is not limited to, conversations about diversity, equity, inclusion, and actions we can take to create positive change.
Recreating the Visualizations of W.E.B. Du Bois on Feb. 23
Hosted by members of the Tableau Community Equity Taskforce, this virtual event will celebrate the life and visualizations of Black American civil rights activist, sociologist and writer W.E.B. Du Bois. Get a behind-the-scenes look at DuBois' visualizations and learn how you can modernize them with current data. Plus, we’ll be spotlighting some of the visualizations that the DataFam submitted for the #DuBoisChallenge2022. Register for the virtual event here.
“Rising Stars in Data” on Feb. 24
Hosted by the Blacks in Analytics User Group, this virtual event will be a conversation about career journeys in data, featuring a panel of four speakers who will:
- Share their journey and challenges to landing a career in data
- Discuss how they are staying up to date on data trends
- Give their best advice for others looking at a career in data
Register for the virtual event here.
Celebrating the Tuskegee Airmen Challenge on Feb. 28
Join the Veterans Advocacy Tableau User Group as they explore the legacy and lessons of the Tuskegee Airmen—and the visualizations created by the DataFam that tell their story best. Register for the virtual event here.
Explore visualizations made by the Tableau Community
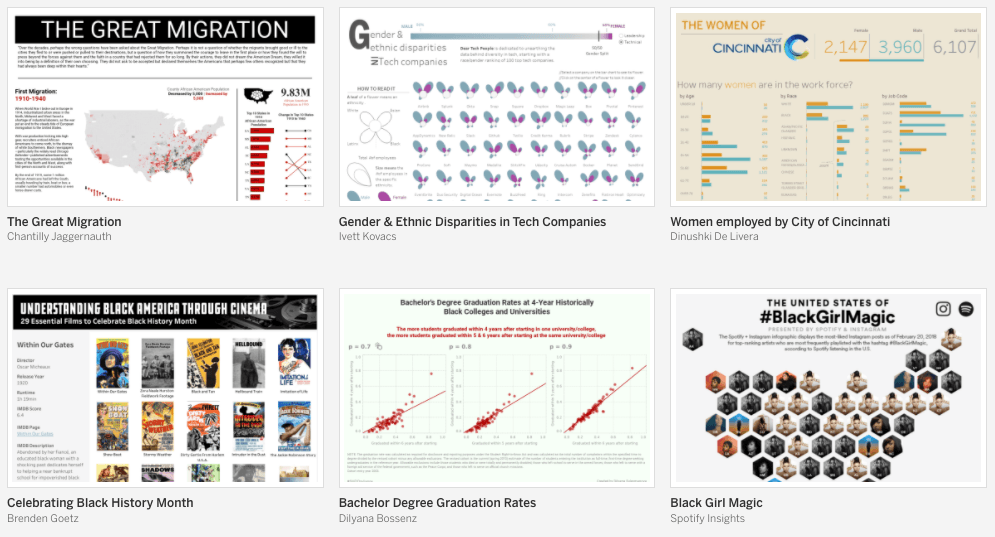 Community Equity Taskforce Viz Gallery
Viz of the Day on Tableau Public
Each week, we'll be featuring a viz celebrating Black History Month, check them out on our Viz of the Day gallery. Not subscribed yet? Subscribe here and remember that you can also always nominate a viz to be featured.
Explore visualizations celebrating Black History Month
Launched in February 2021 by the Tableau Community Equity Task Force, the Community Equity Task Force Gallery showcases the work of the Tableau Community and its commitment to diversity, inclusion, and equity. The CETF will be adding new vizzes to this gallery throughout the month. Be sure to check back and favorite the visualizations that inspire you!
Related Stories

Using an Equality Lens in Data Visualization
 February 22, 2023
Meet the Tableau Community Equity Task Force
 May 7, 2022
Apply to join the next class of our Community Equity Task Force
January 6, 2022