Now Available: Tableau Public 9.3


Rest on our laurels? No way! Tableau Public 9.3, the latest and greatest version of our award-winning data visualization software platform, is now available to download for free on Mac or Windows!
So What Did We Improve?
Many of the great new features of Tableau Desktop 9.3, our authoring platform for anyone working with proprietary data, have also been baked into the free version. We'd like to highlight a few of the new features that we think you'll be most excited about.
1. Even Better Maps
Tableau Public is used by journalists, bloggers, governments, universities, and data wonks all over the world. In fact, a full two-thirds of all views of embedded Tableau Public visualizations come from outside the United States and Canada. And many of those visualizations contain maps. Around half of the 2016 Viz of the Day winners thus far contain at least one map.
That's why we've been investing in Tableau maps to make them even better for authors and readers everywhere. That's why we now have native postal code locations and shapes for 47 different countries—no GIS software or custom shapefiles required:
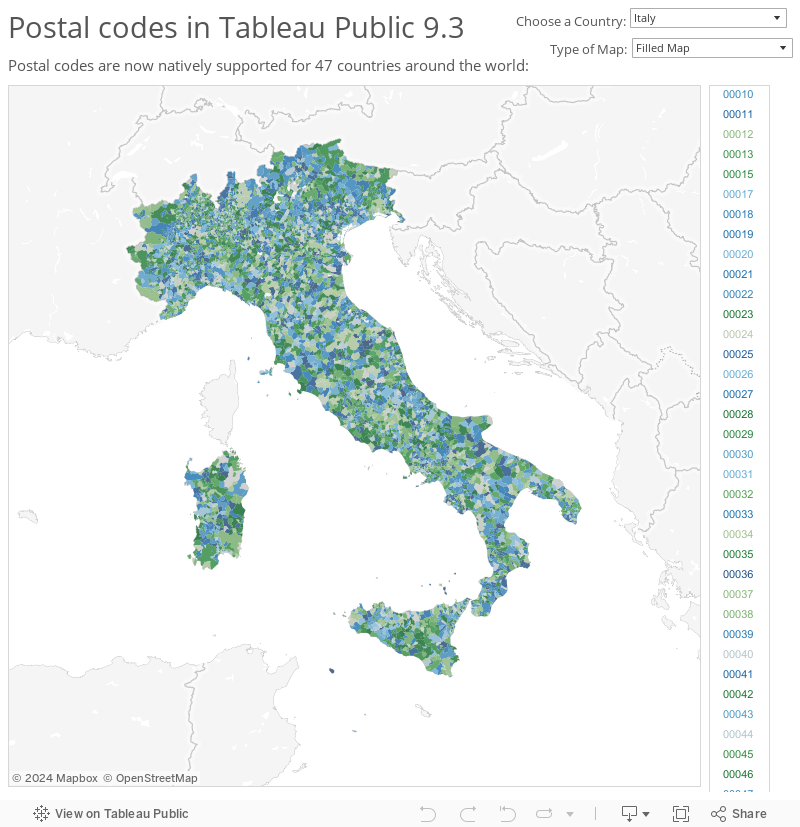
We've added districts in India and updated US demographic data layers for 2016—just in time for the US elections. We've also updated postal codes for UK, France, Germany, and the US. Tableau maps just keep getting better!
2. Unions
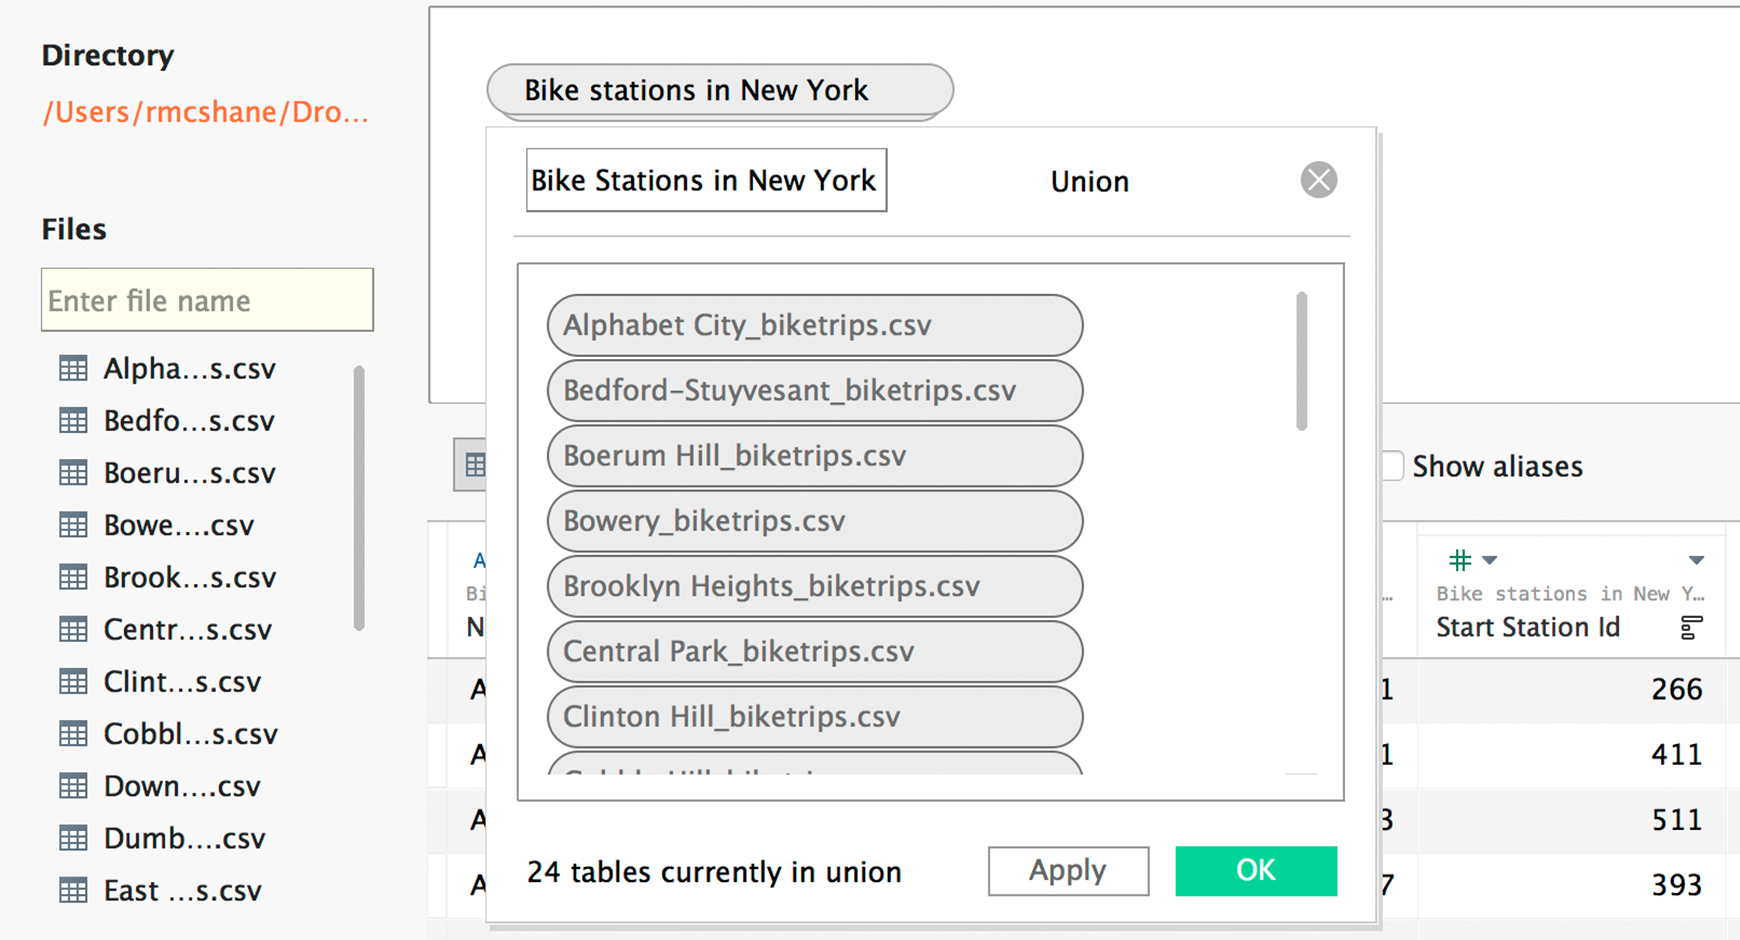
It's so common in the world of open data to see governments and organizations post files in separate batches, such as India district forestation by state, or UK land registry transactions by month. Each of the individual files in these collections is fine on its own, but what we'd really like to do is analyze all the files in a particular set together. So instead of just looking at forestation in the Punjab state, we'd like to consider the situation for all 29 states and seven union territories in India. And instead of only looking at the land-registry transaction data for January, we'd like to analyze trends for all twelve months in the year. Combining all of these files together into a single file can be time-consuming and error-prone.
That's why we've added the ability to combine your data with Union in Tableau Public 9.3:
3. Other New Features
In addition to better maps and the ability to union data sets directly in Tableau, we've added a bunch of other delightful features. You can now join based on pivoted data fields, and organize sheet tabs in a workbook by giving them their own color. You can also exclude total columns or rows from color encoding. We understand that these small changes can make a big difference in some cases, and we hope you find them to be helpful, too.
How Do I Get Started?
Downloading and installing Tableau Public takes just minutes. The next step is creating a free account on the Tableau Public server, which will let you publish your visualizations to the web and embed them on your own site.
If this is your first time downloading Tableau Public, be sure to check out our resources page where you'll find useful how-to videos, a schedule of live webinars, and sample data sets to help you take your new high-performance product for a test drive.
And whether you're a first-time author or a seasoned expert, be sure to tweet us the visualizations you create to @tableaupublic. We'll be on the lookout for great examples built using Tableau Public 9.3 to choose as Viz of the Day in the coming weeks.
Related Stories

Iron Viz 2025: Where Data Took Flight
 May 6, 2025

Meet 2025 Iron Viz Finalist Bo McCready
April 8, 2025

Meet 2025 Iron Viz Finalist Kathryn McCrindle
April 6, 2025