Aging, Immigration, and Retirement: Understanding Demographic Changes with Tableau Public


This is a guest post by Prof. Dr. Ralf E. Ulrich, Professor at Bielefeld University.
Klicken Sie hier für die deutsche Version des Textes.
When the new term starts at many universities this fall, the students of the Public Health program at Bielefeld University will have an additional learning resource at their disposal: the Demographic DataLab. A companion to lectures and textbooks, this online portal will let students interact with data and models, and will let them apply and test their newly-acquired knowledge. At the same time, the DataLab will make the learning of facts-to-know more interesting and more engaging. Also, it is hoped that it will get students interested in new data analysis tools.
Over the last four years, Students of the MSc program in Public Health have already been exposed to the software Tableau through the course “Data Analytics and Visualization for Public Health and Business with Tableau “. The Tableau for Teaching and Tableau for Students programs have provided them with free licenses. In addition, selected coursework presentations of the summer 2015 batch have been published on the “Bielefeld Health” profile on Tableau Public.
To kick off the Demographic DataLab, we would like to present here a first interactive data visualizatiion on the topic of demographic aging. This and all further vizzes of the Demographic DataLab will be made available free-of-charge through on Tableau Public in English.
Most European countries are looking to a future shaped by demographic aging, and Germany is one of the countries already experiencing the effects. The lack of skilled workers already bemoaned by businesses will be further compounded by the significant reduction in size of the working population that can be expected in the not-too distant future. At the same time, we will see how the social security system that operates under a pay-as-you-go scheme, will come under pressure through the demographics shift that is expected over the coming decades.
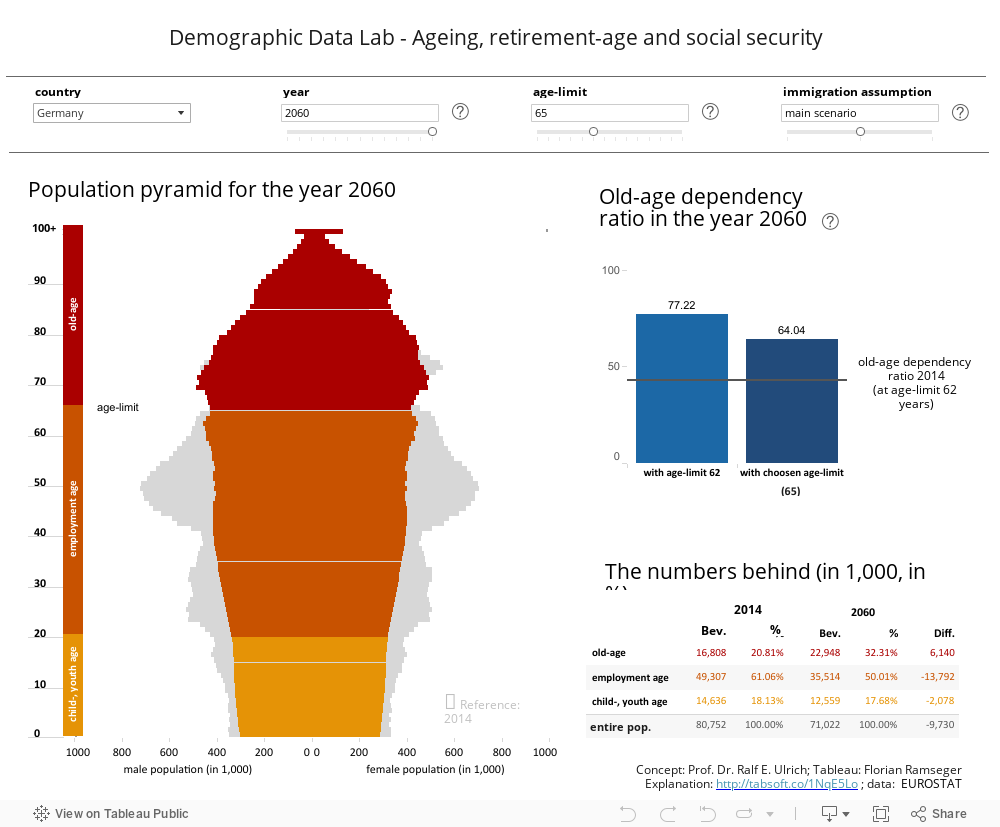
This can be seen by examining the so-called old-age dependency ratio – the number of people of retirement age per 100 people of working age. In the year 2014 in Germany, this stood at 50 people of age 60 or older per every 100 people of age 20-59. According to the most recent forecast by the Federal Statistical Agency (from April 2015) this old-age dependency ratio will go up to 89 by the year 2060. This new ratio will, among other things, have huge implications on the revenues and expenses of the pension and health insurance systems in EU member states. In 45 years the ratio of those who pay into the system to those who draw on the system will change in Germany from 2:1 to almost 1:1.
In the interactive viz above, you can explore these demographic processes yourself. After choosing a country you can move the year slider, and see the historical and predicted age structure of the country for different years in the population pyramid chart. Each horizontal bar of that chart shows the population numbers for the respective age groups, with the male population on the left and the female population on the right-hand side. If you compare the population pyramid for 2060 with that for 2014 you can see how it will slim down in the middle and become wider at the top.
The old-age dependency ratio is shown in the blue bar chart and can be calculated for various retirement ages (60, 62, 67 etc.). The retirement age should reflect the average age at which people start their retirement. In the year 2000, this was at an age of 59.8 years in Germany, whereas in 2014 it was at approximately 61.8 years. It is to be expected that this number will further increase given the increase to 67 years of the statutory pensionable age.
With the two sliders you can test the effects on the old-age-dependency ratio of various combinations of retirement ages and immigration scenarios. You will see quickly that an increase of immigration will only have a small ameliorating effect on the future old-age dependency ratio.
On the other hand, increasing the retirement age by four or five years has already quite significant results, as can be seen by the shorter bar. In the population pyramid we can also see how the increase in the retirement age changes both sides of the relation. Through this it also becomes obvious why the German federal government has put a focus on prolonging the working age to cope with the demographic changes in the country.
Data source: The Tableau Public visualization is based on population projections by EUROSTAT (EUROPOP2013).
Related Stories

Meet Iron Viz 2024 Finalist Jessica Moon
 April 15, 2024

Meet Iron Viz 2024 Finalist Pata Gogová
April 8, 2024

Student to BI Analyst, How Tableau Can Lead to a Successful Data Career
 March 20, 2024
Subscribe to our blog
Get the latest Tableau updates in your inbox.