Visual Autocompletion for Spatial Queries


It has been estimated that ~80% or greater of business datasets contain a spatial component. While the origin of this estimate is a bit of an urban legend in geography, there is undoubtedly a lot of data available, and great analytical potential in making the location-based details in this data easier to explore. Natural language (NL) systems are designed to allow people to more easily ask questions about this data using plain language, but, unfortunately, location doesn’t always lend itself to nice, simple NL descriptions. In our recent short paper at the IEEE VIS 2021 conference, we introduce GeoSneakPique, a system designed to help people use location more easily in their NL queries.
Questions like “how many customers are in California” are easy. California is a well recognized location with an absolute location that can be mapped and compared to a user’s dataset. But, what if you wanted to know “how many customers are in the downtown area?” Well, what is the exact boundary of “downtown?” Is it the same boundary of how I think about “downtown?” Or, even more challenging, what if your question about your dataset was really about wanting to understand more about a particular cluster of data points that don’t align with any named boundary? Could you easily, and succinctly describe this location in a NL system? I don’t think most systems would respond well to a query like this: “how many earthquakes in that little blob that is mostly in Oklahoma, but kinda also a bit into Texas, and a little bit of Kansas too.”
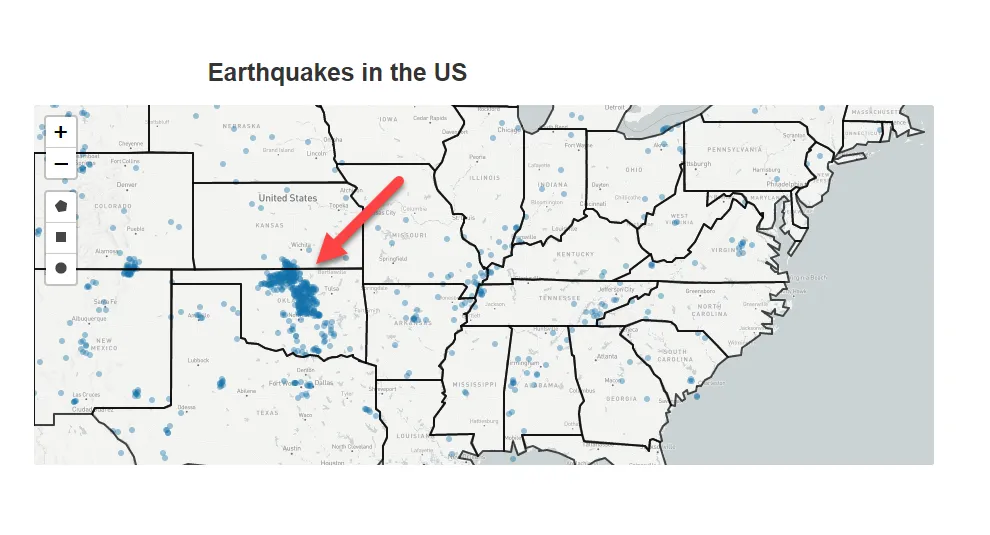
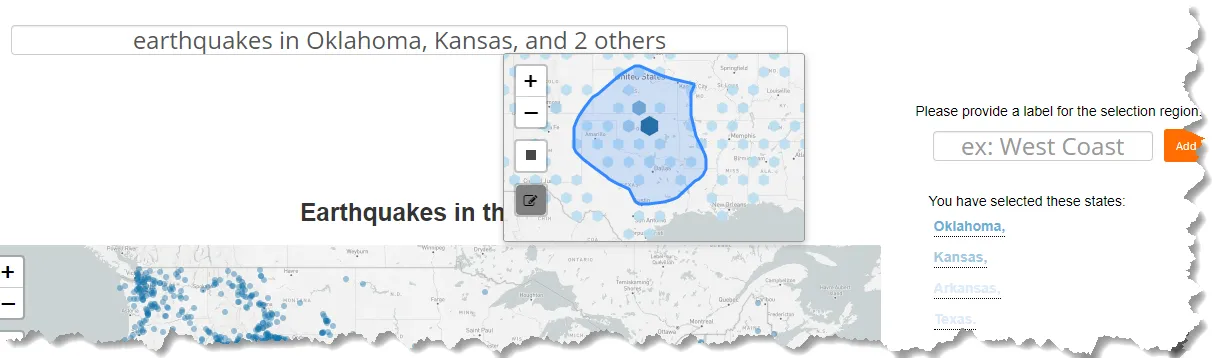
With our work on GeoSneakPique: Visual Autocompletion for Spatial Queries, we (Vidya Setlur, Sarah Battersby, and Tracy Wong) set out to make it easier for people to ask and answer this type of question about their spatial data. In the GeoSneakPique system, a spatial component to a query triggers a map widget that allows you to complete the geographic location definition using a quick sketch. So, if we were interested in a particular cluster of data, we could simply write a query and draw a quick sketch all at the same time. For example, you can start typing in a question and when the words in your question start suggesting a location, boom…a map shows up and you can just draw the location instead of trying to come up with the right words.
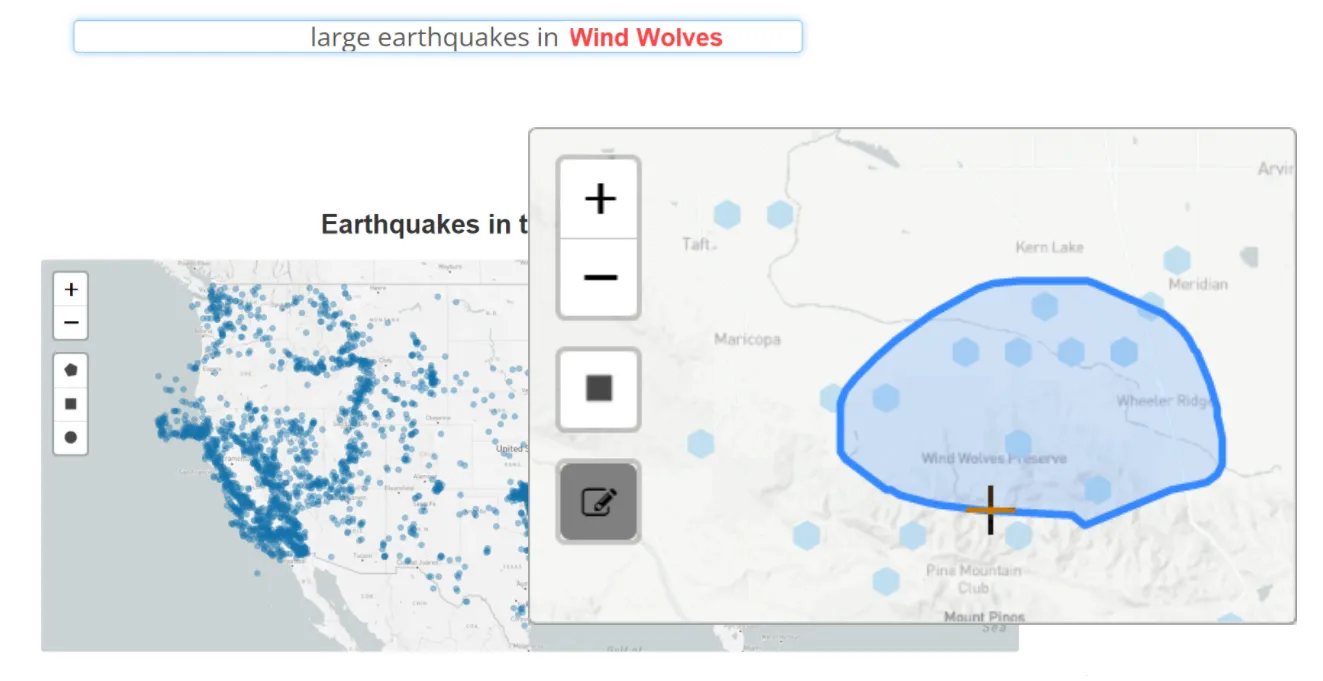
Being able to specify regions that have fuzzy or arbitrary boundaries is nice, but there are other great reasons to sketch your location instead of trying to express it in words. What if you don’t know how to spell Ouagadougou? Sometimes misspelled words cannot be resolved to the right location , so you can just pan and zoom on the map and select the location that you want. Or you want to know about a popular area nearby, like the Wind Wolves Preserve in Southern California…but that level of detail just isn’t included in the built-in geocoding database. In GeoSneakPique, you can zoom in, find your target location, and just draw the location that you want.
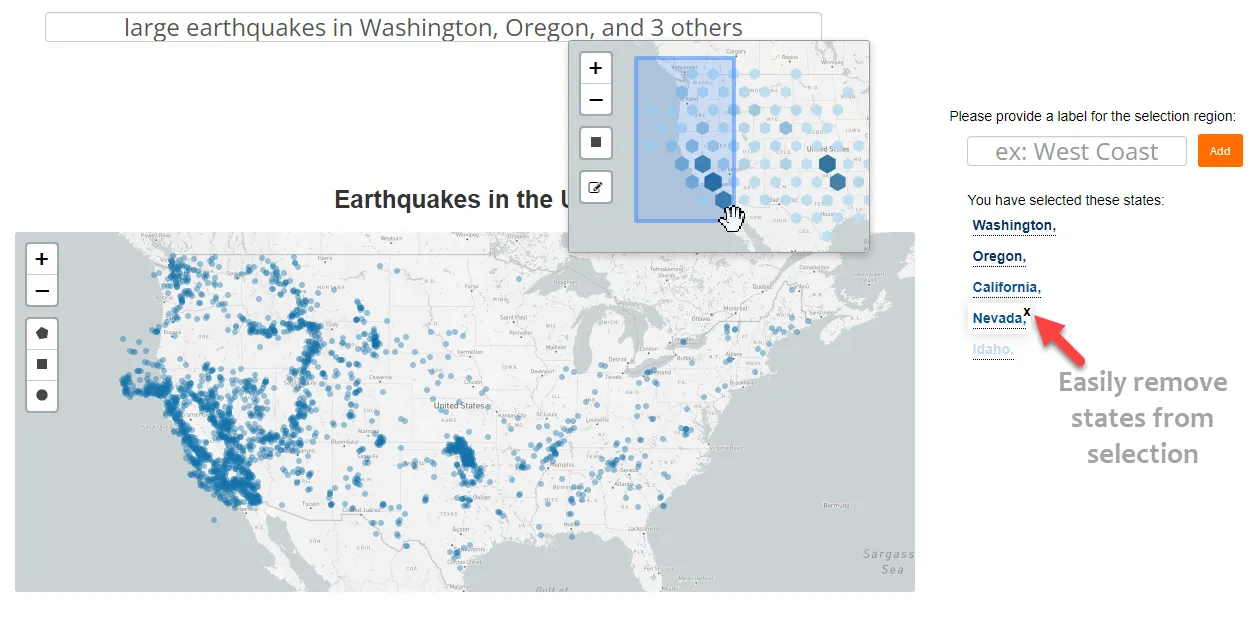
Since we know that it’s hard to do pixel perfect selections to define locations of interest, the GeoSneakPique system provides feedback in terms of what we call “coverage.” Our coverage metric is a way to connect user-drawn location with arbitrary boundaries to well-known administrative geographies (e.g., states) and to the distribution of the data. For example, there may be no data points in some of the locations selected, or it may be a particularly interesting location where a large portion of the data for that state is clustered inside the selection.
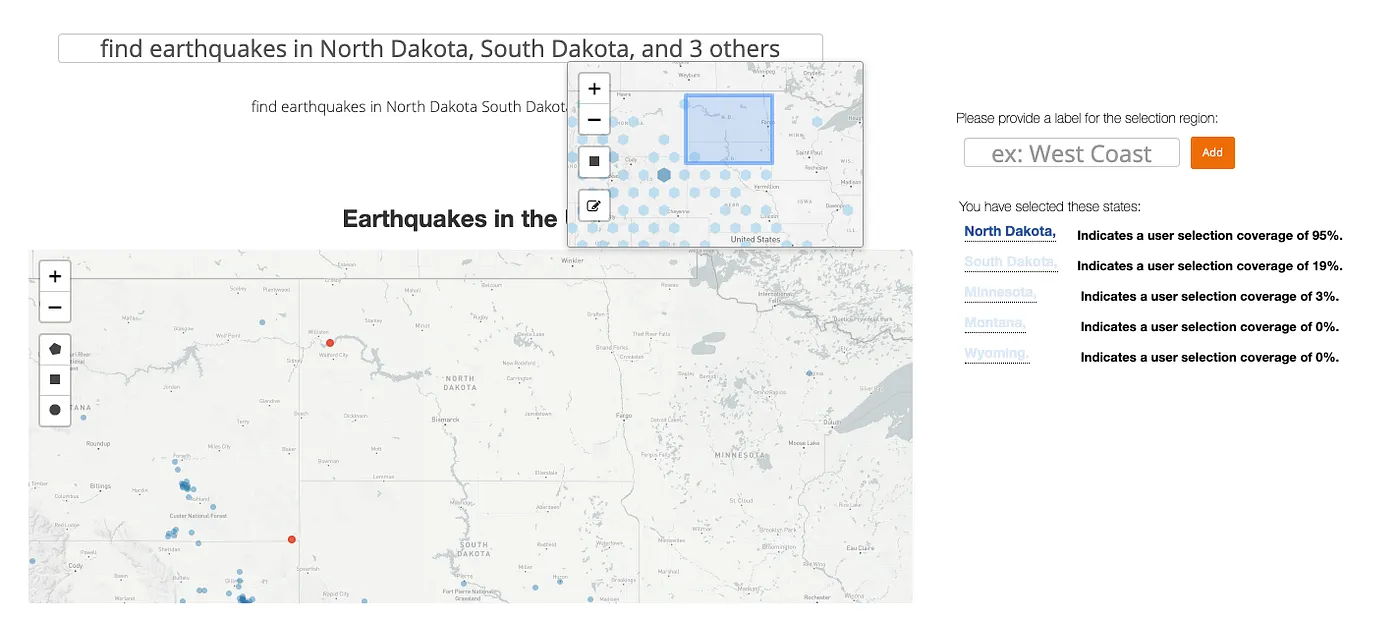
We want to help people understand what is in their selection…and then to allow them to refine based on this information. So if you want to select the “West Coast” using a big rectangular selection polygon…but then want to cut Nevada and Idaho out from the selection rectangle you can easily do that!
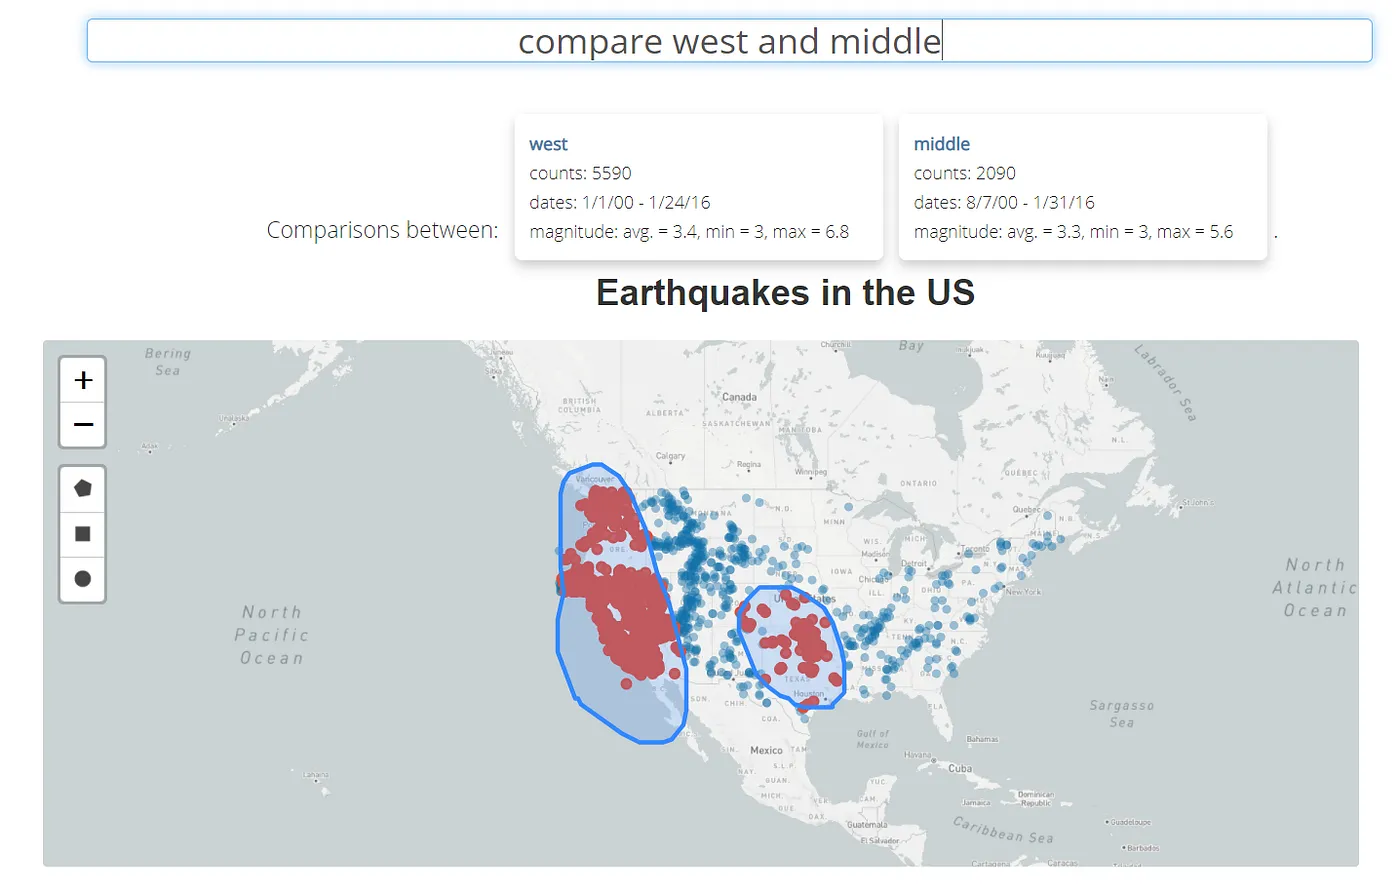
As added bonuses to help with data exploration and analysis, the GeoSneakPique system allows users to name and re-use locations . This allows you to define ‘downtown’ once and then reuse it by name in follow-up queries so that the ‘downtown’ boundary is always exactly the same. With these named regions, you can also quickly compare locations of interest. For instance, if you wanted to compare the earthquakes in two regions named “west” and “middle” you can just ask for these details!
If you’re interested in learning more about GeoSneakPique, check out our short paper from the IEEE VIS 2021 conference. It’s available on the Tableau Research web site. For even more detail, you can find out more about autocompletion widgets in general in a paper from last year on Sneak Pique: Exploring Autocompletion as a Data Discovery Scaffold for Supporting Visual Analysis by Vidya Setlur, Enamul Hoque, and Dae Hyun Kim.
Related Stories

Which Model Speaks Your Data Language? A User-Centered Approach to Evaluating LLMs for Conversational Visual Analytics
 April 14, 2026
Rethinking How Data Workers Revisit Analytical Conversations and Communicate Insights
 April 10, 2026
Stepping through Charted Territory: Creating Interactive Step-by-Step Dashboards Tours
 June 8, 2025