Inside the release: Tableau 2022.1 for analysts and business users


Tableau 2022.1 introduces a wide range of capabilities designed to improve every stage of data analysis—from data preparation to dashboard consumption. Let’s take a closer look at what’s included for analysts and business users.
Performance
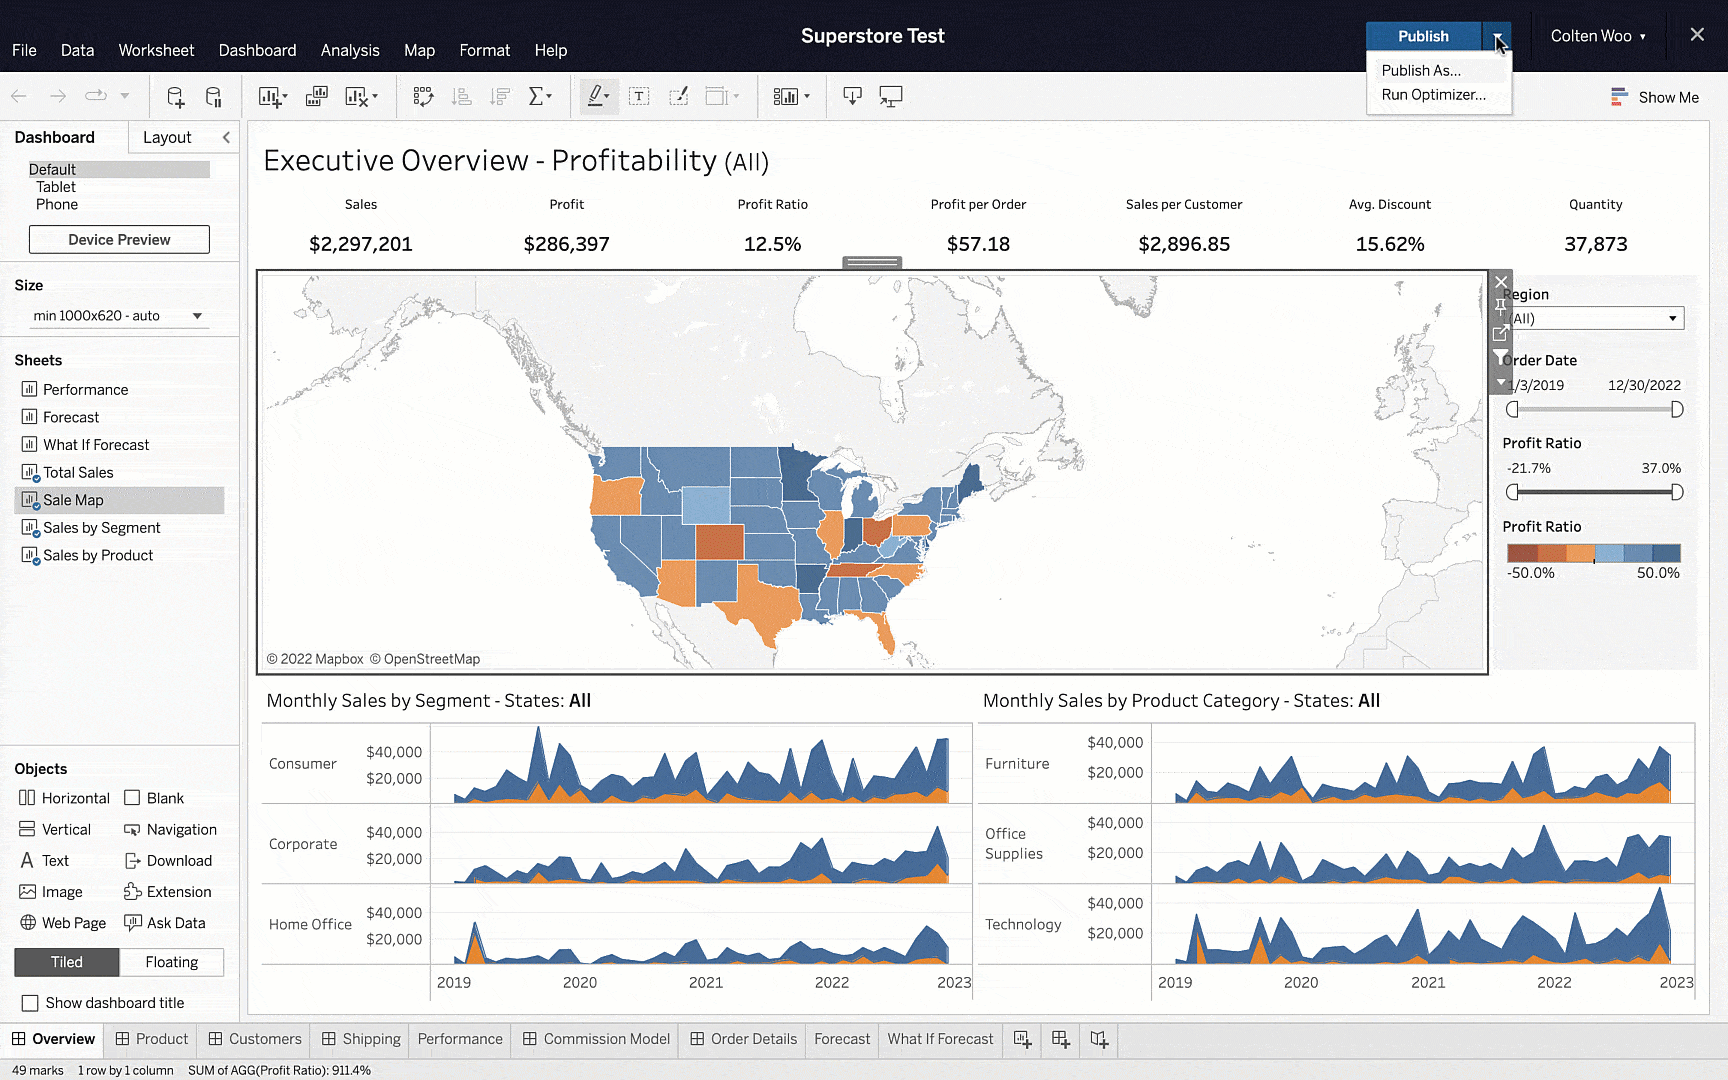
Improve efficiency and performance with Workbook Optimizer
Tableau workbook performance can have a huge effect on the analytics experience for individuals, plus there are implications for your organization at the technology level. If dashboards don’t respond quickly, end users can experience frustration as they try to get insights, while inefficiencies in workbook design can impact overall system performance.
Workbook Optimizer evaluates and exposes key design characteristics based on best practices collected in the comprehensive Designing Efficient Workbooks whitepaper. On the results page, you’ll see a prioritized list of concrete guidance explaining how your workbook design impacts efficiency and offering steps to take to improve your workbook’s performance. In addition to these areas to investigate or act on, you’ll also see items flagged where you’re already designing well.
Years of knowledge and experience from customers, Tableau Community leaders, and internal experts contributed to the creation of Workbook Optimizer. This allows you to access the combined wisdom of Tableau’s robust community without ever having to leave the platform. Using Workbook Optimizer, you can evaluate how your dashboard performs against best practices and publish with confidence that your audience will experience your insights at their best performance.
In the example below, the author is prompted to take action by hiding unused fields. The number of visible workbook sheets and a long calculation are flagged for review. Using Workbook Optimizer, content authors can help everyone in your organization make better decisions faster with optimized workbooks.
To learn more, read Workbook Optimizer in Tableau Help.
Speed up Tableau workbooks with View Acceleration
Dashboard viewers want information and they want it fast. However, complex workbooks can involve a multitude of queries and calculations that may slow their experience. To speed up load times and improve the viewing experience, View Acceleration can be applied to dashboards.
By pre-computing dashboards, View Acceleration boosts performance significantly. Workbooks will follow a pre-computation schedule according to user-defined data freshness policies or extract schedules, ensuring performant and fresh data. Administrators will need to enable this feature; from there, workbook owners can enable or suspend acceleration for workbooks to match their consumption needs.
To get started, read View Acceleration in Tableau Help.
Efficient navigation
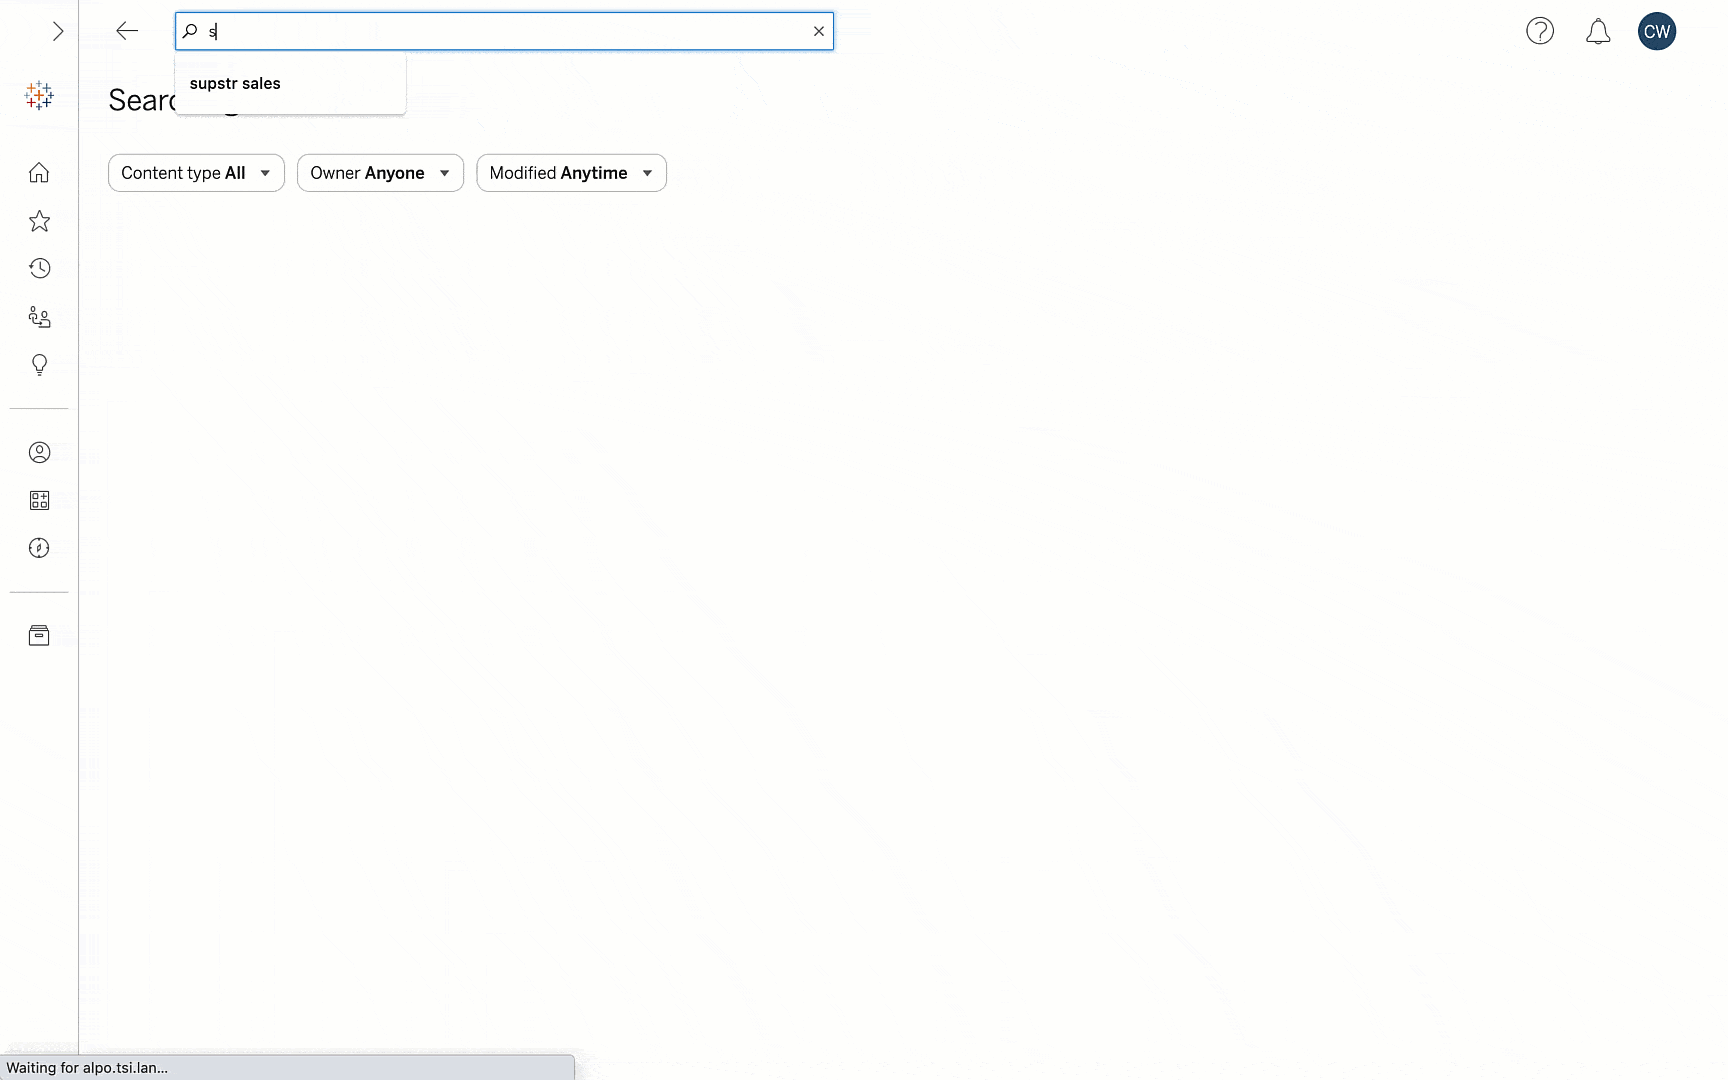
Find meaningful content faster with the new search experience
With the amount of data, users, and analytics use cases always growing, connecting people with the right information can be a challenge. To maximize data investments, organizations need to ensure people can quickly and easily find the right content to explore and take action.
In Tableau 2022.1, we’ve redesigned the search experience for speed and simplicity. Using quality signals, such as recency and popularity, relevant content is brought to the top of the results page. In addition, the new relevance algorithm intelligently corrects for common issues like misspellings, spacing, and punctuation. When navigating through results, content is brought into one unified view—showing all content types—with each presented in the format they’re best viewed.
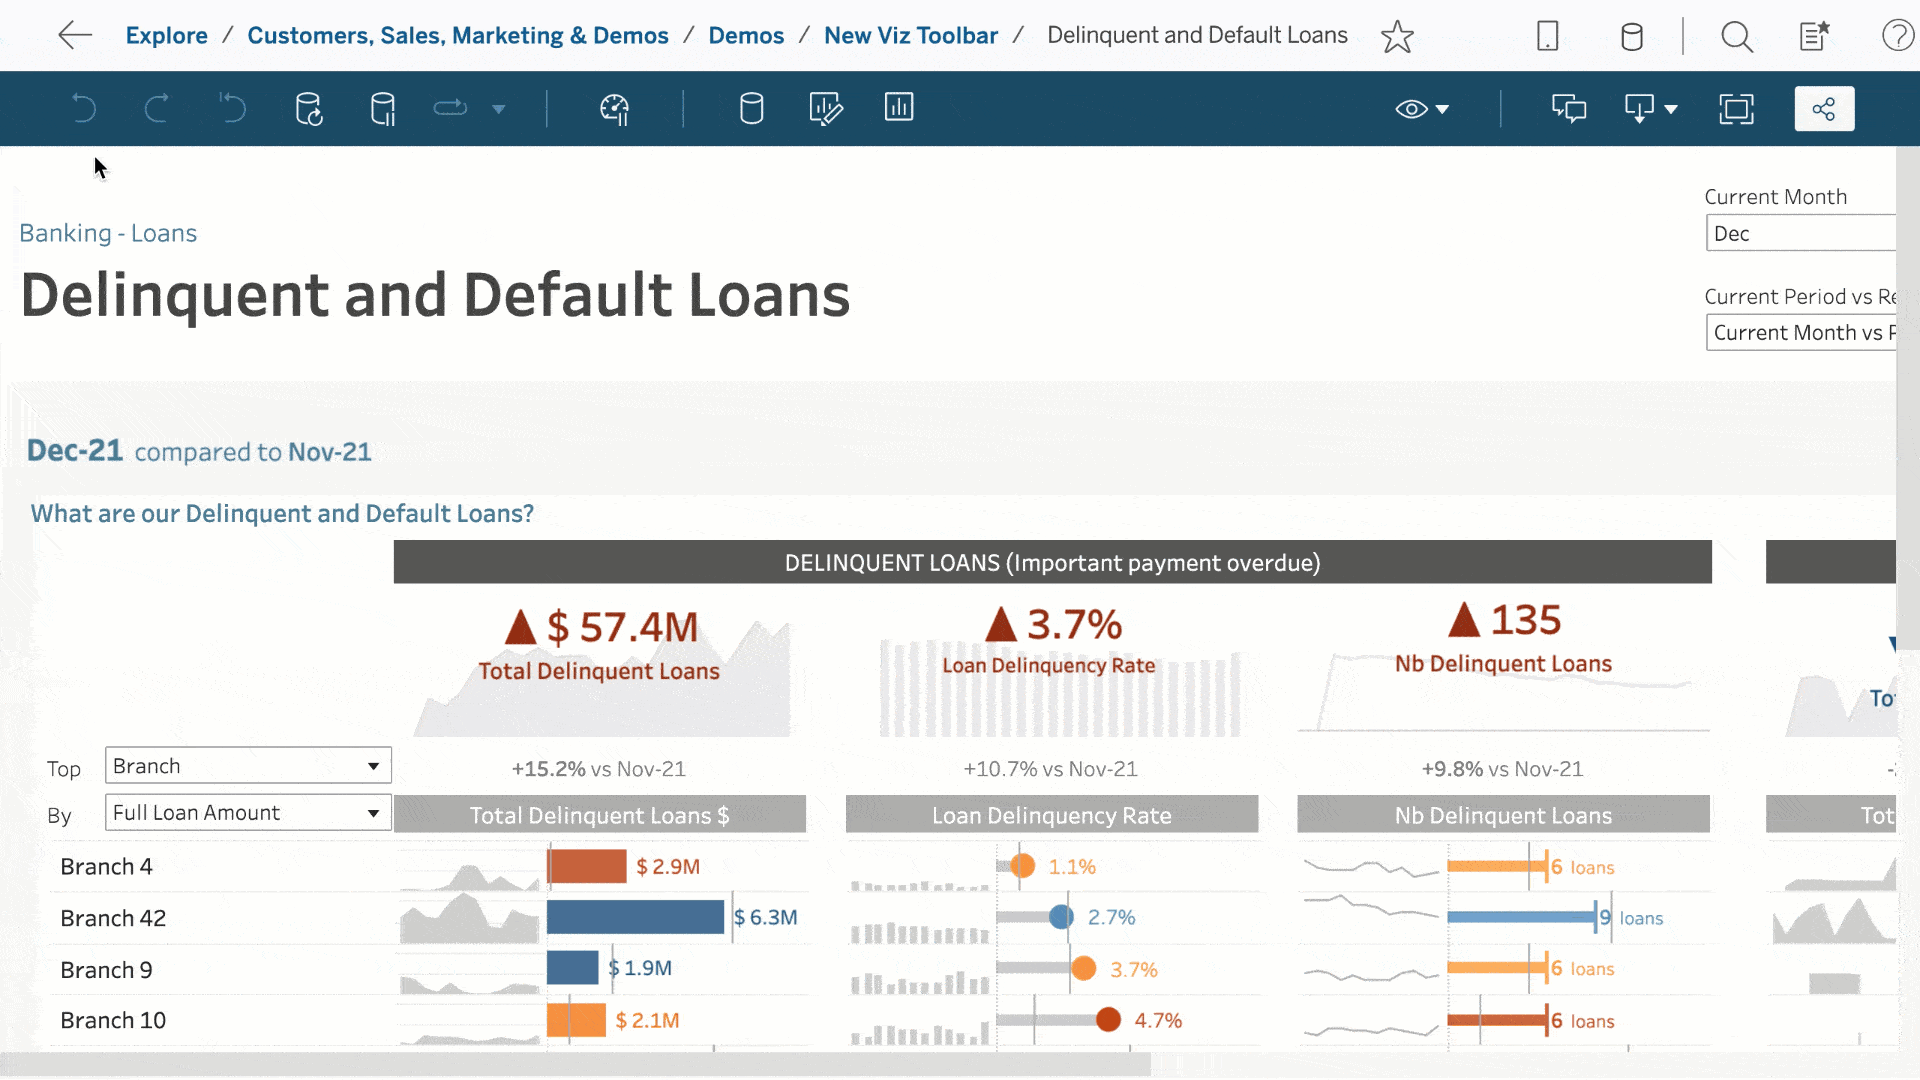
Enhance your viewing experience with the new viz toolbar
To better help dashboard viewers, we’ve redesigned the viz toolbar to create a more intuitive experience complete with helpful tooltips and logical groupings. To get more information about a button’s functionality, simply hover over it and the tooltip will provide some guidance. Through this redesign, people can more easily access tools that enhance their content viewing experience.
The new viz toolbar is grouped into buttons that help you interact with and modify content, monitor performance, explore deeper insights, keep track of updates, and collaborate. Vertical lines help differentiate the groupings so you can quickly find the tool you need. As we continue to innovate and introduce new features, the viz toolbar will utilize these groupings to scale in a way that expands functionality without compromising ease of use.
Explore underlying data with View Data enhancements
When you need to get a little more granular than your viz, View Data allows you to inspect the underlying data in a spreadsheet-like layout. However, this configuration can become unwieldy, often with more fields than you may need. So we’ve updated the View Data interface to help people easily customize it to get the information they need, in the way they want to see it.
With the enhancements to View Data, you can remove and add fields as well as adjust the number of rows to cover the breadth and depth that your analysis needs. Additionally, fields can be reordered and sorted to improve your viewing experience. Once you have achieved your desired data configuration, you can download the data as a CSV in your customized layout.
To learn more, read View Underlying Data in Tableau Help.
Democratized analytics
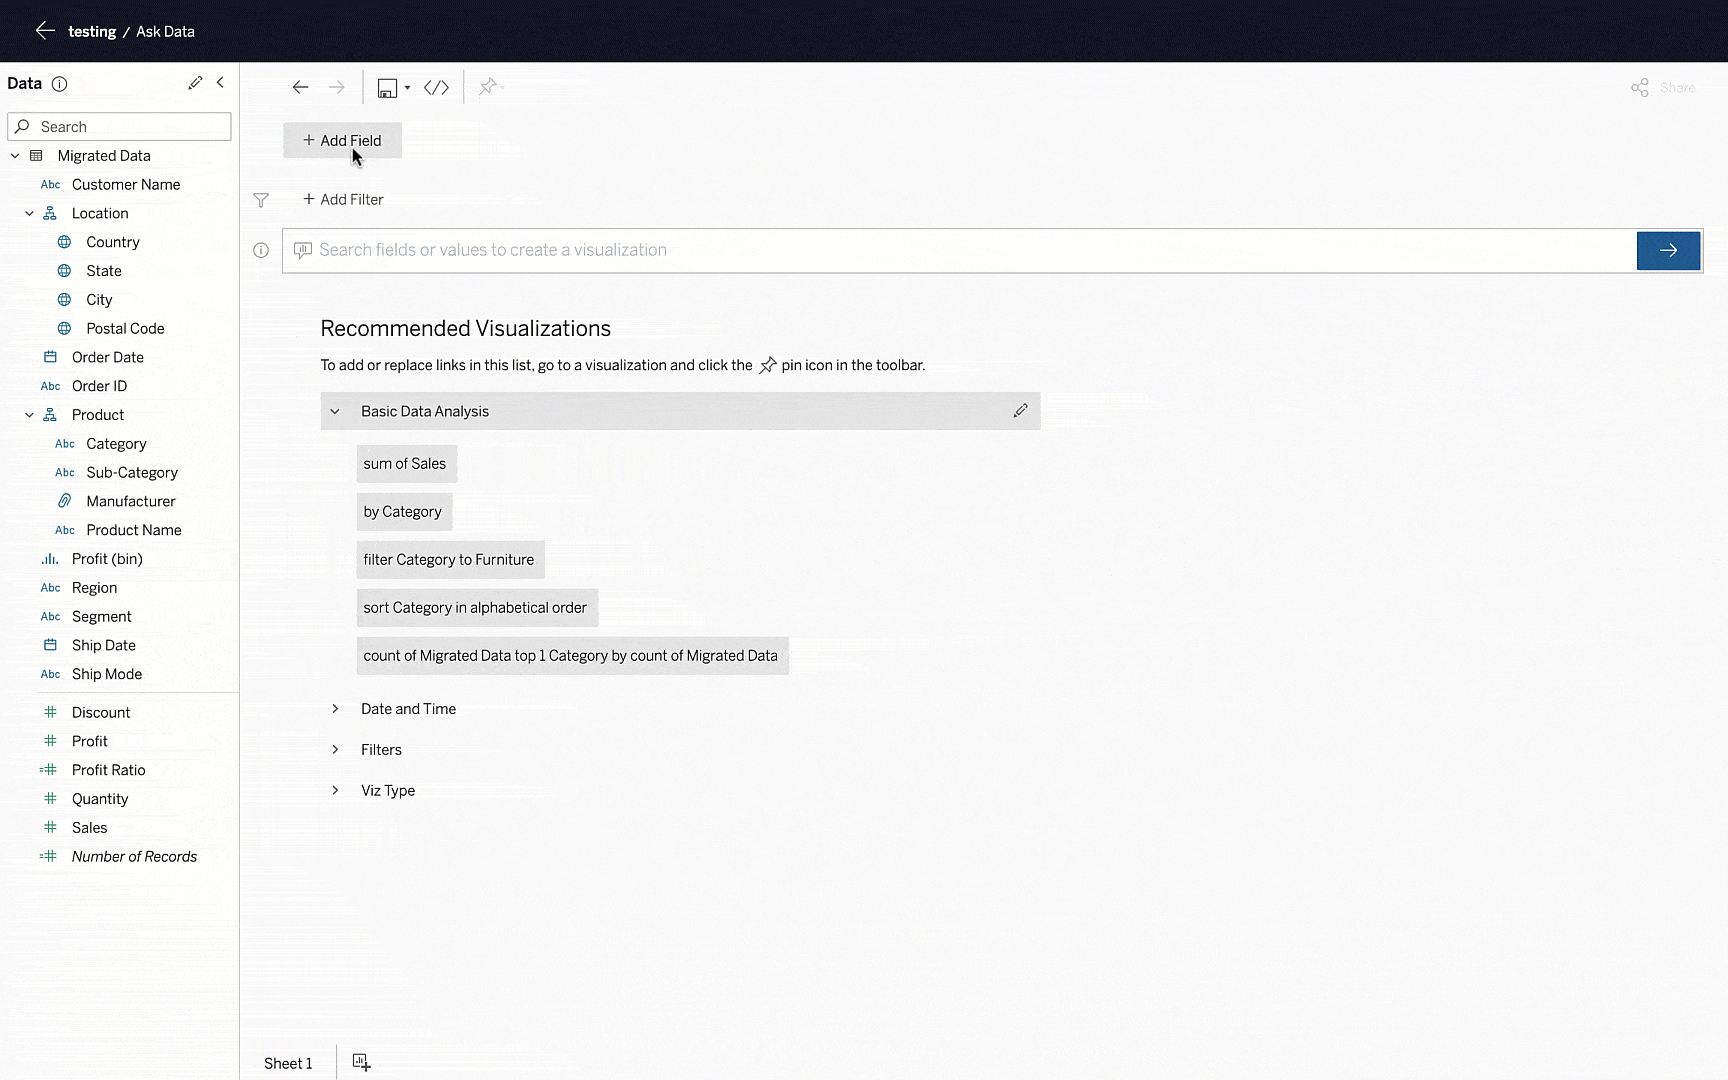
Get insight by asking the right questions with Ask Data Phrase Builder
We understand that not everyone can analyze data in the same way, or with the same level of proficiency. Many business users struggle with data because they may not know how to translate business questions into analytical operations, or which operations the system can process in order to arrive at valuable insights.
That’s why we continuously invest in Ask Data, our natural language experience available to every Tableau user. To lower the barrier to analytical proficiency and make interacting with data even better, Ask Data has been enhanced with a hybrid point-and-click guided experience for asking analytical questions. Ask Data Phrase Builder helps users tailor their questions to get to the right data insight, especially when working with data not well suited to natural language, or where the user doesn't have a clear intent in mind. It’s easy to get started with the new guided experience by clicking the +Add Field button in the Ask Data interface!
To learn more, read Automatically Build Views with Ask Data in Tableau Help.
Call deployed functions with Model Evaluation Function
To fully democratize advanced analytics, business users need to be able to easily access functions that transform their data. To empower users across the organization with robust models, a new calculation type, MODEL_EXTENSION_X, has been added to Tableau.
The new calculation type can be accessed through creating a calculated field. There are four available model extension calculations to support integer, boolean, string, and real output types. Using the provided description, users can easily get started and understand the expected arguments for the function. Once the calculated field is created, it can be incorporated into your Tableau workflow like any other field, enhancing your analysis. Through this capability, any user can execute sophisticated functions without having to write code in Tableau.
To get started, read Pass Expressions with Analytics Extensions in Tableau Help.
Data prep and modeling
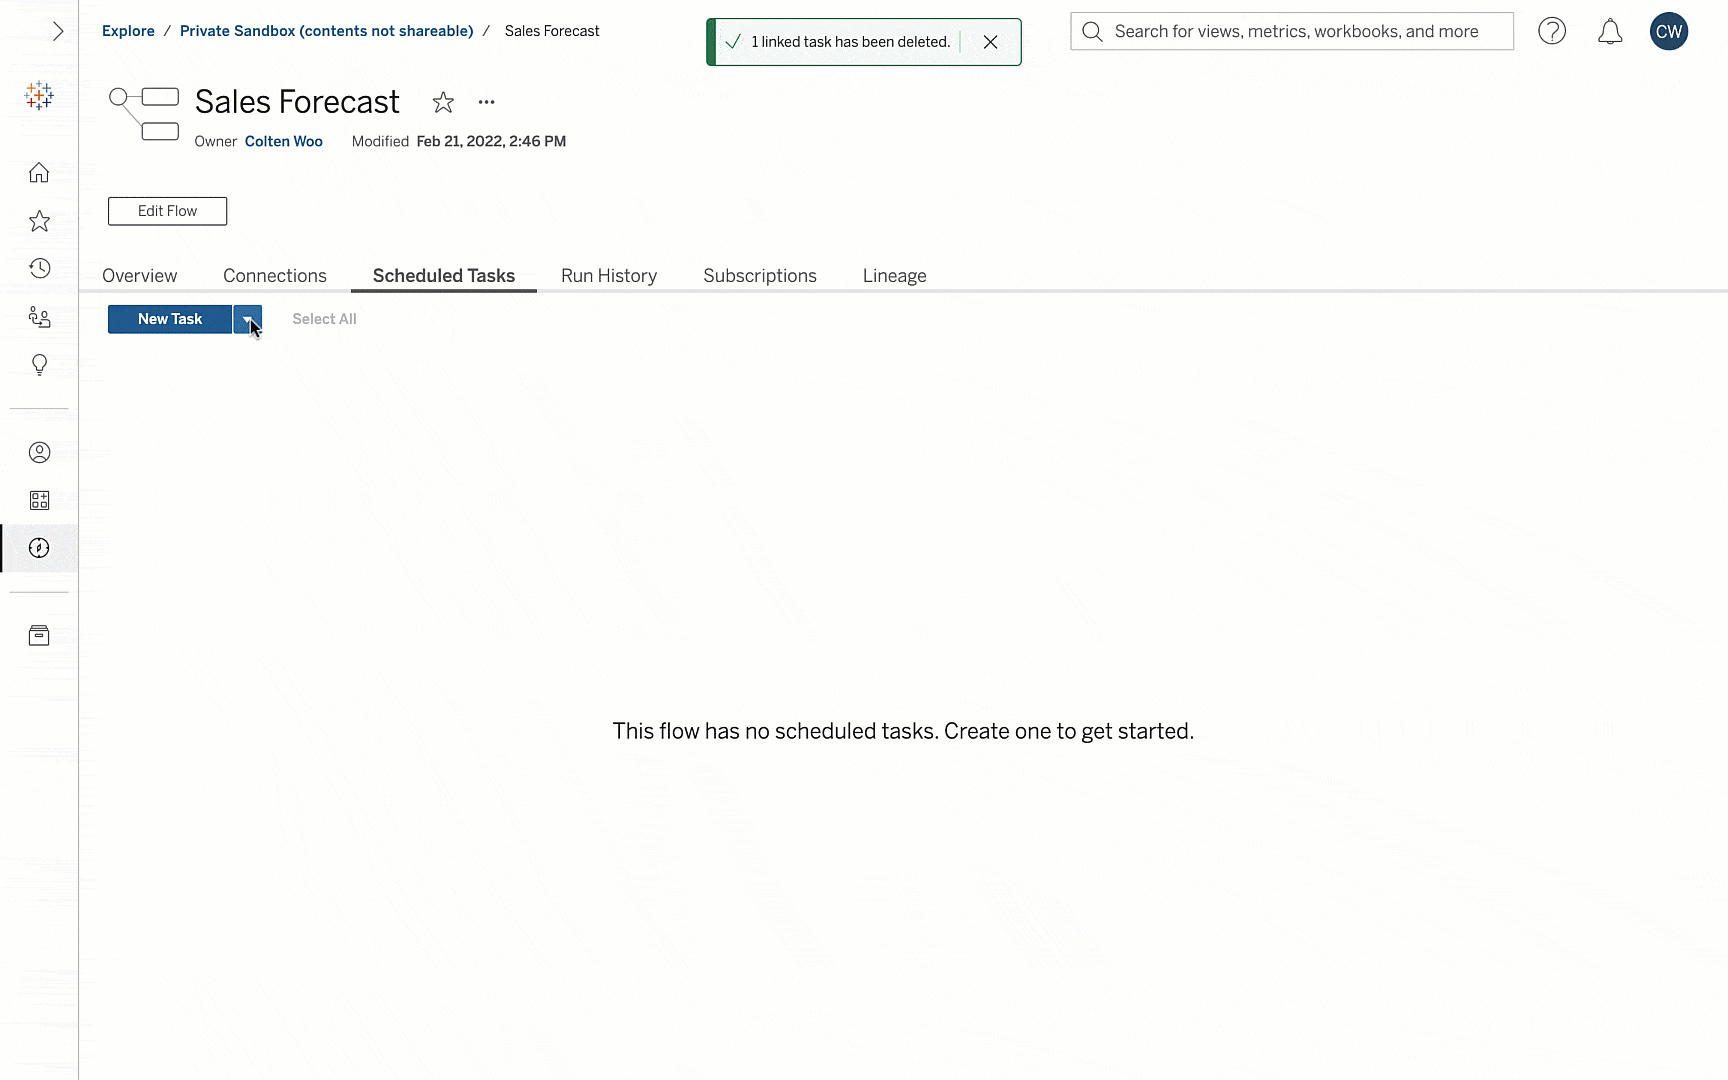
Orchestrate flow jobs with linked tasks enhancements
Tableau 2021.3 introduced linked tasks for Tableau Prep Conductor, which enable users to set flows to run in sequence, preventing stale data and optimally leveraging resources. To make getting started with linked tasks easier, this feature is now enabled out of the box.
Additional functionality for linked tasks has been designed to save you time. In the case of a failed run, backup flows can be set up to ensure that data is refreshed efficiently, without the need to over-schedule flow runs. Linked tasks can now also be run on already scheduled flows for easy integration into your existing data preparation processes. And finally, linked tasks support edits, so you can modify your automated flows without having to rebuild them from scratch.
To get started, read Schedule Flow Tasks in Tableau Help.
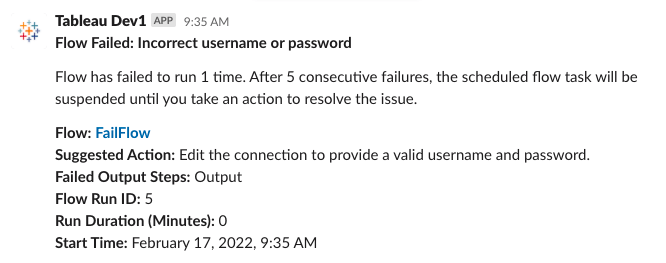
Stay on top of your data with prep flow notifications via Slack
When work flows, insights grow with Tableau for Slack. In this release, we’re deepening our Slack notification integrations to include Tableau Prep. With attention being split between meetings, deliverables, and more, Slack notifications offer a convenient way to stay on top of your data preparation where you’re already working and communicating.
This adds the existing options for in-app and email notifications. Once a Slack workspace is linked to a Tableau site, you can opt in to be notified via Slack if your scheduled prep flow has been suspended or failed. Using these notifications, you can quickly resolve flow issues to keep your data fresh.
To get started, read Integrate Tableau with a Slack Workspace in Tableau Help.
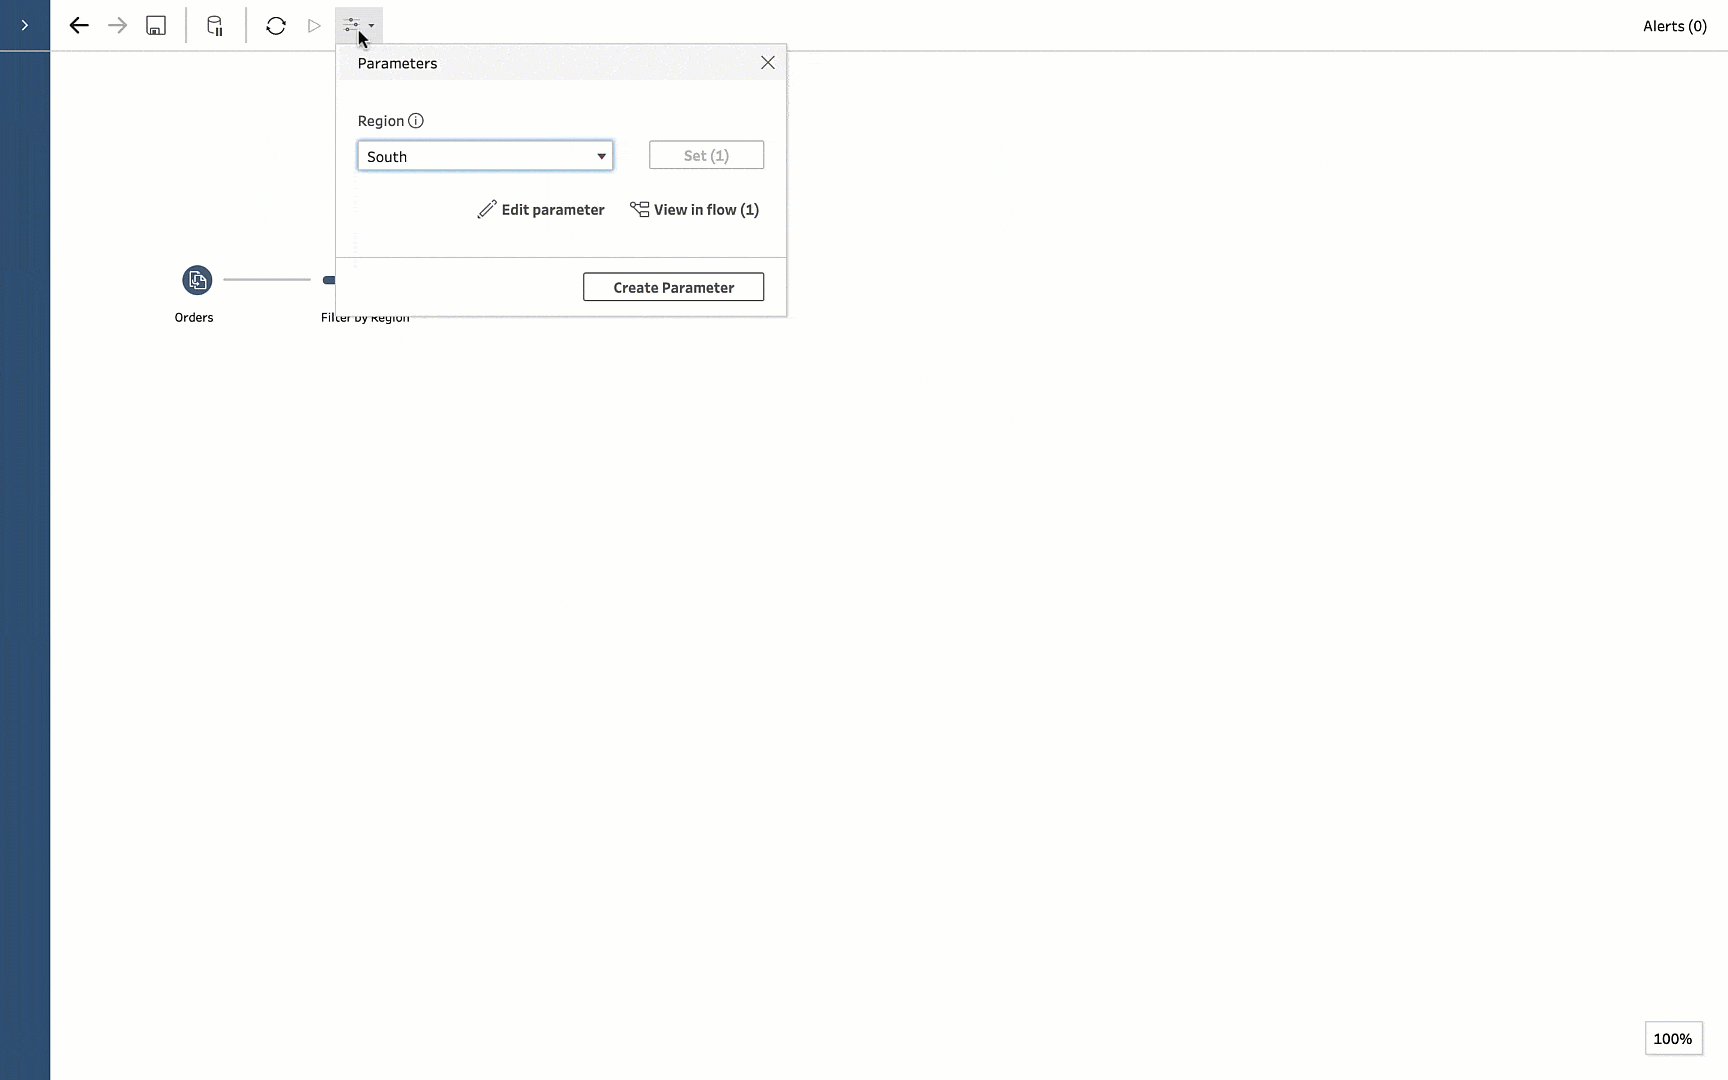
Speed up and simplify data prep with parameters
Since their introduction in 2021.4, parameters in Tableau Prep have helped scale data preparation workflows by enabling users to run flows with variable values. In Tableau 2022.1, enhancements improve usability and extend where you can apply parameters in your flows.
Deleting all instances of a parameter can now be done with a single click so you can work and edit your flows faster. Continuing with the theme of speed, you can cut, copy, and paste parameters between different flows using keyboard shortcuts. Tooltips of the parameter’s descriptions have also been added to provide additional context, in addition to previews for parameterized text fields for clarity. As for extensibility, the dynamic power of parameters can now be applied to worksheet names when outputting to Excel and custom SQL scripts in W2DB Output Nodes.
To learn more, read Create and Use Parameters in Flows in Tableau Help.
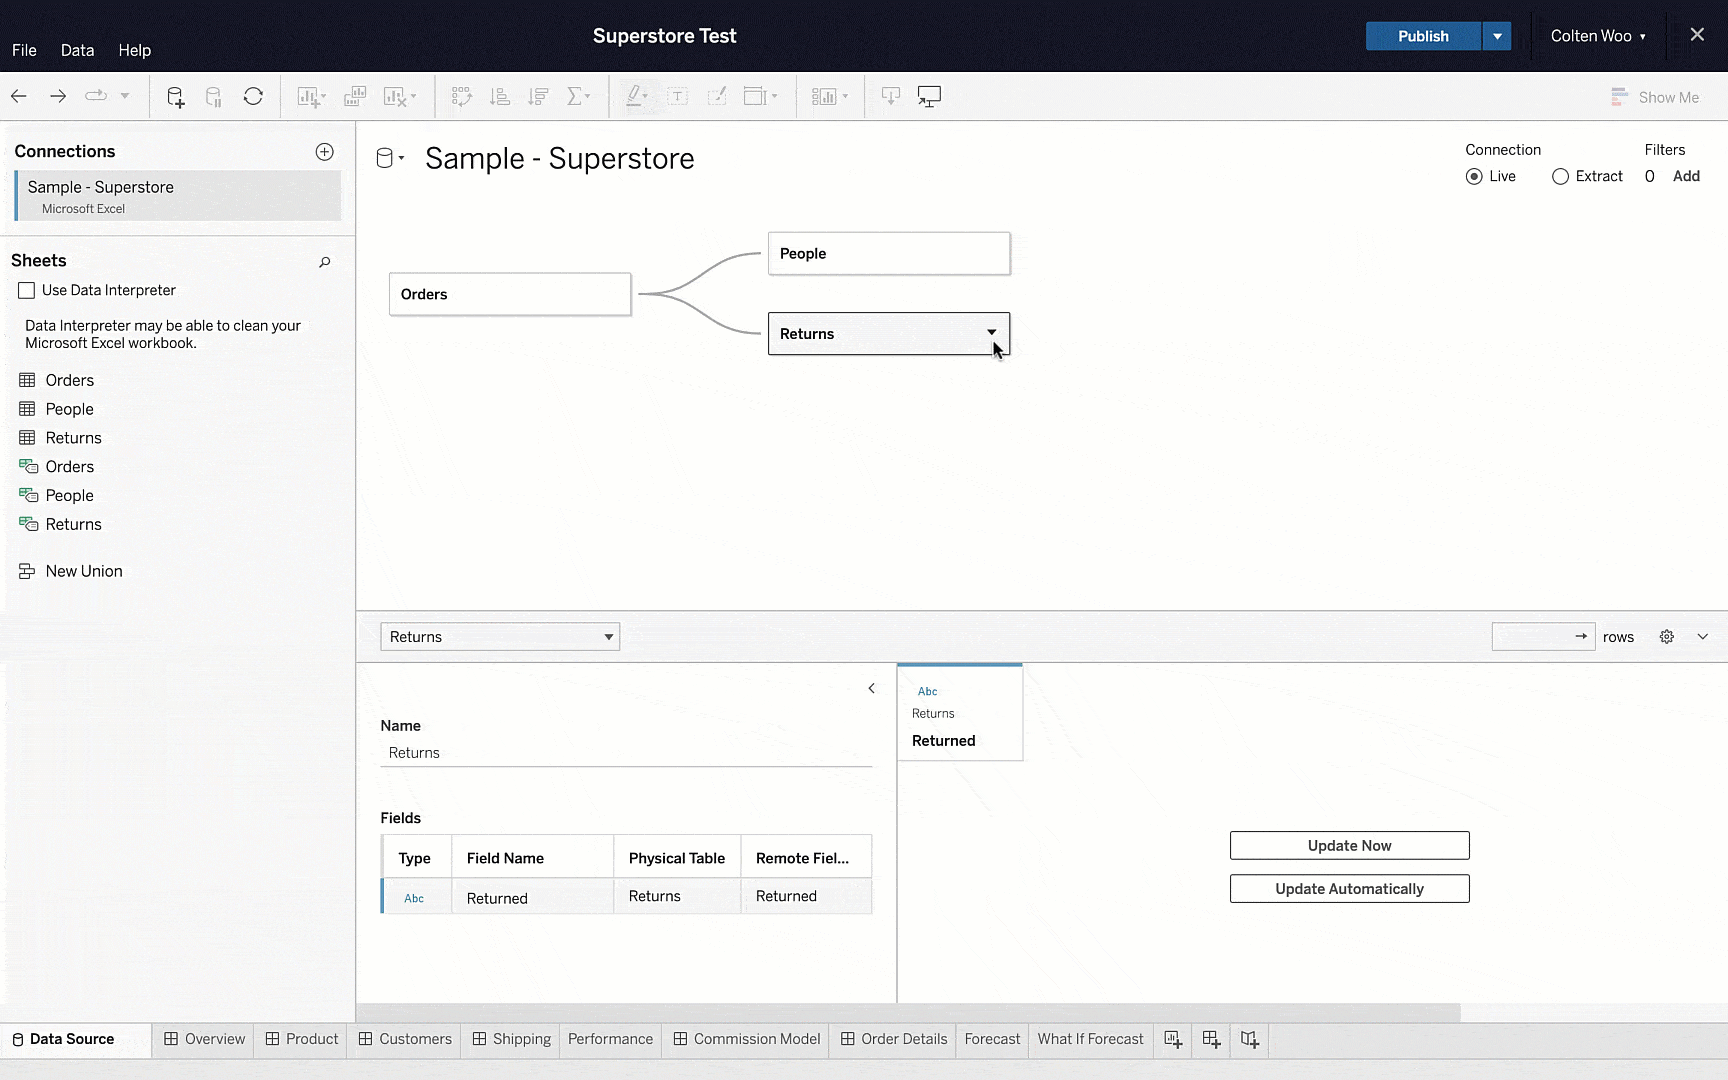
Easily swap root tables in your data model
Data models can become difficult to manage and understand as you add additional tables. To make table management easier and more flexible, data models in Tableau 2022.1 allow you to make any node the new root table.
Changing the root table will keep your data model intact with the same data as before, just reorganized in a layout that makes the most sense to you. This improvement builds on existing functionality so you can move any table throughout the data model, as well as remove any unnecessary tables. When you remove a table from the data model, it also removes its child tables; by leveraging the ability to move the root table, you can more precisely delete tables without affecting the rest of your data model.
To learn more, read Relate Your Data in Tableau Help.
Web authoring
Actions that fit into your web authoring workflow
Web authoring is a convenient method of creating and editing visualizations in Tableau Online and Tableau Server without having to download software. And we’ve been steadily introducing improvements to the web authoring experience.
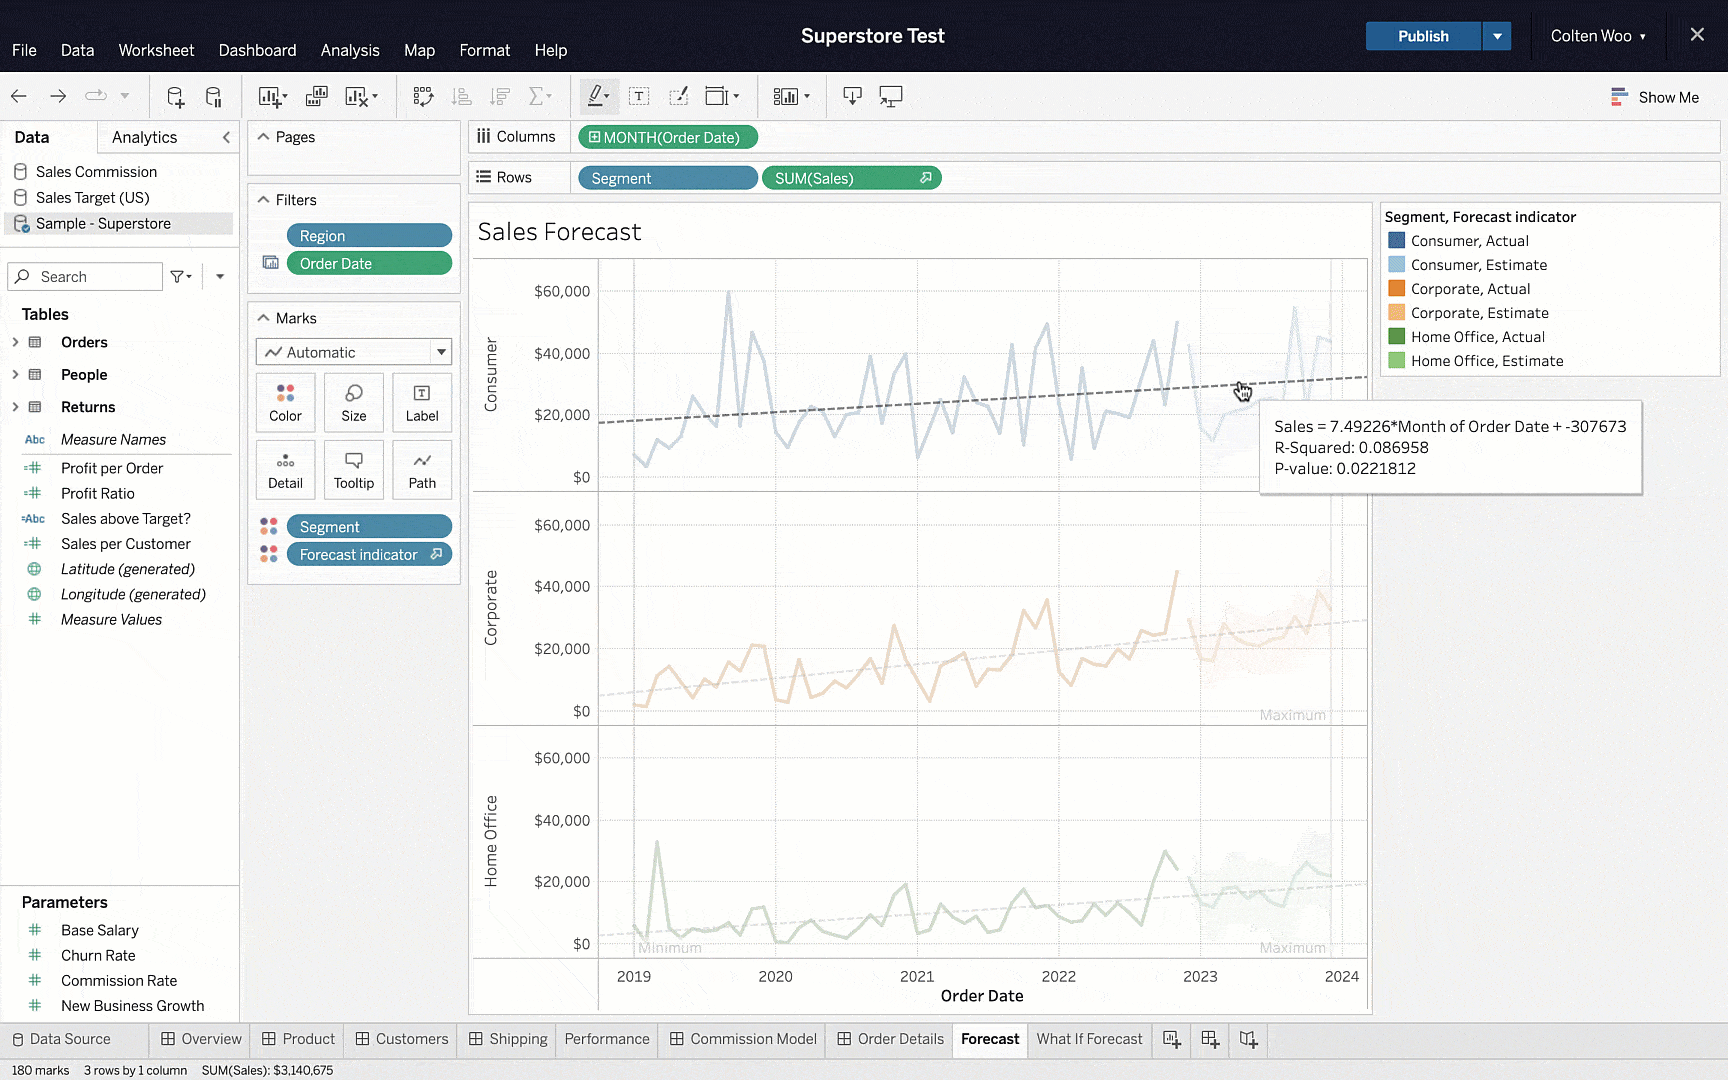
When authoring on the web in Tableau 2022.1, you can format trend lines and reference lines. These formatting options can be accessed via a line’s tooltip, via the right-click menu, or by left-clicking on a line while the formatting pane is open. From there, you can adjust the line’s style, size, and color, and the label’s font, size, and color. Context menus have also been added for trend lines, reference lines, highlighter cards, quick filters, and titles.
Connect to data
Here are the new and updated connectors with Tableau 2022.1:
- Salesforce is available as a data source using virtual connections.
- We’ve made improvements to the Esri web data connector: you can connect Tableau to authenticated ArcGIS servers to extract location data from Esri via REST API.
- New connectors available on the Tableau Exchange: Denodo JDBC, Amazon DocumentDB, and Altinity Connector for Clickhouse.
Want more?
- Upgrade Tableau today to take advantage of these capabilities and many more.
- See the full list of new features from our latest releases, or get the highlights from 2022.1 in our release announcement.
- Visit the Ideas forum and let us know what you want to see next in the Tableau platform.
- Explore the Tableau Release Navigator to find out which version of Tableau has the mix of features your organization needs.
Related Stories

Extend Access to Embedded Tableau Content with On-Demand Access
 July 22, 2026

The Tableau+ Bundle with Premium AI, Enterprise Capabilities, and Premier Success
 June 24, 2026

What is Tableau Prep?
 April 30, 2026