How Tableau Public Transformed Elisa Davis' Data Viz Career


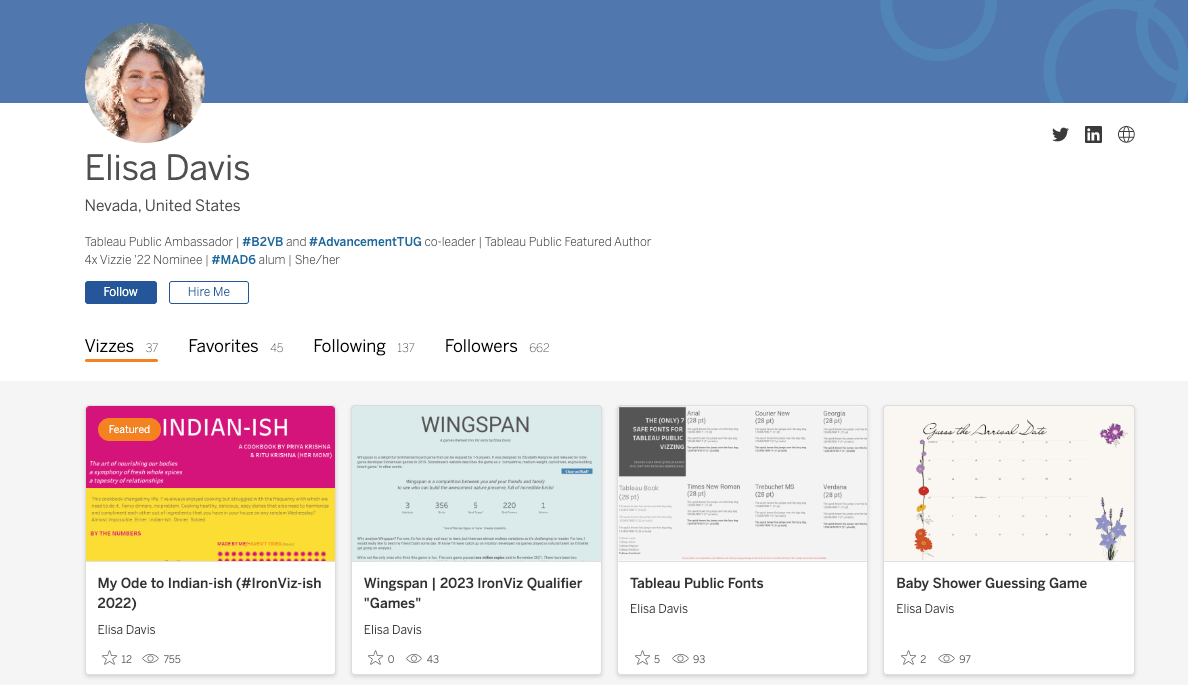
Since the platform was founded in 2010, millions of people have used Tableau Public to develop their data visualization skills, find inspiration, and connect with like-minded data enthusiasts from around the world. It has also helped people switch careers or uncover new data visualization job opportunities—especially now that authors can turn on the Hire Me button. That's why I am delighted to celebrate the accomplishments of those in the Tableau Community, like Elisa Davis.
Elisa Davis earned a BA in Math from Smith College, a Master's in Public Administration from Syracuse University’s Maxwell School and has, “always loved design, visual arts, and storytelling.” She is a walking testament to Tableau Public’s power to transform your career. Since my conversation with her in 2022, Tableau Public has boosted her even higher. In 2022 she became a Lead Business Intelligence Analyst at Discover Financial Services, and is currently a Senior Consultant at Onware, Inc—a consulting company specializing in construction and supply chain data enablement. Elisa still "can't quite believe she gets paid to viz all day."

“I wouldn’t be in my current role if I hadn’t had the opportunity to stay sharp and grow my skills with Tableau Public in the transition.”
She was selected as a 2023 Tableau Public Ambassador, making this her second year in the program, she was included in the Featured Authors: Hire Me Edition, and was recognized with the Michael Christiani Community Leadership Vizzie award at the 2023 Tableau Conference. Not to mention that she has also presented for 2 years at Tableau Conference about Tableau Community Project—Back to Viz Basics. She is “so grateful to all of the Datafam leaders who welcomed her into the community, and excited to use this opportunity to do the same for the next who follow this path.”
How long have you been using Tableau?
Since Wednesday, January 17, 2018! Tableau had been installed on my work desktop for slightly longer than that, but the first time I opened it up I could tell that it was a phenomenally powerful tool and if I tried to DIY my learning path, I might get confused or skip steps. I effectively advocated for my team to go to an in-person training session for Tableau Desktop.
What role has Tableau Public played in your professional development?
After that Desktop course, I had skills, ideas, and very little direction as to how to put them to use. Being out during parental leave and then phasing back in part-time gave me the chance to completely pivot my role. The team absorbed my old responsibilities, in my absence, and new leadership saw potential in using Tableau to run her team.
I knew about Tableau Public by then and attempted a Makeover Monday or two (that I never published), but I was pretty focused on internal projects at that point. I happily “grew up” as an analyst and Tableau Developer for a few years in that role. Eventually, I wanted data visualization to be the main pillar of my job.
I had a sense that I would need to build a Tableau Public profile to “cross over” into the main data viz ecosystem out of Higher Education/Fundraising Analytics. I was following that instinct when I stumbled across Chantilly Jaggernauth’s Millennials and Data Analyst Bootcamp literally the day that the fall cohort started, and I didn’t hesitate. I published my first viz for Millennials and Data in September 2021.
Chantilly required us to turn in our homework on Tableau Public, so I had a regular publication schedule with data provided to me, viz review by one of the greats, and a great cohort of fellow learners. By the end of the class in January, I had started making connections in the broader DataFam and had settled into a biweekly viz publication cadence.
I took a stab at Iron Viz, made sure to get to Tableau Conference in April, and had a chance conversation with a fellow DataFam member that led to my role with Discover. It’s not an understatement to say that Tableau Public and the DataFam changed the course of my career and my life.
How did you get involved with the Tableau Community Project Back to Viz Basics?
Back to Viz Basics (#B2VB) was kicking off right as my Millennials and Data (#MAD) course was winding down. As a participant, I added a personal challenge for myself each week; viz basketball stats, but in dark mode with custom icons. Create some KPIs, but pretend you’re designing them for Justina Blakeney’s Jungalow website. My business viz aesthetic is pretty minimal, so #B2VB gave me space to experiment with color and bring a sense of humor into my work.
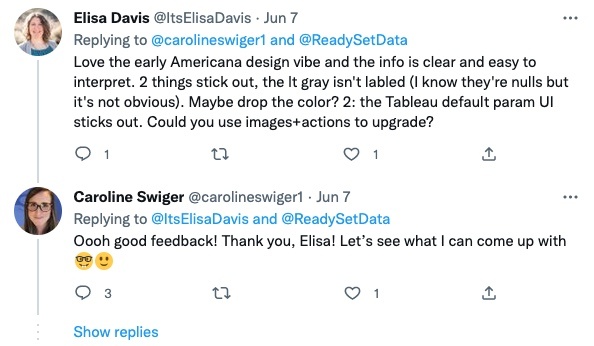
Another key piece of this journey was making a public commitment to give #B2VB feedback on Twitter. I really enjoyed the feedback element of #MAD and seeing how many different ways there are to interpret the same data, even with the same set of requirements. As I was scrolling through #B2VB entries for inspiration, I noticed that some people were brave enough to write “feedback welcome” and had gotten zero comments.
So, I challenged myself to improve my own feedback skills while helping the DataFam. I would say that this was my first step towards leadership in the community—completely unofficial, stepping up where I saw a gap.
I’d been providing #B2VB feedback on Twitter for a few months when I met Eric Balash at Tableau Conference. Our conversations about the project led to me joining the leadership team in an official capacity. Running a community project is a lot for one person, sometimes we’ve even got our hands full with two!
I don’t get as many personal vizzes out for B2VB as I did before becoming a project leader (ok, none, they’re all stuck in drafts). But, I’ve learned a ton about sourcing data, brainstorming topics, matching topics with data and all the behind-the-scenes work that goes into running a challenge.
We try really hard to have a technical skill that still leaves room for a creative element, have squeaky clean, approachable data that still has enough depth for analysis, and a blend of serious and silly topics.
I’ve yet to “score” my first personal #VizOfTheDay, but there have been 12 Back to Viz Basics related vizzes. I’m pretty proud that we’re currently on a six-topic streak: a viz from weeks 13 through 19 has earned Viz of the Day! It’s an incredibly talented community committed to learning and growing. The group shifts over time, but everyone who consistently completes B2VB challenges shows tons of growth. I love being part of it.
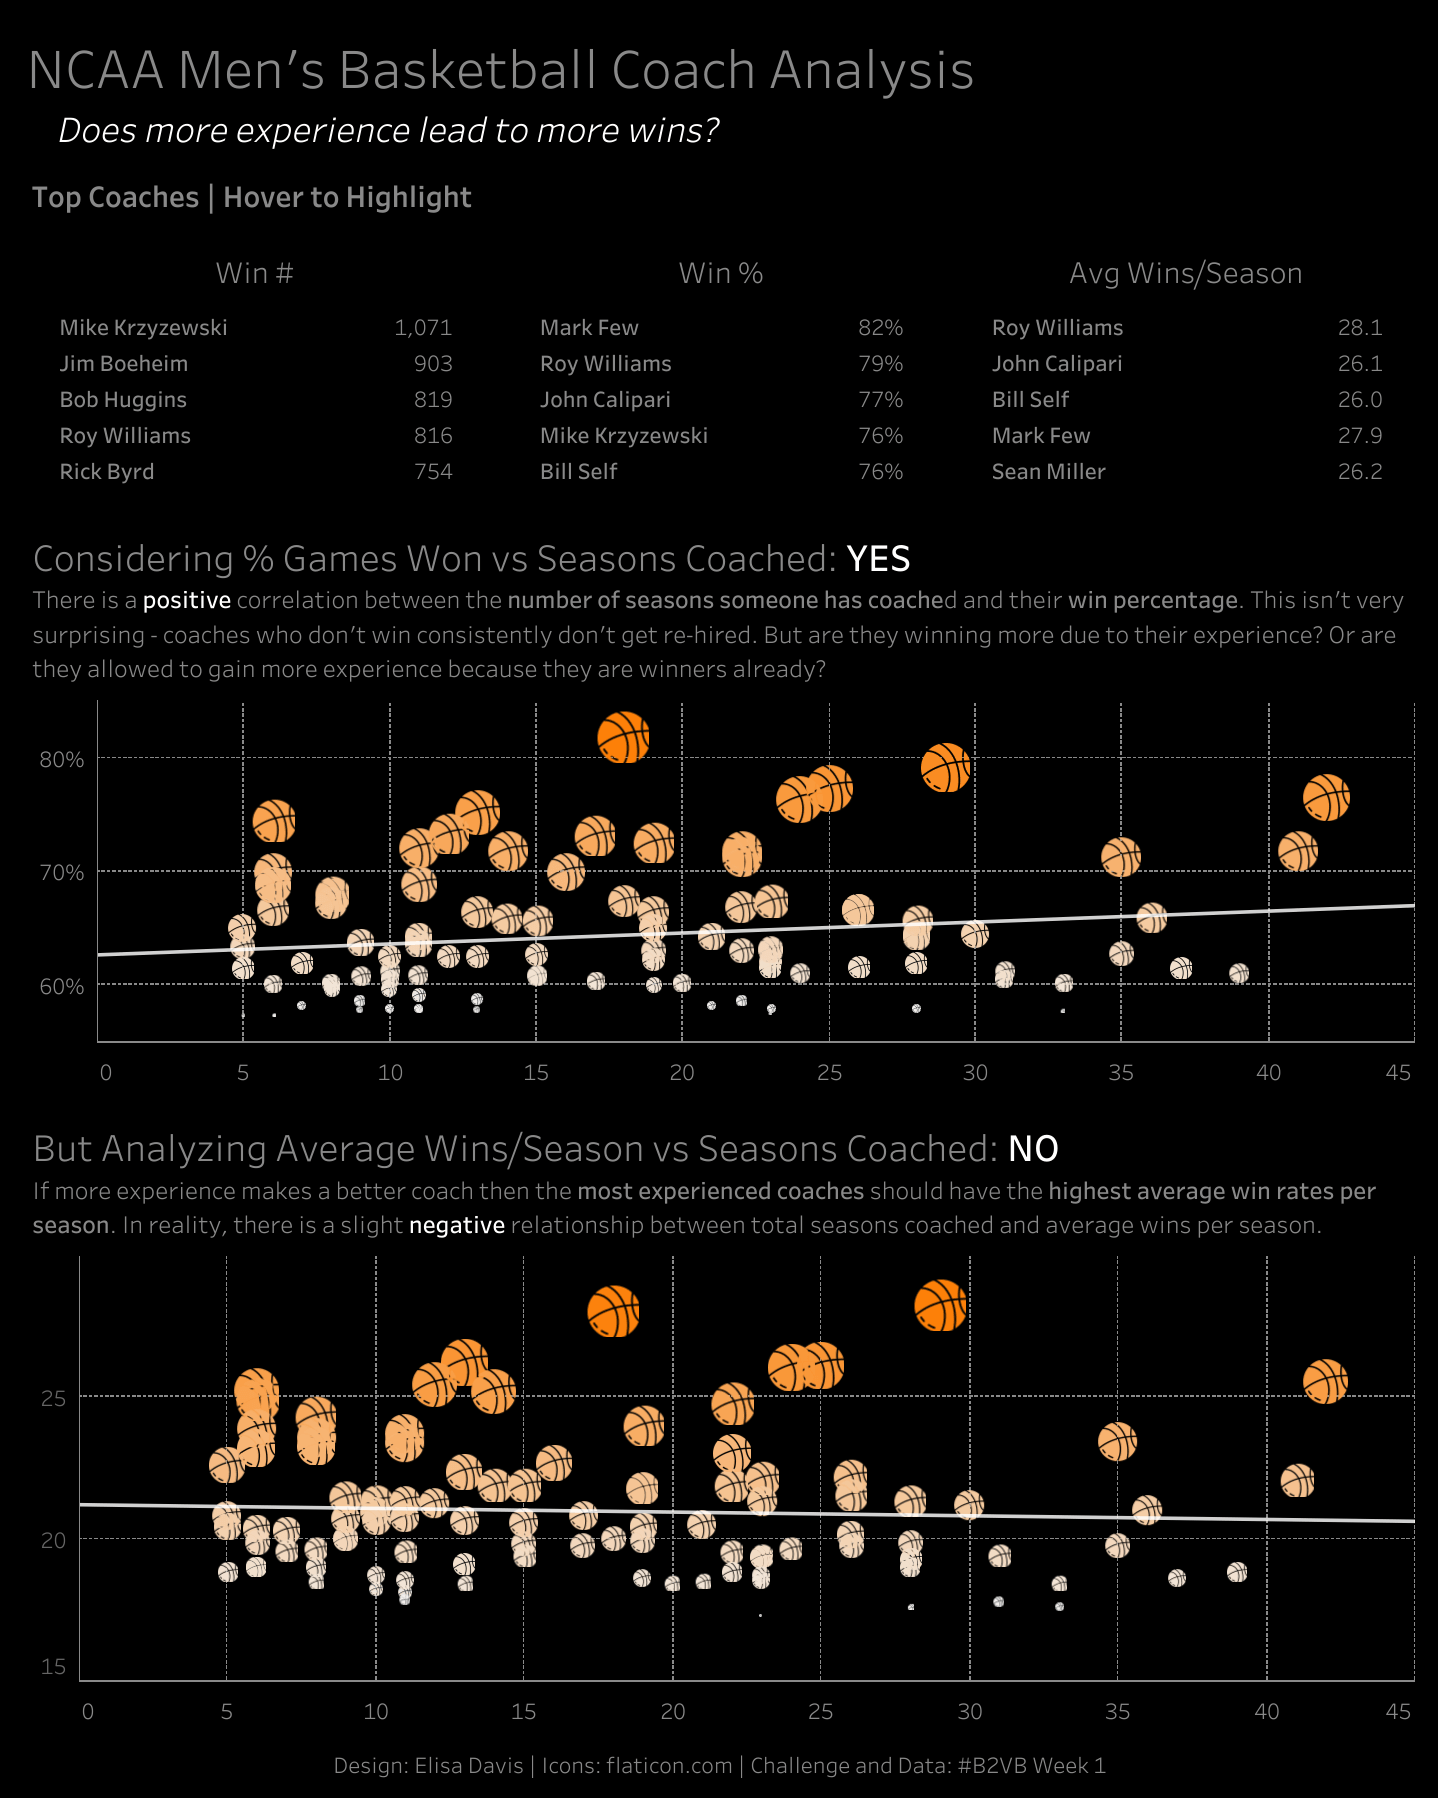
Elisa's 'Men's NCAA Basketball Coaches #B2VB Wk1' data visualization.
Do you have a favorite viz or author on Tableau Public?
I have dozens of favorite authors on Tableau Public. Let’s do callouts by category.
Business viz inspiration:
Technical Wizards:
Storytelling:
Design (many of the above and also):
Community building:
Can I leave a permanent placeholder for whoever I forgot to call out by name? There are SO many inspiring authors on Tableau Public that it’s basically impossible to name them all.
What role has the DataFam had on your Tableau journey?
I have to admit that the first time I heard the phrase “DataFam” I rolled my eyes a little. It was back in my solo analyst days attending TC19. I remember thinking, they know we’re at a software conference, right? For work? However, when I was ready to start “vizzing in public,” the DataFam was there for me the whole way.
Sarah Bartlett introduced me to the Twitter #DataFam via a #TableauFF (Follow Friday). Adam Mico included me on his Jan ‘22 Tableau’s Next list. Following a presentation to the Advancement (Fundraising) Tableau User Group, I was invited to join its leadership team.
Kevin Wee and I connected at TC22, which in turn led to my new role at Discover. And now, one year after launching my Tableau Public portfolio, I was recognized as a Tableau Public Ambassador. I still remember each of the little nods, nudges, and high fives I got from prominent DataFam community members when I was new to Tableau Public. They were all so encouraging, and I’m excited to pay that forward.
And these are just a few of the highlights! Because the work one does on Tableau Public tends to be more creative and unique than the dashboards typically built for work, there’s a vulnerability that lends itself to building new friendships. Some of my closest friends are DataFam I’ve connected with through Tableau Public + Twitter.

Elisa Davis, Kevin Wee, Michelle Frayman, and Brittany Rosenau at Tableau Conference 2022.
We are celebrating 12 Years of Tableau Public. What is your favorite feature of Tableau Public?
The people using it! But my second favorite feature is that it’s completely free, which is huge for people who are transitioning into a dataviz career and don’t have employer-provided Tableau Desktop. I actually went a full year without access to Tableau Desktop during my recent career transition, so I count myself in that group. I wouldn’t be in my current role if I hadn’t had the opportunity to stay sharp and grow my skills with Tableau Public in the transition.
There are also fantastic implications to offering everyone the chance to learn the tool for free. Anyone with a laptop and internet access can teach themselves the tool, or get practice with it. You don’t have to buy an expensive software license to learn on your own, and it opens the door to a lucrative career field.
If members of the DataFam visit Reno, NV what do you recommend they do?
If you’re here the weekend after Labor Day, the Great Reno Balloon Races is incredible and free. You can be there at 5 AM for the dawn patrol, when colorful balloons light up in the dark, or show up at 7 AM for 100 balloons taking off all at once.
If you’re in the area in the Winter, skiing is a great choice. My home mountain is Mt. Rose, but I also love Alpine Meadows and Heavenly. Don’t miss the chance to stop by Lake Tahoe—it’s only 45 mins away. Hiking in the nearby Sierras is fantastic too, just don’t come during wildfire season.

Elisa, her kid, and balloons from the Great Reno Balloons Race this year.
Related Stories

DataFam Roundup June 2026

Tableau Ambassador Nominations and Applications are Open
 June 10, 2026
