DataFam Roundup: September 25–29, 2023


Welcome! Dig into this week's DataFam Roundup—a weekly blog that brings together community content all in one post. As always, we invite you to send us your content—and the DataFam content from your peers that have inspired you! Find the content submission form here.
Community Highlight
To recognize new and consistent Tableau contributors—we’re excited to have a section within the weekly DataFam Roundup called the Tableau Community Highlight. Find out how to get involved.

Mia Freidenburg, Data Analyst
Washington, USA
Mia Freidenburg is a Data Analyst from Seattle, Washington. When Mia left her position as Operations Manager, she knew she enjoyed working with data and had already been working with data in a number of ways without really recognizing it. She put time into researching various data professions and attended a Tableau workshop, where she confirmed that data analysis and working with Tableau on a regular basis was a path she wanted to take. Her favorite projects are ones that make full use of the flexibility Tableau has: layered/customized maps, radar charts, etc.
Currently, Mia is active on Tableau Public and on her Medium site. On Tableau Public, Mia publishes vizzes that cover a range of topics: from personal Spotify statistics to weather pattern data. On her new Medium site, Mia plans to publish content relating to the projects she works on. The next article Mia plans to write will cover tutorials about the Spotify API, Spotify's own documentation, and her own knowledge of pulling data on Spotify songs, which she ended up putting in Tableau to create radar charts of the audio feature values.
Connect with Mia on Linkedin, X, her Medium site, and Tableau Public.
DataFam content
Dive into content created by the Tableau Community:
-
Deepak Holla:
-
Katie Kilroy: Tableau Desktop Resources for Newbies
-
Matthias, Design in Data: Navigate the Pitfalls of Sophism in Data Analytics
-
Heidi Lanford, The Data Leadership Collaborative: Three Vital Concepts CDOs Must Master to Realize Value
-
Annabelle Rincon, rativiz:Hiring Tableau Experts : Attitude over skills?
-
Venkatesh lyer: How to Build a Hierarchy Filter in Tableau: Part 2 of 3
-
Vignesh Suresh: Tableau Tip: Top and Bottom with Index
-
Adam Mico: Dreamforce 2023: Navigating the Generative AI Frontier
-
Catherine Callahan: #tinytableautip
-
Rosario Gauna, RosarioViz: Target Achievement Report
-
Dawn Harrington, TechTipsGirl: Reference Lines Too Wide? Use This Trick!
Team Tableau
Upcoming events and community participation
-
Get Started with Tableau Public for Data Visualization [Online]: 2023-10-04: You will leave this workshop with an understanding of how to:
-
connect datasets to your Tableau workbook;
-
create a variety of basic chart types (including bar charts, line graphs, and maps);
-
publish and share interactive charts and graphs.
-
-
Demystifying the way to learn Data Visualization! Are you looking for a way to learn Data Visualization and feeling lost? We all have been there and I am going to help you understand the fundamentals and look for a way to learn data visualization.
-
Career Pathmakers: This is the launch event for the Career PathMakers user group. This group will be focused on helping its members navigate challenges in their careers, both with a mentorship program and a transition support program.
-
Viz Collab is back: Hello everyone! I’m excited to be opening #VizCollab back up for another round of matches! In the last year I matched around 40 people for some amazing vizzes, including Viz of the Days and a viz that was featured in a local publication. So if you want to find a collaboration partner sign up.
-
Local Community Conferences by the DataFam, for the DataFam.
Vizzes
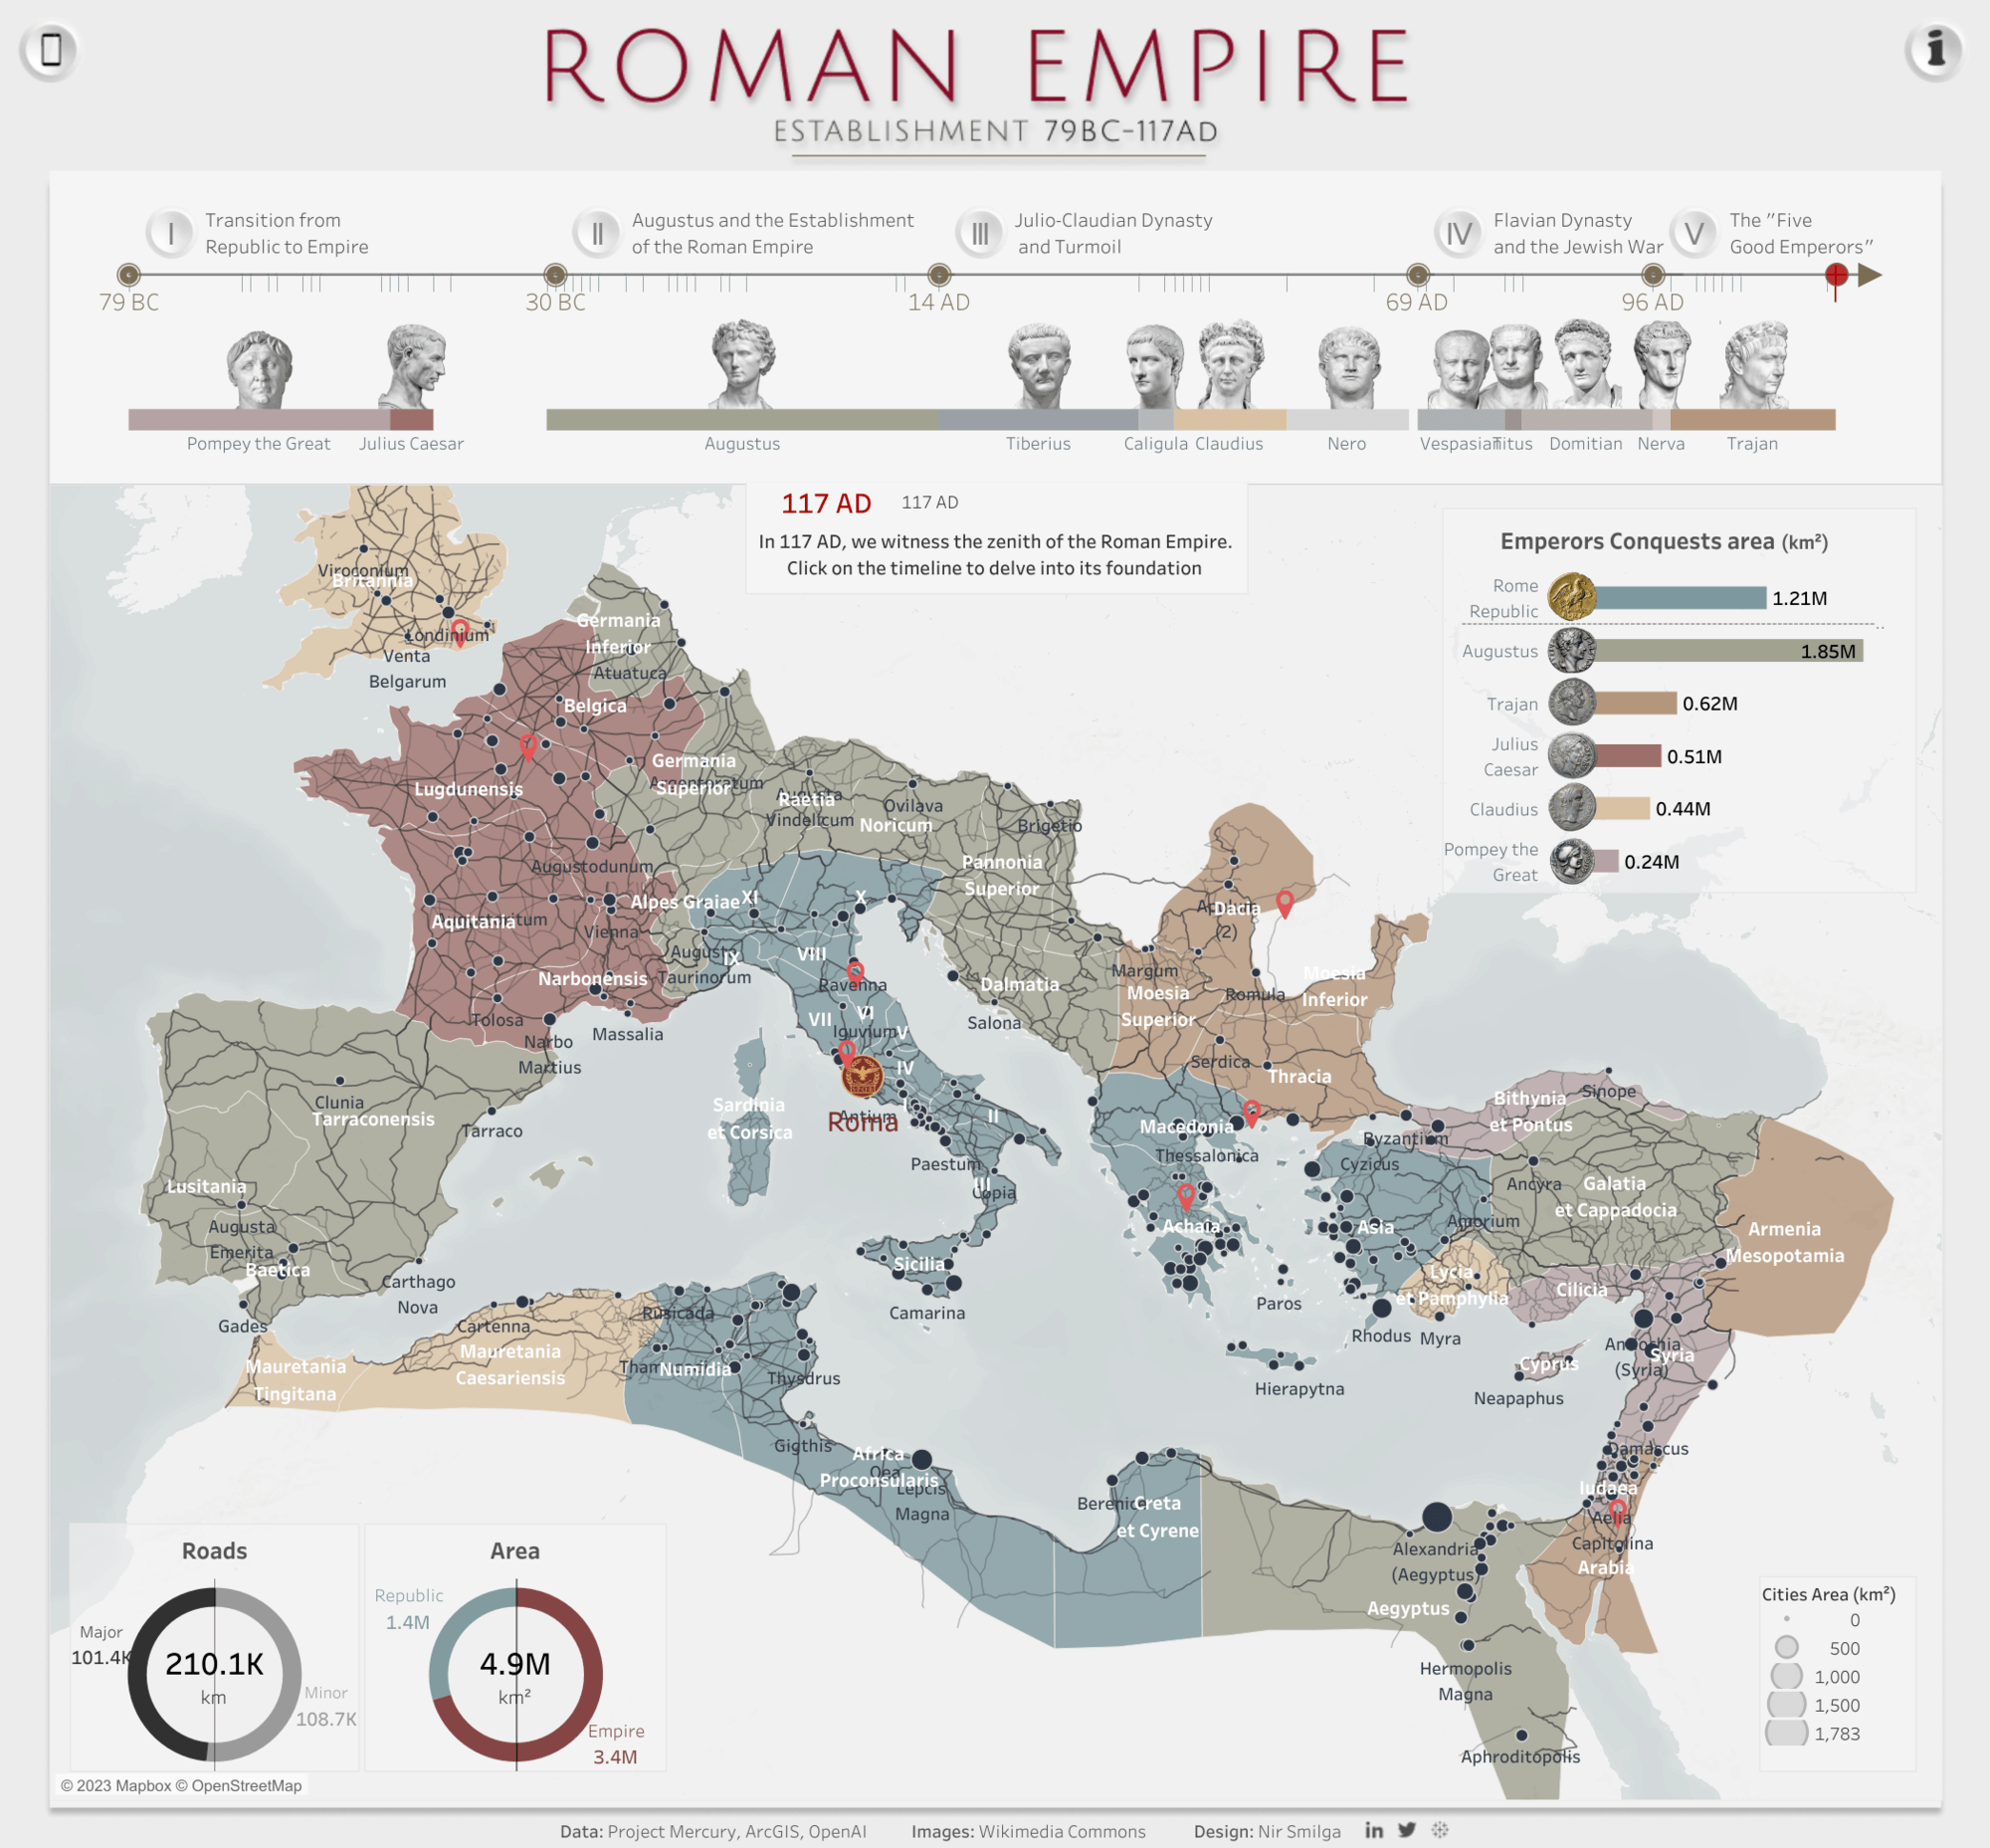
Nir Smilga: Roman Empire Establishment 79BC-117AD
See the latest Viz of the Day, trending vizzes, featured authors, and more on Tableau Public.
Check out some inspirational vizzes created by the community:
-
Louis Yu: 10 hacks to make your dashboard GREAT!
-
Omokehinde Eseohe Ayodeji: Everest Group
-
Nir Smilga: Roman Empire Establishment 79BC-117AD
-
Chris Meardon: View vs Favourites for Tableau Public Trending Workbooks
Community Projects
Back 2 Viz Basics
A bi-weekly project helping those who are newer in the community and just starting out with Tableau. Not limited just to newbies!
Web: Back 2 Viz Basics
Twitter: #B2VB
Week 19: Your Chart Choice
Workout Wednesday
Build your skills with a weekly challenge to re-create an interactive data visualization.
Web: Workout Wednesday
Twitter: #WOW2022
Week 39: Target Achievement Report (Guest)
Makeover Monday
A weekly social data project.
Web: Makeover Monday
Twitter: #MakeoverMonday
Week 39: Street Level Temperatures in NYC
Preppin' Data
A weekly challenge to help you learn to prepare data and use Tableau Prep.
Web: Preppin’ Data
Twitter: #PreppinData
Week 39: Tennis 200 Club
DataFam Con
A monthly challenge covering pop culture and fandoms.
Web: DataFam Con
Twitter: #DataFamCon
September 2023: Barbie World!
EduVizzers
A monthly project connecting real education data with real people.
Web: Eduvizzers
September 2023: School Book Bans in the United States
Games Night Viz
A monthly project focusing on using data from your favorite games.
Web: Games Nights Viz
Twitter: #GamesNightViz
Season 2: Battle of the Strongest
Iron Quest
Practice data sourcing, preparation, and visualization skills in a themed monthly challenge.
Web: Iron Quest
Twitter: #IronQuest
White Space
Storytelling with Data
Practice data visualization and storytelling skills by participating in monthly challenges and exercises.
Web: Storytelling with Data
Twitter: #SWDChallenge
September 2023: makeover magic
Project Health Viz
Uncover new stories by visualizing healthcare data sets provided each month.
Web: Project Health Viz
Twitter: #ProjectHealthViz
June 2023: Funding for Research for Various Conditions and Diseases
Diversity in Data
An initiative centered around diversity, equity & awareness by visualizing provided datasets each month.
Web: Diversity in Data
Twitter: #DiversityinData
May 2023: Mental Health Awareness Month and LGBTQ+ Representation in film
Sports Viz Sunday
Create and share data visualizations using rich, sports-themed data sets in a monthly challenge.
Web: Sports Viz Sunday
Twitter: #SportsVizSunday
January 2023: Is it a Sport or a Game?
Viz for Social Good
Volunteer to design data visualizations that help nonprofits harness the power of data for social change.
Web: Viz for Social Good
Twitter: #VizforSocialGood
June 9 - July 18, 2023: Gord Downie & Chanie Wenjack Fund
Real World Fake Data
Create business dashboards using provided data sets for various industries and departments.
Web: Real World Fake Data
Twitter: #RWFD
Session 5: Diversity Score Card
Data Plus Music
A monthly project visualizing the data behind the music we love!
Web: Data Plus Music
Twitter: #DataPlusMusic
Related Stories

DataFam Roundup June 2026
Tableau Ambassador Nominations and Applications are Open
 June 10, 2026
