DataFam Roundup: May 5-9, 2025


Welcome! Dig into this week's DataFam Roundup—a weekly blog that brings together community content all in one post. As always, we invite you to send us your content—and the DataFam content from your peers that have inspired you! Find the content submission form here.
Community Highlight
To recognize new and consistent Tableau contributors—we’re excited to have a section within the weekly DataFam Roundup called the Tableau Community Highlight. Find out how to get involved.

Caleb Givens, Digital Marketing & Data Specialist at Feeding the Gulf Coast
Alabama, USA
Caleb Givens is a Digital Marketing & Data Specialist at Feeding the Gulf Coast. At work he uses Tableau to visualize his food bank's data, allowing him to quickly analyze trends and see if goals are being met to provide food for those experiencing food insecurity. Caleb enjoys participating in the Tableau Community because of how easy and inviting it is to be a part of. He appreciates that members of the DataFam are always willing to take the time to answer questions and engage with fellow data enthusiasts.
As Caleb was on his Tableau-learning journey, he knew very early on that he wanted to connect with other people at food banks who were using Tableau. Though he had a good grasp on the basics, he wanted to see what others were doing with real-world, real-industry data. Caleb started the Food Bank Tableau User Group out as a Slack community to get members connected and sharing ideas, use cases, and questions. Later, in 2024, Caleb pivoted his efforts into creating the official Food Bank Tableau User Group chapter and, as its leader, has today grown it to 133 members.
Connect with Caleb on Linkedin, X, and Tableau Public.
DataFam Content
Dive into content created by the Tableau Community:
- Elisa Davis: Behind the Corkboard: A Viz, A Vibe, and an Interview About Both
- Dawn Harrington: Sensitive Data? Add an AFFIRM Button!
- Keith Helfrich: Jeffrey Shaffer on AI and the Future of Tableau
- Kyle Massey: VizQL Data Service for Tableau – A Deep Dive
- Ojoswi Basu: Steer Clear of Plagiarism: Give Credits on Tableau Public
- Gurpreet Singh: How to Setup Postman for Tableau API
- Johan de Groot: Change marks on Hover
- Steve Adams: Don’t Lose Your RAG: How to Use Red, Amber & Green Responsibly in Dashboards
- Deepak Holla:
Team Tableau Content
Visualizations
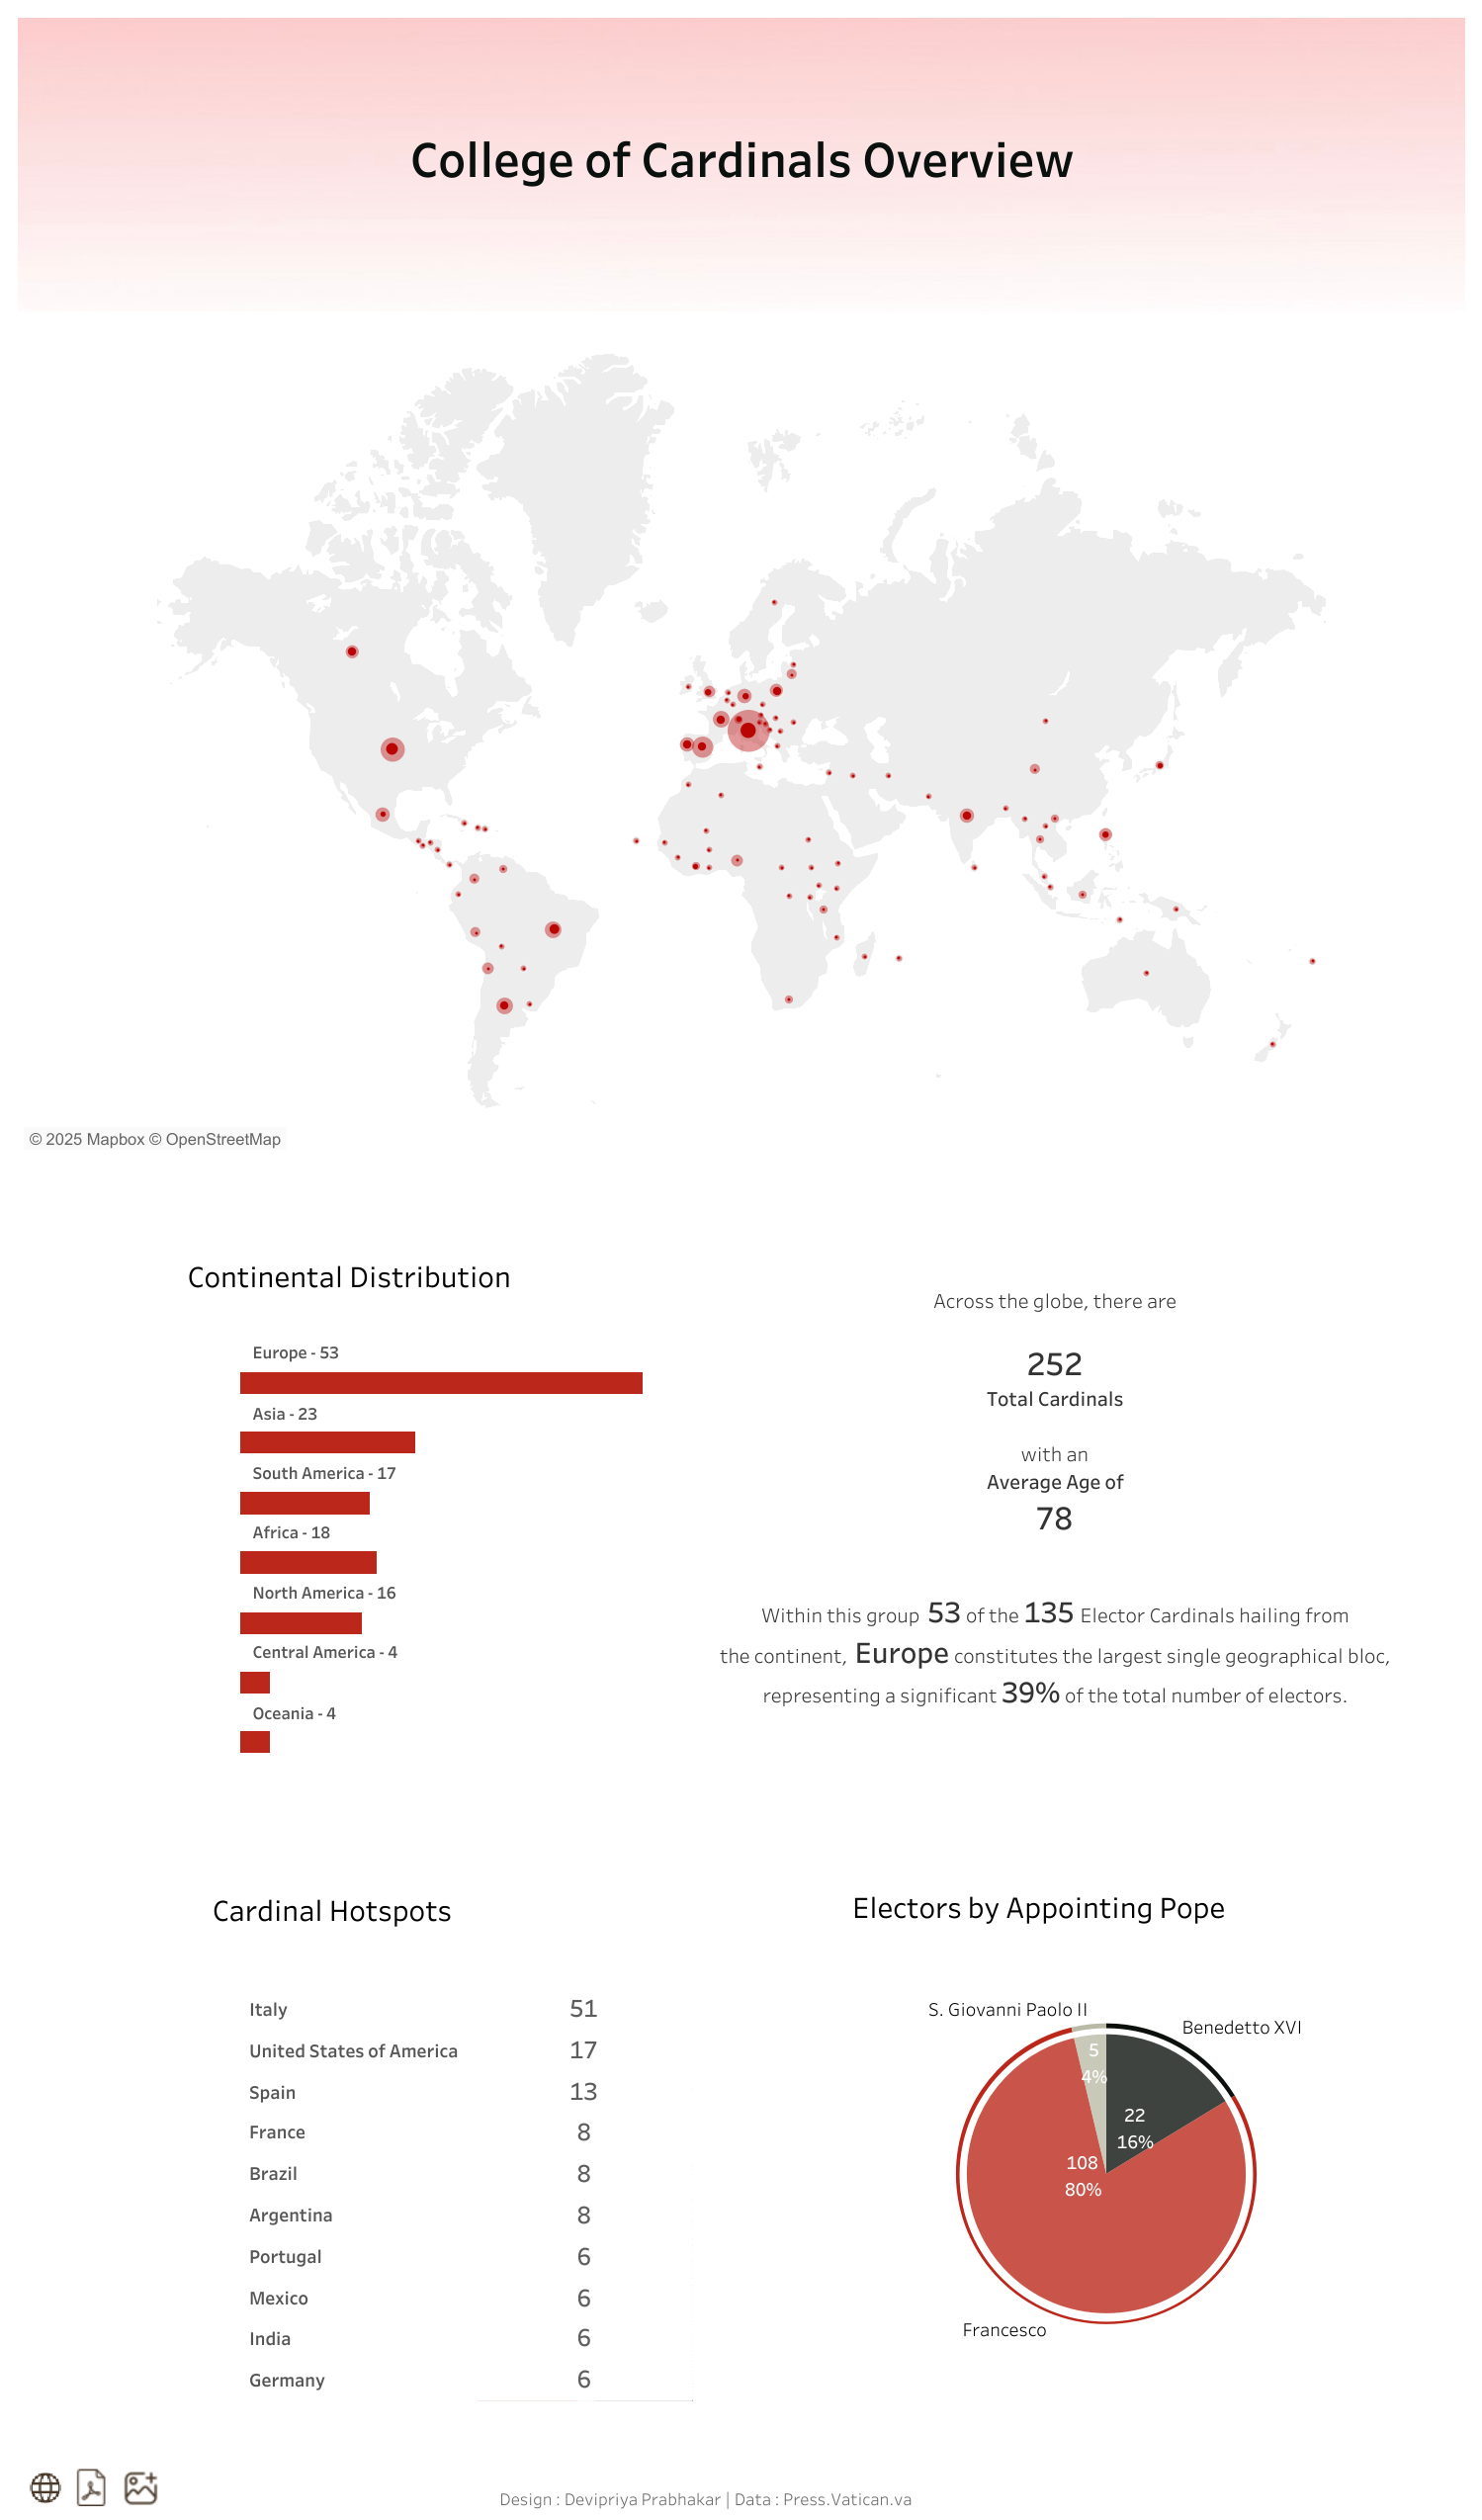
Devipriya Prabhakar: College of Cardinals
See the latest Viz of the Day, trending vizzes, featured authors, and more on Tableau Public.
Check out some inspirational vizzes created by the community:
- Arshi Saleh: Asian Restaurants in US | MakeoverMonday W19/2025
- Shangruff Raina: REGIONAL DAYCARE COST SCORECARD
- Joel Reed: Snooker's Greatest Players
- Anthony J. Young: TC25
Community Projects
Back 2 Viz Basics
A bi-weekly project helping those who are newer in the community and just starting out with Tableau. Not limited just to newbies!
Web: Back 2 Viz Basics
X: #B2VB
Workout Wednesday
Build your skills with a weekly challenge to re-create an interactive data visualization.
Web: Workout Wednesday
X: #WOW2022
Preppin' Data
A weekly challenge to help you learn to prepare data and use Tableau Prep.
Web: Preppin’ Data
X: #PreppinData
Makeover Monday
Create business dashboards using provided data sets for various industries and departments.
Web: Makeover Monday
X: #MakeoverMonday
Visual Climate
Collaborate and share climate data.
Web: Visual Climate
X: #VisualClimate
DataFam Con
A monthly challenge covering pop culture and fandoms.
Web: DataFam Con
X: #DataFamCon
EduVizzers
A monthly project connecting real education data with real people.
Web: Eduvizzers
Games Night Viz
A monthly project focusing on using data from your favorite games.
Web: Games Nights Viz
X: #GamesNightViz
Iron Quest
Practice data sourcing, preparation, and visualization skills in a themed monthly challenge.
Web: Iron Quest
X: #IronQuest
Storytelling with Data
Practice data visualization and storytelling skills by participating in monthly challenges and exercises.
Web: Storytelling with Data
X: #SWDChallenge
Project Health Viz
Uncover new stories by visualizing healthcare data sets provided each month.
Web: Project Health Viz
X: #ProjectHealthViz
Diversity in Data
An initiative centered around diversity, equity & awareness by visualizing provided datasets each month.
Web: Diversity in Data
X: #DiversityinData
Sports Viz Sunday
Create and share data visualizations using rich, sports-themed data sets in a monthly challenge.
Web: Sports Viz Sunday
X: #SportsVizSunday
Real World Fake Data
Create business dashboards using provided data sets for various industries and departments.
Web: Real World Fake Data
X: #RWFD
Data Plus Music
A monthly project visualizing the data behind the music we love!
Web: Data Plus Music
X: #DataPlusMusic
Related Stories

DataFam Roundup June 2026
Tableau Ambassador Nominations and Applications are Open
 June 10, 2026
