DataFam Roundup June 16-20, 2025


Welcome! Dig into this week's DataFam Roundup—a weekly blog that brings together community content all in one post. As always, we invite you to send us your content—and the DataFam content from your peers that have inspired you! Find the content submission form here.
Community Highlight
To recognize new and consistent Tableau contributors—we’re excited to have a section within the weekly DataFam Roundup called the Tableau Community Highlight. Find out how to get involved.
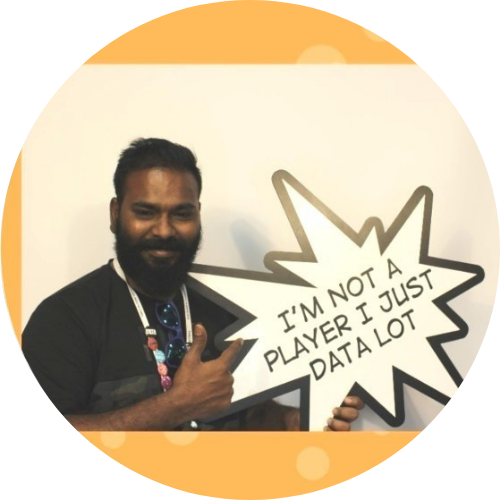
Tharashasank Davuluru, Director at UBS
Bangalore, India
Tharashasank, a Director at UBS, has been deeply involved with Tableau since discovering it during his Master's program in 2010. Initially drawn to its intuitive nature, he self-taught through Tableau and community learning resources, later refining his skills with expert-led sessions. Now, Tharashasank trains Tableau users, particularly university students and early career professionals in India and the US, training over 350 individuals from 2012 to 2025. He engages with the Tableau community through LinkedIn and Facebook groups, offering troubleshooting for Tableau Server issues, especially concerning automation, governance, and infrastructure.
Beyond his professional and community involvement, Tharashasank runs "Data, Chai, and Dialogue," a platform for discussing data, tech, personal growth, and decision-making. Inspired by a desire to encourage reflection in a fast-paced tech world, the initiative fosters insight-driven dialogue. Tharashasank also shares his Tableau knowledge through university workshops, LinkedIn articles, and community support, emphasizing storytelling and hands-on scenarios for effective learning.
Connect with Tharashasank on Linkedin and Tableau Public.
DataFam Content
- Frederic Fery: VizIt Sydney 2025: A Celebration of Community, Curiosity & Connection
- Kim Tricker: Conditional Formatting for a Single Measure Value in Tableau (inspired by Mahfooj Khan)
- Ray Givler: I Moved 11 Tableau Workbooks from a Teradata Data Source to BigQuery
- Tharashasank Davuluru: BANs: Why They Belong on Every Dashboard
- Nicole Klassen: Design Delights: Fun with Borders
- Dawn Harrington: How to Build a Variance Bar Chart
- Steve Adams: The Dashboard Compass
- Johan de Groot: Abbreviate Long Text in Tableau
- Deepak Holla:
Team Tableau Content
- Tableau Next June 2025 New Capabilities
- Tableau 2025.2 is Now Available
- 2025 Tableau Ambassador Nominations and Applications are Open
Visualizations
Louise Le: The Data Games
See the latest Viz of the Day, trending vizzes, featured authors, and more on Tableau Public.
Check out some inspirational vizzes created by the community:
-
Kim Tricker: Conditional Formatting for a Single Measure Value
-
Jeff Komen: Super Rugby 2025
-
Jordan Bullington-Miller: 2025 Reading Progress
-
Pooja Deshmukh: Cyclistic: Navigating Bike-Share Success
Community Projects
Back 2 Viz Basics
A bi-weekly project helping those who are newer in the community and just starting out with Tableau. Not limited just to newbies!
Web: Back 2 Viz Basics
X: #B2VB
Workout Wednesday
Build your skills with a weekly challenge to re-create an interactive data visualization.
Web: Workout Wednesday
X: #WOW2022
Preppin' Data
A weekly challenge to help you learn to prepare data and use Tableau Prep.
Web: Preppin’ Data
X: #PreppinData
Makeover Monday
Create business dashboards using provided data sets for various industries and departments.
Web: Makeover Monday
X: #MakeoverMonday
Data ChangeMakers
Volunteer to design data visualizations that help nonprofits harness the power of data for social change.
Web: Data ChangeMakers
Visual Climate
Collaborate and share climate data.
Web: Visual Climate
X: #VisualClimate
DataFam Con
A monthly challenge covering pop culture and fandoms.
Web: DataFam Con
X: #DataFamCon
EduVizzers
A monthly project connecting real education data with real people.
Web: Eduvizzers
Games Night Viz
A monthly project focusing on using data from your favorite games.
Web: Games Nights Viz
X: #GamesNightViz
Iron Quest
Practice data sourcing, preparation, and visualization skills in a themed monthly challenge.
Web: Iron Quest
X: #IronQuest
Storytelling with Data
Practice data visualization and storytelling skills by participating in monthly challenges and exercises.
Web: Storytelling with Data
X: #SWDChallenge
Project Health Viz
Uncover new stories by visualizing healthcare data sets provided each month.
Web: Project Health Viz
X: #ProjectHealthViz
Diversity in Data
An initiative centered around diversity, equity & awareness by visualizing provided datasets each month.
Web: Diversity in Data
X: #DiversityinData
Sports Viz Sunday
Create and share data visualizations using rich, sports-themed data sets in a monthly challenge.
Web: Sports Viz Sunday
X: #SportsVizSunday
Real World Fake Data
Create business dashboards using provided data sets for various industries and departments.
Web: Real World Fake Data
X: #RWFD
Data Plus Music
A monthly project visualizing the data behind the music we love!
Web: Data Plus Music
X: #DataPlusMusicCommunity Projects
Related Stories

DataFam Roundup June 2026

Tableau Ambassador Nominations and Applications are Open
 June 10, 2026
