Level up your finance analytics skills with resources from TC19


It’s no secret: Finance teams are falling in love with modern analytics. Developing data analytics skills is the top priority for finance teams, according to a 2019 Grant Thornton survey. Whether data analytics skills are on your CFO’s wish list or are one of your New Year’s resolutions, the Tableau Community has the resources to help you succeed. We saw the power of our finance community in person at Tableau Conference 2019, with the most attendees from finance organizations and more finance analytics presentations ever at TC. The Finance Analytics Cabana in Data Village was flooded with finance professionals looking to meet their peers, gain inspiration, and learn best practices.
Hot topics covered in the office of finance meetup and customer presentations from Charles Schwab, Bristol-Myers Squibb, Eide Bailly, among others, included preparing financial data for analysis, reducing manual processes in financial reporting, assessing and controlling risk, and improving operational efficiency.
Whether you went to TC and want to bring back some rich content for your finance team or you are just learning how Tableau transforms finance departments, this article is for you. We’ll provide a brief recap of six presentations, surface some of the key learnings, share a link to the session—and its related recording, if available, and help you decide which presentations you should spend your time watching (or re-watching). Let’s dive in.
Risk management and audit
Jason Eisman, Sr. Manager at Charles Schwab, discussed internal control testing in his session, “Charles Schwab: Tableau for Corporate Risk Management and How We Run Our Tableau User Group.” As their risk management function continues to grow, Jason led a project to solve for manual Excel file reviews, lengthy time to insight for the business, and manual point-in-time updates. He shared how he structured this project, managed it, and its phenomenal results:
- Tested over 1,000 controls across 53 different business units within the firm
- The results showed a return on investment of over 20 times the cost of licensing and a time savings of 8,000 hours in a six-month period.
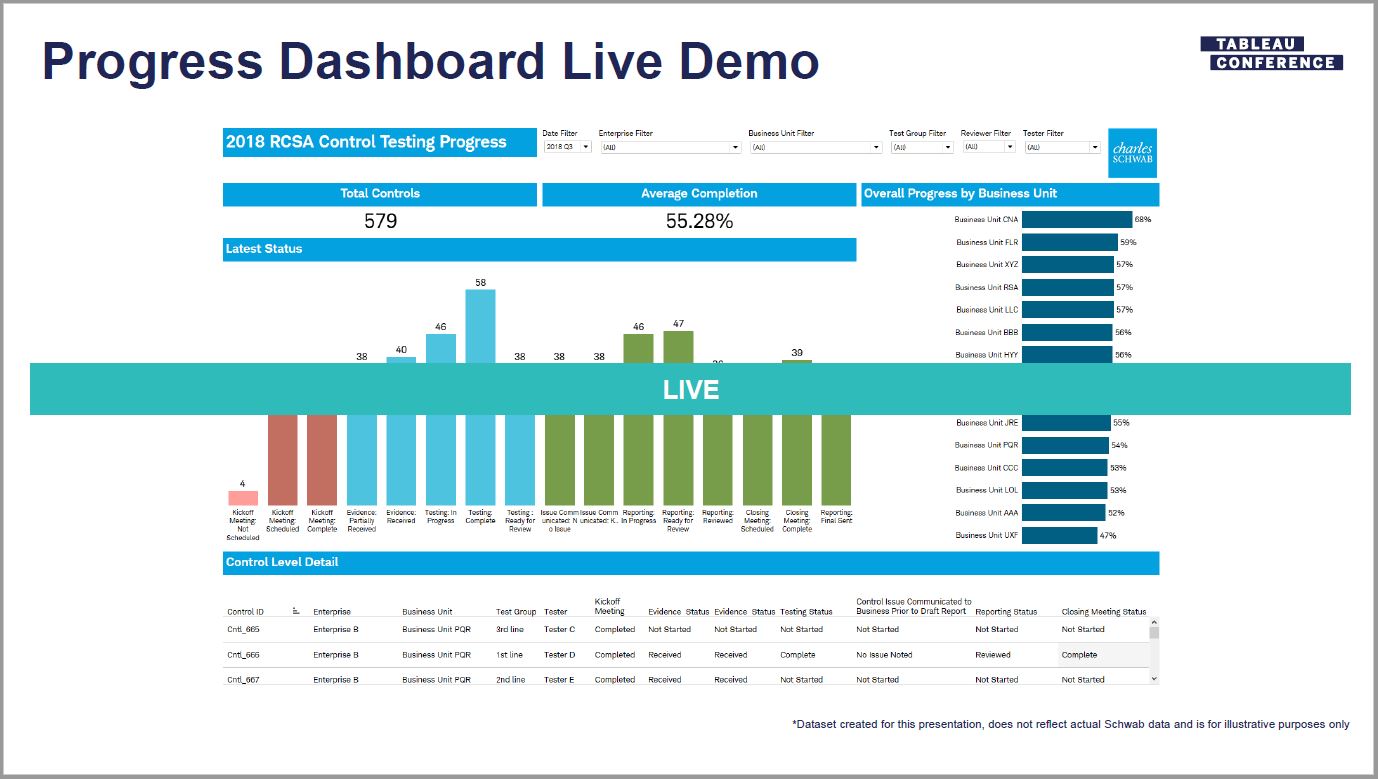
Figure 1: Sample progress dashboard reflecting the status of controls and their levels of detail for the Charles Schwab risk management department.
In his “Analyze, Visualize, Comply: Analytics for Managing Risk” session, Gordon Roland of KPMG offered compelling methods for making your risk management team a valuable asset and strategic partner. Gordon outlined how building an analytics suite is akin to building a house, sharing a framework focused on finding opportunities, taking action, delivering value, and deploying in an iterative way. His session hit on the following:
- The benefits of analytics to a risk management function
- How technology necessitates analytics to accurately monitor risk
- Example dashboards
- How to drive cost efficiencies with effective Tableau deployments
- How to address changes in methodology, giving a roadmap for deployment
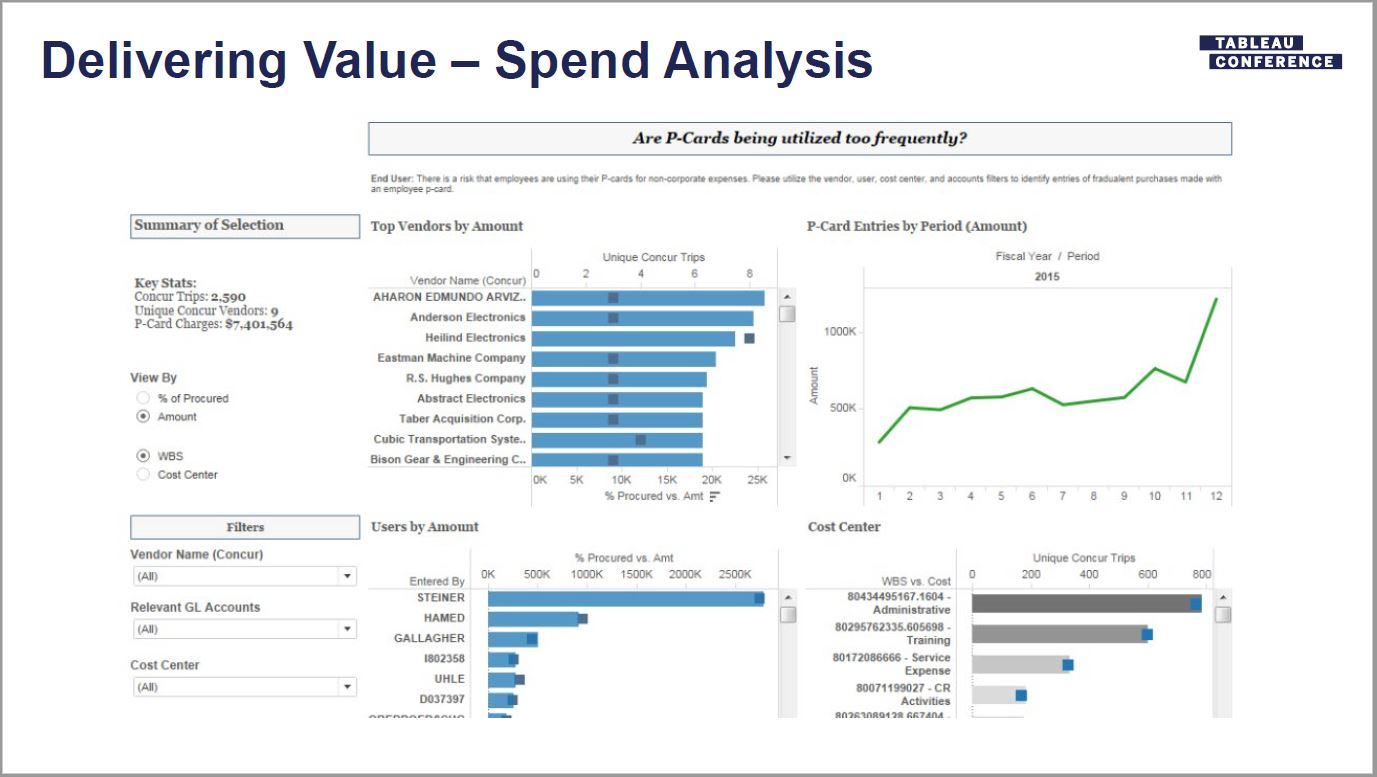
Figure 2: KPMG sample dashboard featuring spend analysis of purchase card (P-card) usage to deliver value as a risk management function.
Data strategy and digital transformation for finance leaders
Taking an executive view on organizational data strategy, Jon Daniels, Manager of Data Science & Analytics at Eide Bailly, shared four use cases of customers in various stages of digital transformation in his session, “A CFO’s Playbook for Running on Data.” Jon addressed technical and practical steps to transition from an on-premises solution into the cloud, examining what an ideal full-stack, data analytics strategy looks like. View Jon’s session to better understand what decisions you are making that may or may not be data-driven.

Figure 3: What Eide Bailly considers to be an ideal full-stack, data analytics strategy.
Financial operations
If you’re looking to dig into operational finance dashboards, this is the session for you. Amanda Haas-Latib, Operational Excellence Manager for O2C (Order-to-Cash) Operations at Bristol-Myers Squibb, presented on how the company uses Tableau to analyze large financial data sets to drive operational efficiencies and enhance customer experiences, including examples from inventory analysis, accounts receivables, brand metrics, product returns, short-dated sales, and financial adjustments. Amanda’s session, “Bristol-Myers Squibb: O2C Americas Achieving Operational Excellence Using Tableau” finishes by sharing a framework for building metric-driven organizations so that you can replicate their success.
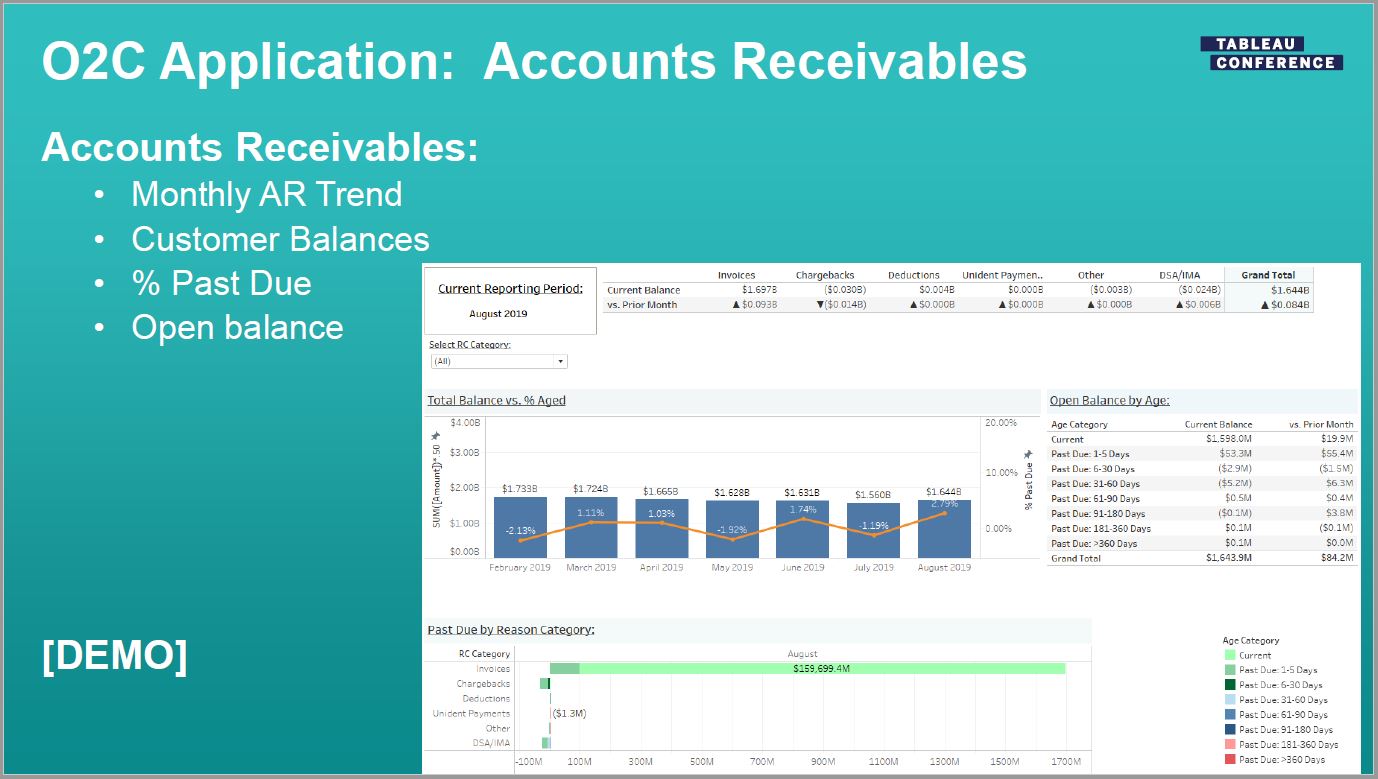
Figure 4: The various considerations for report automation in the O2C (order-to-cash) Operation at Bristol-Myers Squibb.
Financial data preparation
My colleagues on the Tableau finance analytics team tackled the problem of manual financial data preparation in their hands-on training session, “Becoming a Building Block Master: Financial Data Prep.” Mike Crook, Kaylee Walker, and Dan Liang showed attendees how to use Prep Builder, Desktop, and other technologies to quickly clean, enrich, and shape data, taking them through four exercises to:
- Build a reconciliation and validation prep flow to take extracts from different platforms and compare populations. This is a powerful approach to financial data validation during financial system upgrades or changes as well as when your financial data is replicated across multiple platforms.
- Build amortization and depreciation schedules to model revenue recognition and fixed asset depreciation and replace manual, complex Excel formulas.
- Build a department hierarchy data prep flow to flatten hierarchies, making the parent/child structure of the data more analytics friendly. Doing this enables you to better leverage the hierarchy feature in Tableau Desktop.
- Build a ForecastMaster data prep flow by unioning actuals with budgets and forecasts. Doing so generates a single source for variance and profit & loss (P&L) analysis. Our own Financial Planning & Analysis team loves having a consistent, common data source to surface business insights throughout our company.

Figure 5: A preview of the Tableau Prep flow created by Dan Liang for flattening department hierarchies.
Revenue and pricing analytics
I also had the opportunity to speak TC19! As a Senior Manager of Financial Planning & Analysis at Tableau, I shared how we visualize and analyze our pricing with sales data, diving into the methodology and process Tableau applied to tackle the shift to a subscription pricing model and role-based offerings. In my “Revenue and Pricing Analytics” session, I covered the typical pricing lifecycle at Tableau, diving into ways pricing impacts customer lifetime value. From here, I went on to explain why analyzing historical sales data and variability in pricing or discounting matters. After illustrating how we get our sales data into Tableau for analysis, I demonstrated how to analyze historical sales data with the discounting analysis dashboard shared below. I also did a few step-by-step walkthroughs of using handy Tableau features along the way so that you can leverage them in your own visualizations.
If you’re interested in further reading on this topic, check out my blog post for more tips on how you can manage revenue models with modern pricing analytics.
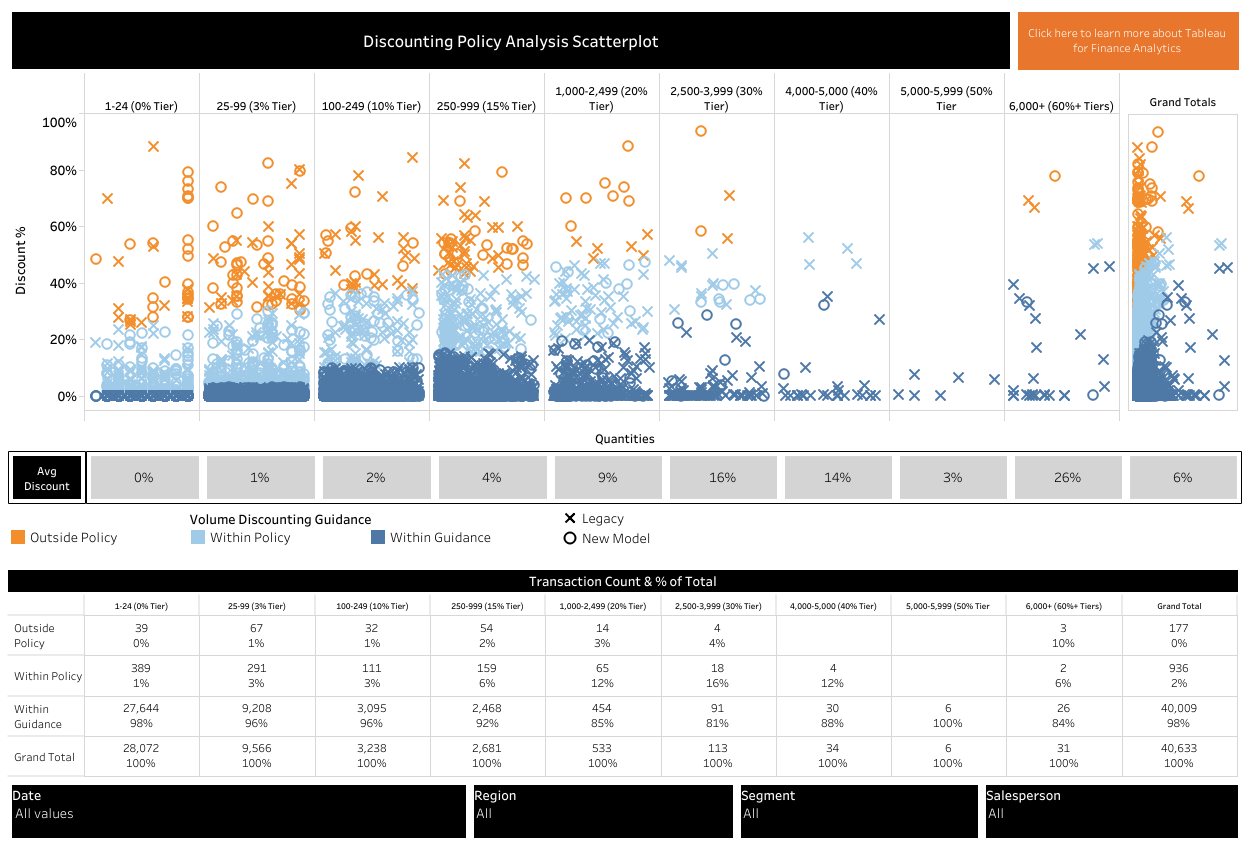
Figure 6: This discounting policy analysis scatterplot helps identify outliers and trends in your company’s use of discounts relative to its policies.
Apply the tips shared by these finance experts at Tableau Conference to your financial data preparation, pricing analysis, and risk management functions to improve your operational efficiencies, whether at quarter end, year end, or throughout your fiscal year. For more resources and inspiration for your financial analysis and reporting, check out the Finance Analytics solutions page.
Related Stories

VizQL Data Service from Tableau: Use Your Data, Your Way
 August 8, 2024

When and How to Use Multi-fact Relationships in Tableau
 August 1, 2024

Top data books of 2021
 December 12, 2021