Now available in Tableau: Dashboard extensions, a new TSM experience, spatial joins, and so much more


The newest release of Tableau is here! In Tableau 2018.2, there’s a variety of exciting features, including the ability to personalize your Tableau experience to fit your workflow with dashboard extensions, administer Tableau Server easily from the browser with Tableau Services Manager, join data sources based on geospatial data with spatial join, and use new dashboard formatting tools to make your dashboards even more beautiful.
Here’s a closer look at some of the biggest features.
Integrate Tableau with other applications with Dashboard Extensions
Dashboard extensions are dashboard zones that enable new functionality and integration with related applications directly in Tableau. With extensions, you can bring in new capabilities like custom visualizations, data-driven parameters, or even write-back to a database. Extensions also enable integration of Tableau with other business applications, so you can access the analytical tools you need from one place. For example, bring fields from your inventory management system right into your dashboard. If your analysis shows a growing customer demand for a new item you sell, you can then increase the quantity of that item needed for next quarter, all without leaving your workflow.
Developers and partners can build new functionality and integrations using the Extensions API, and the possible use cases are endless. Any author can add an extension to their dashboard in Tableau Desktop or Web Authoring and everyone in your organization can interact with dashboards containing extensions. As dashboard extensions are published to Tableau Server or Tableau Online, site administrators have full control of which extensions are allowed to run.
Adding an extension to a dashboard is easy. Just drag from the Objects pane and drop in your dashboard. Then select an extension downloaded as a local file that you or someone in your organization has created.
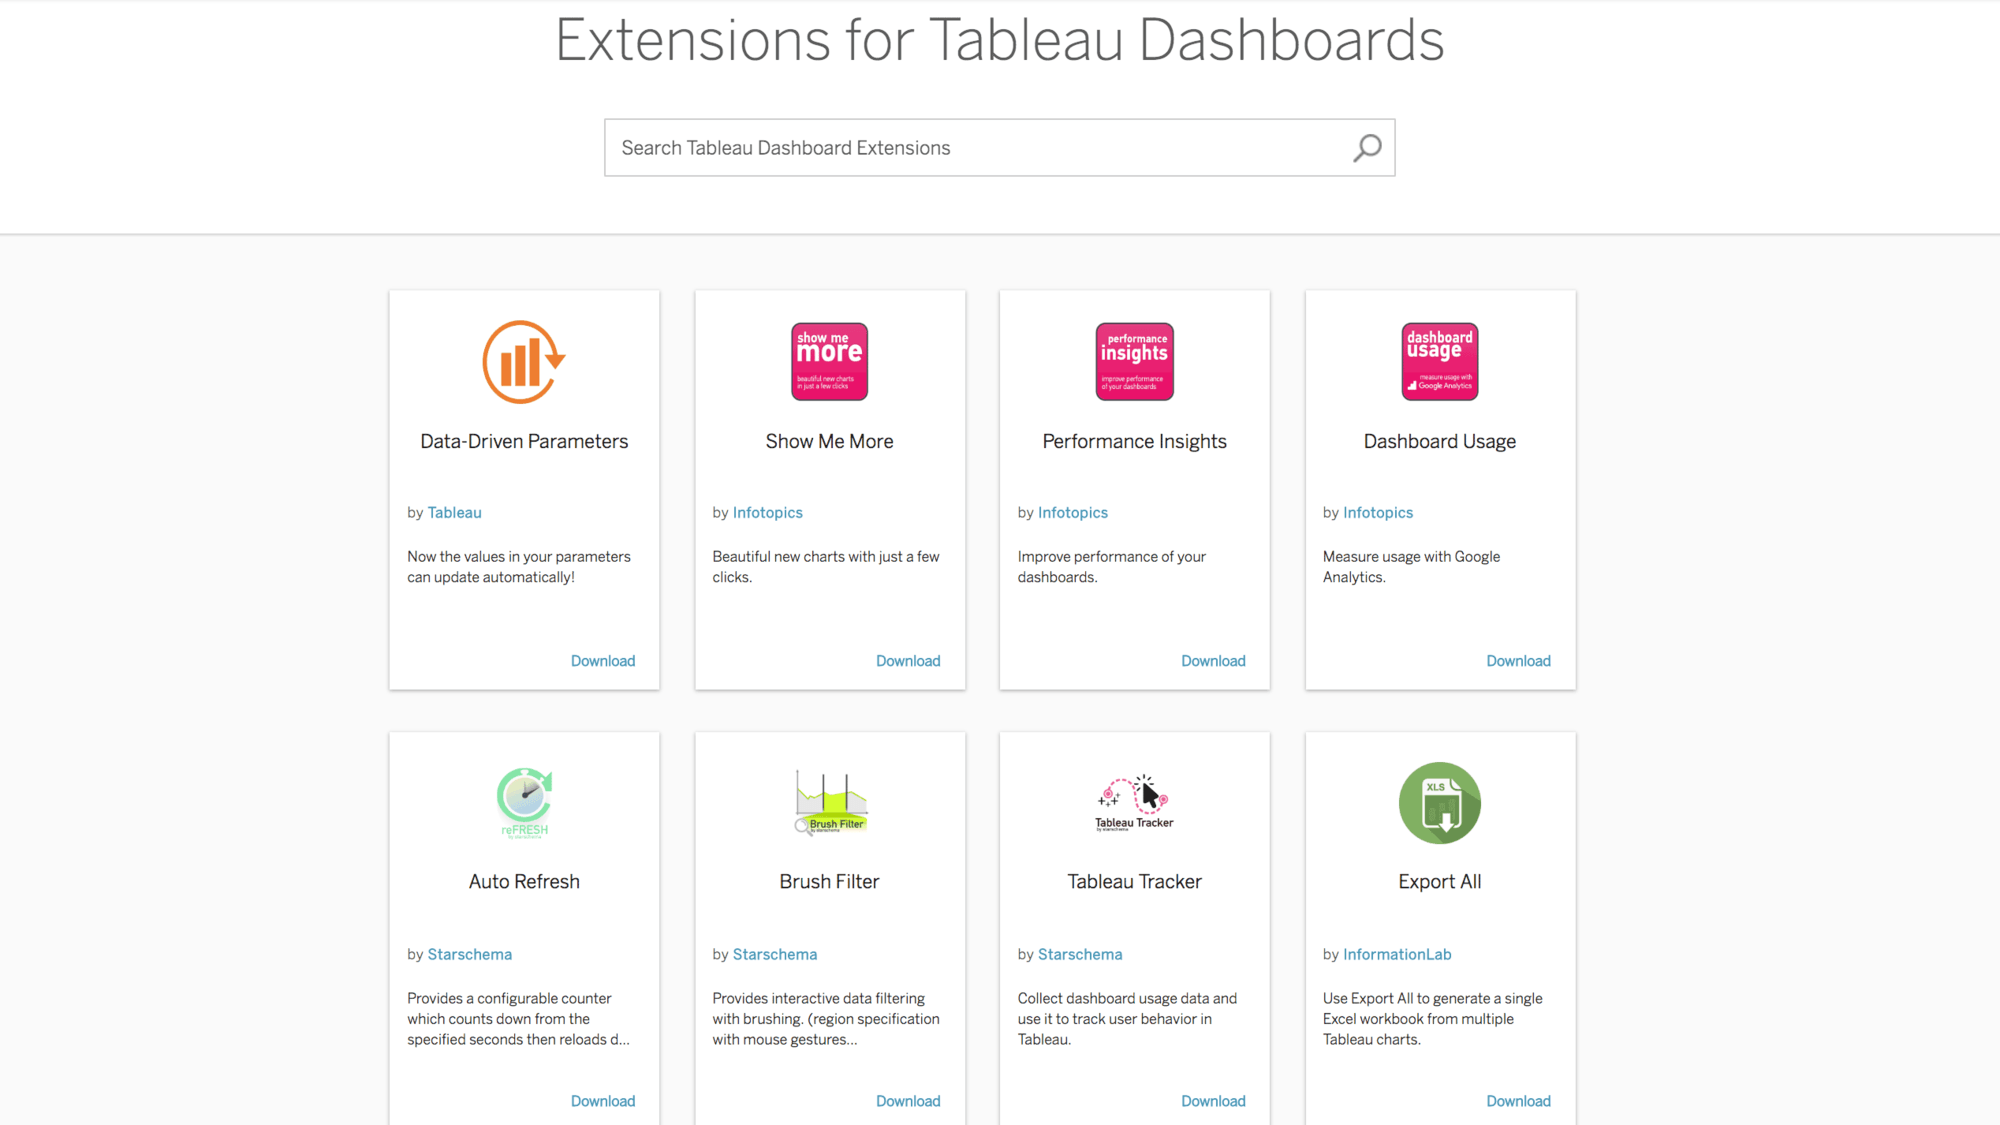
Or download extensions built by one of our technology partners available in Tableau’s new Tableau Exchange, now in beta. There's dozens of extensions to choose from—including natural language generation capabilities and the ability to see metadata (source, applied calculation etc.) for each field used in a viz.
Server management on the web with Tableau Services Manager
Tableau Services Manager (TSM) is our new administrator tool for installing and configuring Tableau Server on both Windows and Linux platforms. TSM includes three ways to manage your Tableau Server deployment—a new web UI, command line interface (CLI), and Tableau Services Manager API. Authenticate, configure, and manage your server remotely from a browser instead of needing access to the machine through Remote Desktop or SSH. With the TSM CLI you can automate management tasks and configuration, including commands previously executed with tabadmin. For more information on migrating from tabadmin to TSM CLI, visit our documentation for Tableau Server on Linux and Windows.
TSM means Tableau admins have support for dynamic topology changes and benefit from less downtime associated with upgrades. Additionally, admins no longer need a dedicated backup primary machine. Check out our TSM blog to learn more, and join our webinar on Wednesday, August 22.
Analytics and formatting features requested by you!
Many of our most impactful feature requests come directly from members of our Tableau Community. And Tableau 2018.2 is no exception. This release includes several analytical capabilities and formatting options sourced from the Tableau Community Ideas forum.
Spatial join: One of these features is spatial join, allowing you to join your data in scenarios where the only common attribute is location. For example, say you are trying to figure out which neighborhoods order the most deliveries from your store. This data includes specific points (the delivery orders) and polygons (the neighborhood boundaries). With spatial join, you can join the data sets based on neighborhood to understand how many orders are coming from each area—giving you the right information you need for delivery planning.
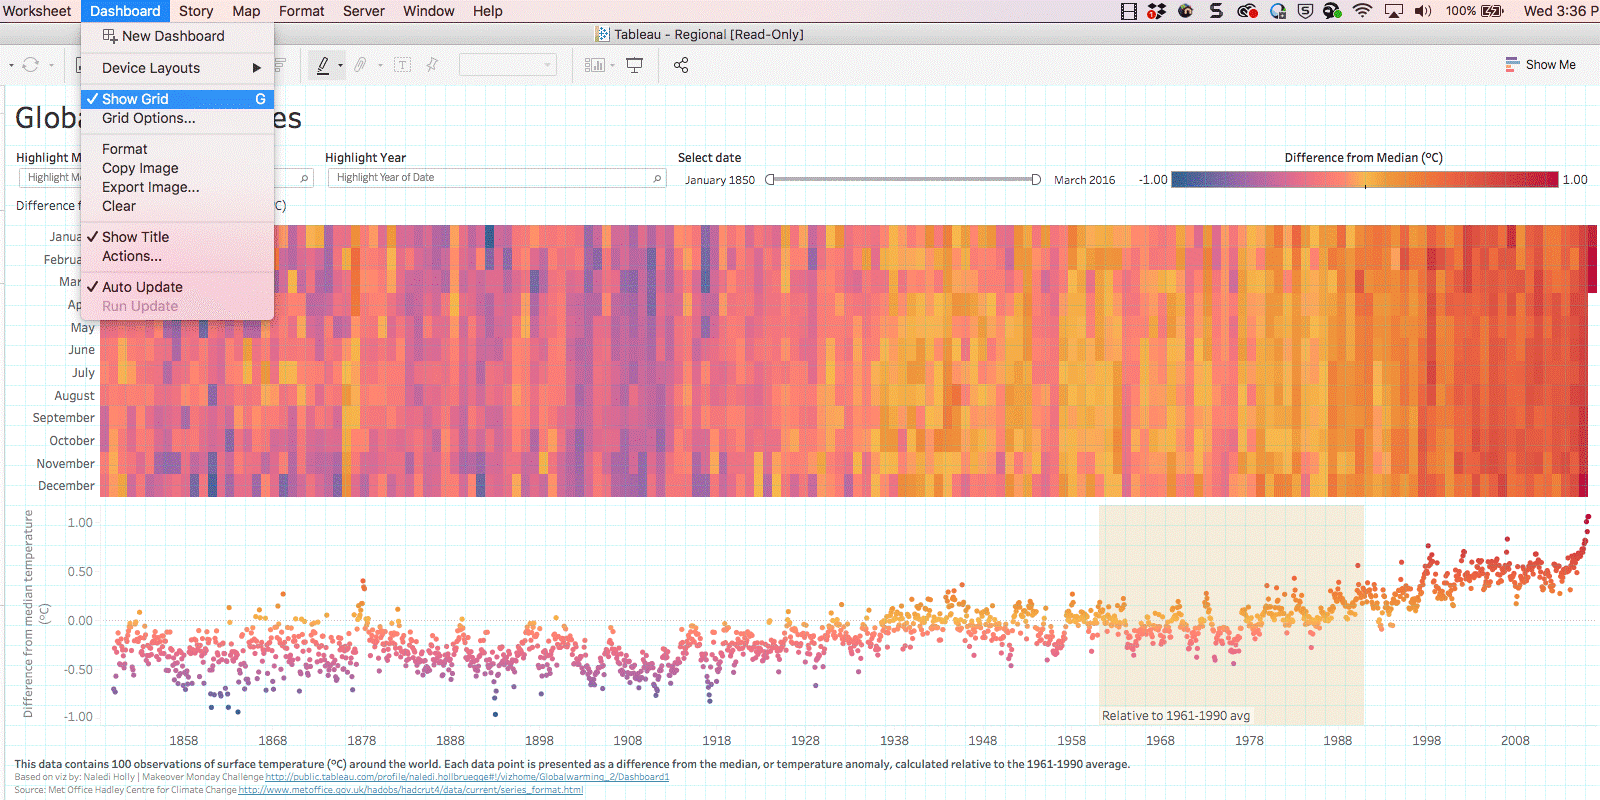
Dashboard formatting: Get even more precise control over your dashboard zones with new grid formatting features. One of these features is the ability to display grid lines underneath your dashboards to place elements exactly where you want them. Use keyboard arrows to move floating zones pixel by pixel. And use transparent filters, highlighters, and parameters to support color consistency across your dashboard.
Automatic mobile layouts: Device Designer now automatically creates mobile versions of your dashboard for phone and tablet based on mobile best practices. You can keep these layouts as is, or customize further to create the best mobile experience for your dashboard.
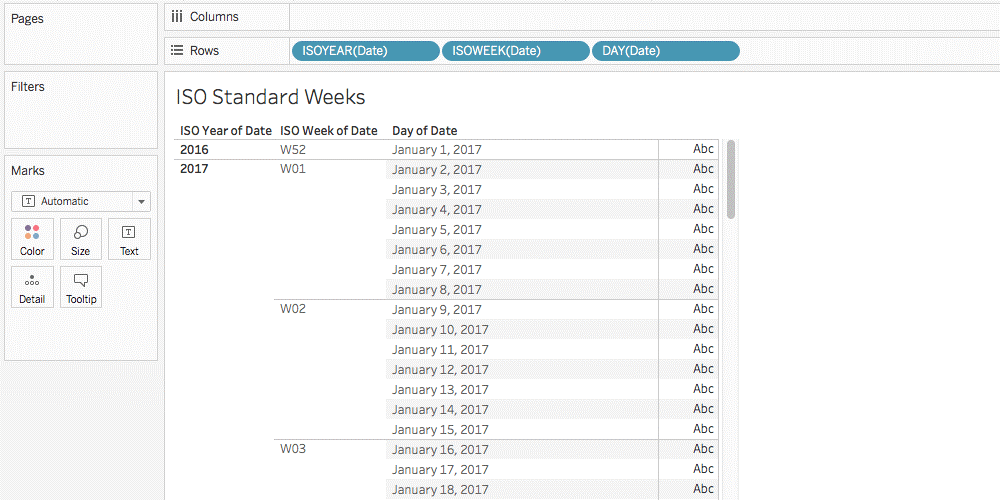
Analytics improvements: You can also now use ISO-8601 date parts in your calculations (find documentation here) and show values with very different magnitudes on the same scale with Negative Log Scale.
You’re the best, Tableau Community!
Check out the Ideas forum in the community to see all of the features that have been incorporated based on your feedback. And be sure to continue adding ideas to inspire our development team—we couldn’t do it without you!
We’d like to extend a huge thank you to the 16,000 beta testers who tried the Tableau 2018.2 beta. Your time and energy has made this release one of our best yet. Get the newest version of Tableau and if you’d like to be involved in future beta programs, sign up today.
Related Stories

Extend Access to Embedded Tableau Content with On-Demand Access
 July 22, 2026

The Tableau+ Bundle with Premium AI, Enterprise Capabilities, and Premier Success
 June 24, 2026

What is Tableau Prep?
 April 30, 2026