Why zulily created a self-service marketing analytics platform with Tableau and Google BigQuery


![]()
Editor’s note: Today’s post comes from Sasha Bartashnik, zulily’s Marketing Analytics Manager. zulily is a $1.6 billion fast-growing e-commerce company that launches 100+ new sales a day to surprise and delight women with the thrill of discovering new and unique finds. This is part one of a two-part series.
Every day zulily launches more than 9,000 product styles and 100 new sales, converting thousands of customers and processing millions of user actions. As a company with a customer first mindset, we’re always seeking to better understand our customers and optimize their experience. With so much data streaming in from internal and external sources, quickly accessing the data necessary to making marketing decisions was getting complicated and time-consuming for the average business user. As a result, analysts were spending more time writing code to answer ad hoc data requests than providing true actionable insights to drive the business. We needed to find a way to reduce the time it took to deliver the right message, at the right time, in the right channel, and to every customer.
In order to do this, we created a self-service marketing analytics platform which makes use of the Google BigQuery integration with Tableau. For the first time, this platform gave us a single view of data across various marketing touchpoints including Facebook Ads, Google Ads, and email, allowing us to blend data with in-house sources such as clickstream, product catalog, and order transactions to make faster and better business decisions. This platform has made BigQuery and Tableau our marketing analytics team’s bread and butter—our custom implementation of these two technologies allows us to quickly analyze complex data and make recommendations to drive strategic, real-time decision making. This post will give you guidance on how you can apply some of the same strategies in your organization.
Moving to a self-service data platform
In my job at zulily, I lead a team of analysts and data scientists to optimize our marketing strategy using data-driven insights. We work closely with a tech team that is made up of data and software engineers. This collaboration is one of the best aspects of working in Marketing Analytics at zulily: I get to work with a talented and creative tech team. Our tech team needs to focus on constantly building new features for an ultra-scalable consumer experience that handles millions of transactions a day, across a variety of platforms, as well as creating the infrastructure and tools used to manage our sophisticated vendor and marketing platforms. This means our tech team doesn’t have time to get bogged down in the mundane operational IT requests that are commonly found in traditional enterprise IT departments. Instead, our tech team builds tools that enable and empower us to do our jobs without being reliant on tech time and prioritization. An example of this is zuFlow, a query workflow and scheduling tool for BigQuery that lets analysts across zulily generate our own complex extract-transform-load (ETL) workflows using a point-and-click web interface.
Our tech team also shares my team’s vision of using data to drive every decision, at every level in the organization. This vision allows our teams to push innovative tools and techniques within zulily that expand the ways our company uses data. So in 2014, when our tech team realized that our existing data platform—a combination of SQL server for structured data and a Hadoop cluster for unstructured data—would soon be too limiting, they had the foresight to build a new big data platform. This platform uses BigQuery as the business data warehouse to provide a highly scalable analytics service and Tableau for data access and visual analytics so we can quickly make decisions based on the output.
In our new data platform, the process is reduced to the following:
- Push all data—structured and unstructured, real-time and batch—into BigQuery.
- Marketing analysts and data scientists join multiple data sources using BigQuery’s SQL.
- Develop models on BigQuery business data marts using a variety of common data science tools (Ex. Anaconda, RStudio, Google Cloud Datalab) across on-site and Google Cloud.
- Tableau is zulily’s reporting and visual analytics platform. Marketing analysts and data scientists use Tableau for self-service analytics on data stored in BigQuery as well as to report insights from the aforementioned models. This helps us make real-time decisions every day, and offers long-term strategic insights.
Enabling marketing decisions with self-service analytics
The integration of Tableau and BigQuery enables two key efficiency improvements due to the self-service model:
- Allows the analytics team to move fast on acquiring, ingesting, and using data to build reports and models without needing to involve IT in everyday activities.
- Provides business users with real-time access to key data used to make decisions quickly, without needing to involve analysts to generate basic insights.
Because all data lives in BigQuery tables, my team can query data of practically any size and at any level of granularity, or slice it to create features to feed our models as we wish. We can then further explore this data, and build reports and visualizations in Tableau to share data and models with end users. With Tableau, business users are also able to drill down to key metrics in order to understand the performance of all ads, programs, and channels.
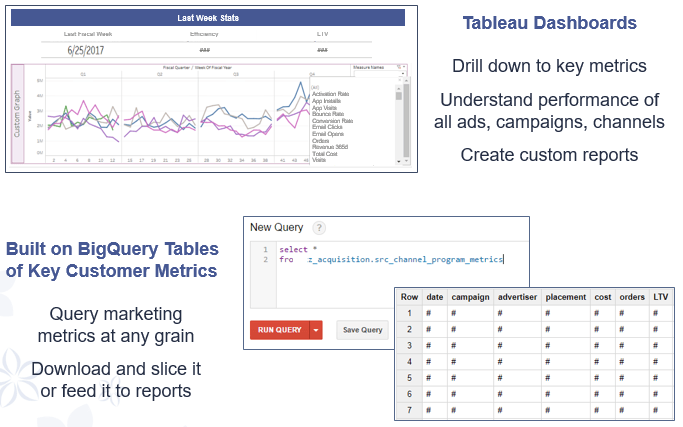
To achieve these two above efficiency improvements, the marketing analytics team needed to create a single and centralized view of the customer. First, we combine all the marketing data the tech team drops into BigQuery—including cost and click data for Facebook Ads, Google Ads, email sends, and all other customer marketing touchpoints. Then we tie it to clickstream, order transactions, and other metadata about customer actions at the customer and ad level using BigQuery SQL. Prior to BigQuery, combining such massive amounts of data was unreasonably time-intensive. Now, we get results within minutes or seconds, depending on the query. This speed enables the team to create a data model based on all aspects of customer behavior, including features like customer spend over time, frequency of engagement with email, and browsing habits on site. We can now tie this comprehensive customer data model back to the specific advertising and marketing campaigns that drives the customer behavior.
Unlocking customer acquisition insights with Google BigQuery and Tableau
With this self-service approach and customer model in place, not only is our tech team freed to focus on higher value items like building a robust system architecture for optimizing ads in real-time, but marketing analytics also has the opportunity to go deeper in areas that are key to understanding our business. Since Tableau lets our business users ask and answer many of their own questions, or make their own data manipulations, our team is relieved of the daily back and forth of report updates or simple data change requests. Now, we can use the zulily data platform for developing advanced machine learning models that help the business drive customer acquisition and better understand the customer experience.
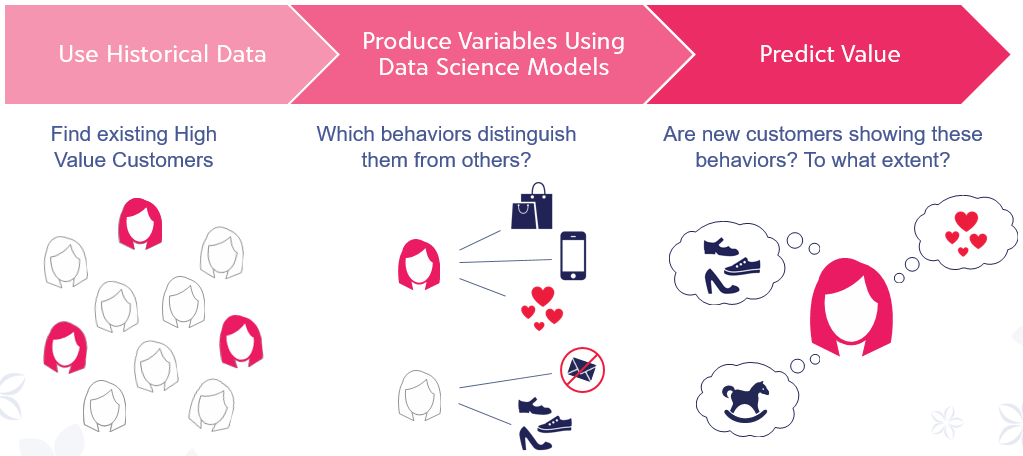
With all of zulily’s data now in BigQuery, we are able to build a robust machine learning model to predict customer lifetime value (LTV) using a variety of customer behaviors as inputs and tie the results to specific marketing campaigns to measure long-term performance.
To accomplish this, we assign a historical lifetime value to find existing high value customers. We then use gradient boosting to consider over 1,000 transactional and behavioral variables and test hundreds of models. We eventually reduce to around 30 key features that are contributing factors for predicting the lifetime value of a customer.
The end result is a model that can predict with very high accuracy the likelihood that a new zulily shopper will have a high lifetime value. We are then able to tie these predictions to marketing datasets living in BigQuery and provide the combined marketing performance data in highly dynamic and customizable dashboards, internally dubbed the Channel Metrics Dashboard (CMD), on our Tableau server. The CMD allows marketing channel manager and specialists to easily generate their own insights using historical and predicted data by selecting the metrics, date ranges, and even granularity they need by creating custom graphs and reports right on the server. This solution enables the zulily marketing team to quickly make decisions that optimize ads, emails, and offers towards customers who best respond to zulily engagements.
When we moved over to this new data platform, we had a lot of help and support from both our zulily tech team as well as Google Cloud engineers and Tableau customer engineers.
In part two of this series, this combined team will share tips and tricks about integrating BiqQuery with Tableau—stay tuned!
Related Stories

VizQL Data Service from Tableau: Use Your Data, Your Way
 August 8, 2024

When and How to Use Multi-fact Relationships in Tableau
 August 1, 2024

Top data books of 2021
 December 12, 2021