DIY website analytics dashboards for marketers at TC17


UPDATE:
Thanks to everyone who attended the TC17 session "Advanced Website Analytics". You were a wonderful audience and we appreciate all of you. Thanks for the excellent questions and all of the feedback.
If you didn't get to make it to Tableau Conference, you can still hear the audio and get the slides from our presentation.
As promised, we're following up our session with a blog series that will help walk you through your journey of creating your own website analytics dashboards in Tableau.
Skip to New Content
---
Are you a marketer that’s tired of creating reports in excel? Do you get annoyed every time you pull data from multiple platforms to create website traffic reports? Two of Tableau’s own marketers have created a next-level website analytics dashboard, with custom traffic metrics, to make reporting a breeze—and they want to share it with you at TC17 in their breakout session, Tableau on Tableau: Advanced Website Analytics.
Here’s a quick overview of the upcoming session, where you’ll learn how to improve website traffic reporting, and uncover hidden website data.
Addressing disparate data in website analytics reporting
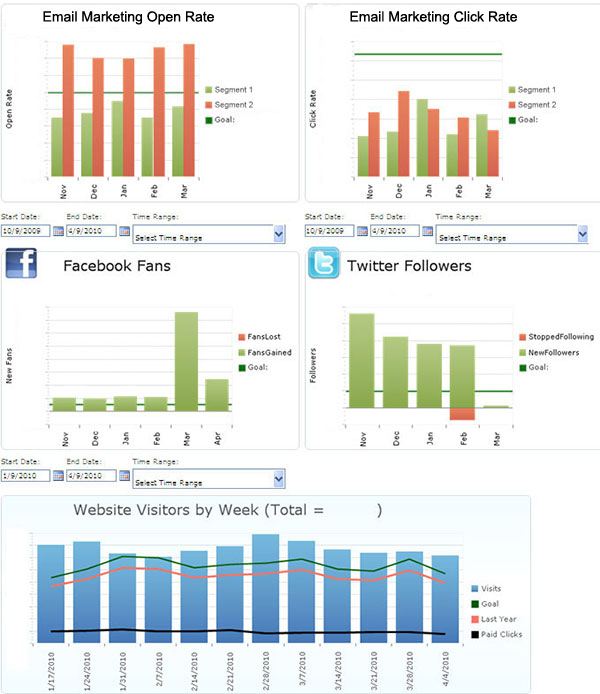
Most website analytics reports start with Google Analytics or your web analytics software of choice. But of course, all of the data you need for your report isn’t there. That’s when you start appending; perhaps relying on a spreadsheet to see the data side by side (or your report might even be in excel). You might incorporate search console data, or Adwords data. If you’re part of a marketing department with a more advanced approach to website traffic analysis, you might see some third party tool data in there as well. Moz? Buzzsumo? I wouldn’t be surprised.
Be honest, how many of you are doing your reporting in excel?
There’s also internal data that often isn’t being leveraged (website databases, Salesforce, or Eloqua). While that data can fill in the gaps for a better understanding of your website’s health, it also complicates reporting. So how do you report effectively when you have so much data? We’ve got answers. Attend the session to discover the data you aren’t using, how to combine multiple data sources, and how to represent it all in a dashboard that serves everyone in your reporting hierarchy from individual contributors to CMOs.
Why using Tableau helps to solve the siloed website analytics problem
There’s no shortage of reports telling us that siloing in the marketing department is hurting marketing efforts, and preventing marketers from fully seeing and understanding their audiences. But what few marketing departments realize is that their website data is often siloed as well. Many companies' website analytics reports include social, paid search, display advertising, PR, and organic search traffic KPIs, but treat each of them like they’re separate channels. However, the reality is that each of these channels impacts the others.
Attend this breakout session to hear how Tableau is connecting data sources and creating website traffic dashboards that tell the full story to analysts, specialists, managers, directors and VPs—even CMOs, in just the right amount of detail.
How is this different from other website traffic analysis dashboards?
Most other website analytics dashboards (Think Google Analytics, for one) use hidden calculations to produce their visualizations. Most of the time that works just fine, but for some metrics (users or departments) the default calculation may not be suited to your needs. Tableau provides the flexibility to stitch together the most common data sources (and a few less-common data sources) to get to the real insights lurking within our website traffic and CMS’.
Some of the data sources we'll use:
- Google Analytics
- ScreamingFrog Web Crawler
- Search consoles. All of them.
- No, ALL of them
- Baidu, Bing, Naver, So.com, etc.
- Drupal database
- Majestic backlink tool
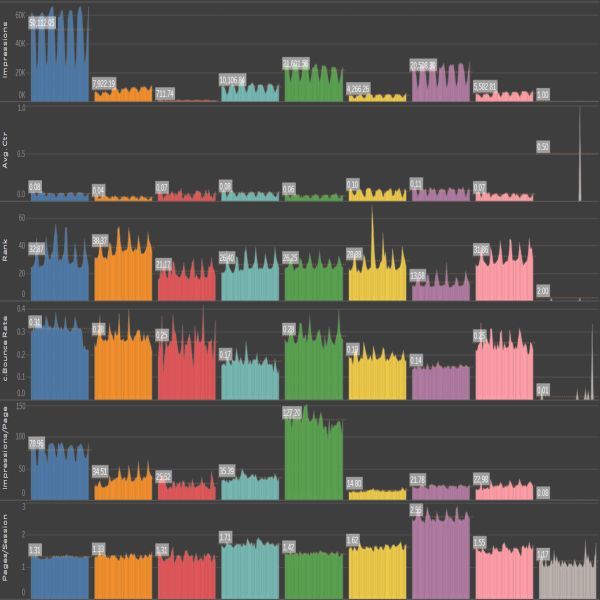
This session will go beyond data sources themselves. You’ll learn some new tricks for measuring website traffic health and content performance. You’ll see our method for creating a custom website analytics health metric that combines separate measures into a single score, allowing you to condense the space needed for reporting and expediting the time it takes to ingest and digest the report at higher levels.
Who is this breakout session for?
This breakout session is for web marketers: content managers, content marketers, SEOs, webmasters, PPC analysts, email marketers, and anyone in the marketing department whose work touches their website. If you rely on website analytics for your data, then this is for you.
Additionally, this session takes into account the different levels of responsibility within your organization. Managers, directors, VPs, and more can learn about the benefits of an integrated reporting platform as well as how they can help drive similar projects in their organizations.
Stay tuned...
To enable our TC attendees as much as possible, we’ll be publishing a DIY Website Analytics Cookbook, so you can create similar reporting platforms on your own. We’ll publish follow-up blog posts addressing questions from the session as well. If you need more specific information regarding calculations, builds, and data sources, we’ll be posting all of that information here soon, so stay tuned!
Bookmark this page for updates and links to additional content.
New Post:
Build Your Own Advanced Web Analytics Dashboard With These Resources
Related Stories

VizQL Data Service: Extend Your Data Beyond Visualizations
 March 19, 2025

VizQL Data Service from Tableau: Use Your Data, Your Way
 August 8, 2024

When and How to Use Multi-fact Relationships in Tableau
 August 1, 2024