Arby’s forecasts retail success in Tableau, leading to 5x more renovations in a year
5x more remodels backed by weekly sales data
Automated 6-hour FP&A reporting process
Deeper customer insights with guest experience data
Arby’s Restaurant Group is the franchisor of the well-loved American, fast-casual brand. Arby’s used Tableau to map customer behavior using point-of-sale data, discovering that remodeling locations led to increased sales. With this knowledge, Arby’s executed five times more remodels within a year. Automating the Financial Planning and Analysis group’s 6-hour reporting process in Tableau helped operations track promotion success and spot issues, impacting field responses and saving money.
We produced the Tableau dashboard, we put it out in the field, and the directors in the field made the changes. We're seeing operations actually make changes because they're able to see the data and see what was going on.
Tableau mapping reveals increased sales—leading to 5x more remodels
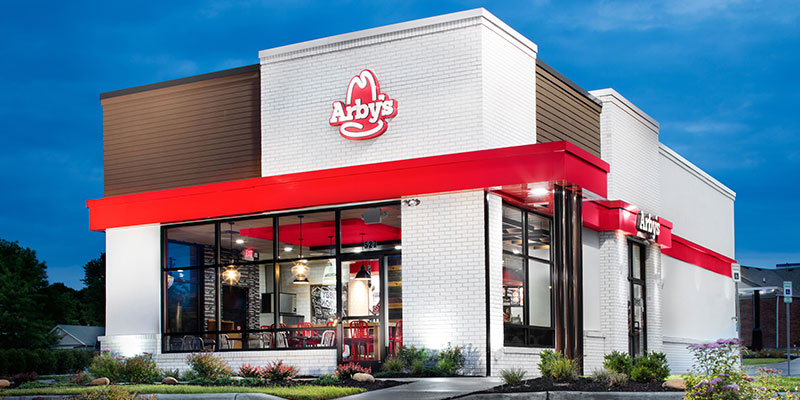
When Arby’s Restaurant Group was renovating their chain of restaurants, they faced some questions. What happens to the customers when a restaurant closes for renovation? Where do they go? And do they come back when the restaurant reopens?
Mapping point of sale (POS) data in Tableau, the Business Intelligence team monitored the flow of customers to nearby locations during renovation periods, tracking remodel progress by week and overall return on investment.
“In the remodel, we plotted the stores, their latitude and longitude, on a map in Tableau. We would animate it over time, and as a store closed for remodel, you would see sales grow for the stores around it,” said Karl Riddett, Manager of Business Intelligence and Analytics.
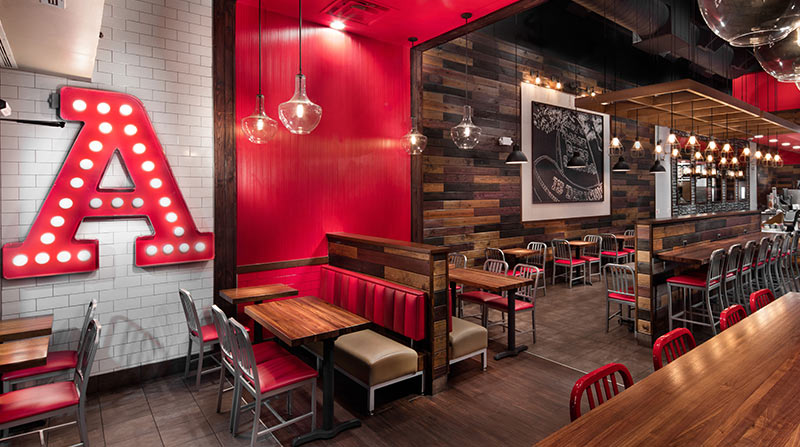
When the restaurants reopened, they saw customers flocking to renovated stores, proving that a fresh look attracted more business.
“The remodel dashboard specifically allows our CFO and VP of Finance and development officers to see how well the remodels are performing,” said Karl. “The data showed that we need to spend more money remodeling our restaurants, freshening up the look. That it really has helped the business.”
Based on this knowledge, Arby’s executed five times the amount of remodels within a year and continued this effort throughout the following year.


The data showed that we need to spend more money remodeling our restaurants, freshening up the look. That it really has helped the business.
Operations team spots and resolves campaign issue with Tableau
In addition to remodels, the team uses Tableau to correlate evaluation data and qualitative scores. For example, Arby’s combines point-of-sale and guest experience data to understand whether customers have had a positive brand experience—and to predict if a customer is likely to return to the store, use a coupon, etc.
Arby’s used this quantitative data to track the success of their “Give a Dollar” charity promotion where a customer would give a dollar and get a $2 coupon in return.
Karl recalled, “Our controller came to me and said, "Hey, could you see what we can do with Tableau because we're seeing some funny things with the data coming in." They could tell something wasn't right, but they didn't know what it was.”
With Tableau, the team could spot the issue, take action, and distribute the data to the field to make the necessary changes.
“We produced the dashboard, we put it out in the field, and the directors in the field made changes. And you could see that we got the issue corrected. So we're seeing operations actually make changes because they're able to see the data and see what was going on.”
“There was a real financial impact that saved the company some money and saved our foundation some money as well.”
There was a real financial impact that saved the company some money and saved our foundation some money as well.
FP&A team eliminates 6-hour reporting process and better forecasts sales
After seeing the success of the remodel dashboard, Arby’s Financial Planning & Analysis (FP&A) team approached the analytics team about their six-hour Excel reporting process.
With Tableau, the FP&A team eliminated the six-hour process and gained deeper insight into finance data. For example, the team can now track how remodeled restaurants impact existing restaurant sales—enabling accurate forecasting and data-driven decision making around franchise planning.
Breaking down silos with one source of truth
These Tableau projects inspired Arby’s to create an analytics committee, which meets monthly to discuss the vision for future analytics efforts.
The committee encourages departments to explore Tableau Server to source inspiration for new dashboards. These efforts increased collaboration between teams and created one centralized repository for accurate data, which didn’t exist before Tableau.
“It gives one place for people to go to and see what's going on. We didn't have that before at Arby's. I think the real ROI that we're seeing is with certain people being able to really fully express themselves and what they want to do in their role and answer questions.”