Do you want to learn more about data visualization theory and history? Do you want to be inspired by examples of awe-inspiring visualizations? Do you want to be able to create more effective visualizations? Or are you interested in absorbing every bit of information from authorities on data visualization? These are all great topics and knowing more about the topic will improve your use of Tableau. As a part of our Data Visualization Field Guide, here is a list of books we have read and found extremely useful over the last few years. This is far from a definitive list, of course—there are many many more.
An earlier version of this article was written on the Tableau Blog by Andy Cotgreave.
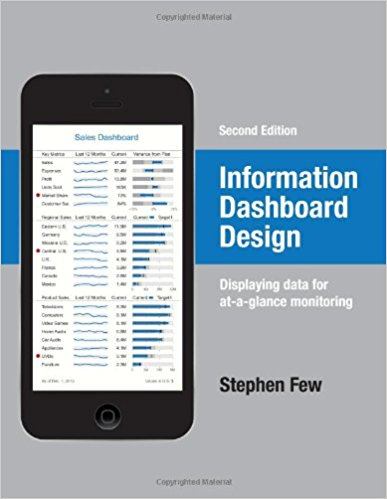
1. "Information Dashboard Design: Displaying Data for At-a-glance Monitoring” by Stephen Few
Author: Stephen Few
Website: Perceptual Edge | Amazon
This is a fantastic resource packed full of examples of good and bad dashboards. In explaining how to create great dashboards, Stephen Few also gives a great introduction to the principles of the theory of data visualization and design. We would also recommend any of Stephen Few's other books, but this one is the most accessible.
This book focuses less on data visualization itself and more on leveraging visualization techniques to your advantage in order to efficiently and critically monitor data at a glance. Dashboards are a common way to keep track of multiple sets of data, and Few’s goal is to help make sure dashboards aren’t unwieldy and inefficient, as they often can be. In this book, he points out common mistakes with dashboard design, as well as best practices to avoid falling into those traps.
2. "Beautiful Visualization, Looking at Data Through the Eyes of Experts by Julie Steele, Noah Iliinsky"
Authors: Julie Steele, Noah Iliinsky
Website: O’Reilly Media | Amazon
Steele and Iliinsky’s book is a look into the thought process and design behind real-world examples of data visualization projects. 24 experts weigh in on their methods, approach, and perspectives in designing data visualization for their respective fields. "Beautiful Visualization” explores storytelling with data, communicating through visual indicators such as color, and research methods to put it all together.
This book describes the design and development of some well-known visualizations. It's a great way to learn how others approach visual design. A particular insight is that every single author points out that collecting and cleaning their data is the hardest part of any project. It is heartening to know that this is a pain point for even the best analysts!
3. "The Accidental Analyst: Show Your Data Who’s Boss” by Eileen and Stephen McDaniel
Authors: Eileen McDaniel, Stephen McDaniel
Website: Freakalytics
Purchase: Amazon
This book is about what to do when you find yourself suddenly thrust into the world of analytics projects, even when you weren't trained as an analyst. Lots of business users find themselves in this position every day. We have access to data, but maybe our background is in sales, HR, editorial, or operations. This book provides a great template for breaking down any analytics project into distinct segments and delivering something successful and effective.
Whether you landed a new job as a data analyst or had the responsibility plopped on you unexpectedly, this book is great for anyone looking to start digging into data for results. "The Accidental Analyst” provides a step-by-step guide on how to decide what questions you want answered, collect the data, organize the information, display it through visual graphics, and communicate the results.
4. "The Functional Art” by Alberto Cairo

Author: Alberto Cairo
Website: The Functional Art
Alberto Cairo is a data journalist and teaches information graphics and visualization. What is great about this book is that it explains how important it is to stick as close to best-practices as possible but also ensure that your work is beautiful in order to engage the end user.
"Functional art” as a concept is something that serves a purpose while still retaining aesthetic qualities to be appealing and captivating. Cairo argues that this is the goal with data visualization as a whole. In this book, Cairo reviews the aesthetic qualities of data visualization and how to create good-looking pieces while still keeping within industry best practices. He focuses on using color and design to enhance the aesthetic and taking advantage of our brains’ quirks when perceiving and remembering information.
5. "The Visual Display of Quantitative Information” by Edward R.Tufte
Author: Edward R. Tufte
Website: Edward Tufte | Amazon
While Edward Tufte’s book was first published in 1983 and is beginning to show age, it covers the theory and design of data graphics and is illustrated with some of the best and worst examples. Now over 30 years old, it is still a great introduction to some timeless design theories and provides a historical context for data visualization. The book includes 250 illustrations of data visualization examples of statistical graphics along with detailed breakdown analysis.
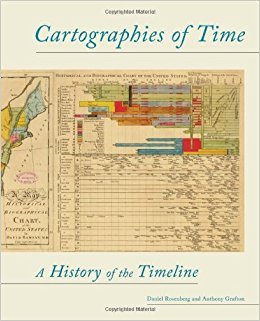
6. "Cartographies of Time: A History of the Timeline” by Daniel Rosenberg, Anthony Grafton
Authors: Daniel Rosenberg, Anthony Grafton
Website: Amazon
If you want to read up on the history of data visualization, this is a great book. It focuses on the development of visually representing time, which has been a significant endeavor. It is fascinating and reveals that the challenges we face today in data visualization are similar to those faced hundreds of years ago.
The study of data visualization may be more of a modern endeavor, but the challenges of representing information in visually accessible ways aren’t so different across history. From dashboards to ancient maps, we’ve been trying to display time-specific data for generations. "Cartographies of Time” presents a comprehensive account of western civilization’s attempts at visual timelines through the ages. The book covers graphic representations of time in Europe and North America for almost 600 years, complete with illustrations.
7. "Information Graphics” by Sandra Rendgen, Julius Wiedemann

Authors: Sandra Rendgen, Julius Wiedemann
Website: Amazon
This is a huge coffee table book. It has over 400 examples of information graphics from around the world, covering data visualization in journalism, government, education, business, and more. There are also some introductory essays on data visualization history and theory and data journalism.
"Information Graphics” fulfills the role of an almanac in data visualization. The first half features essays on historical context and practice. In the second half of the book, over 200 projects and 400 examples of information graphics from around the world in a variety of disciplines are presented, divided into chapters by location, time, category, and hierarchy.
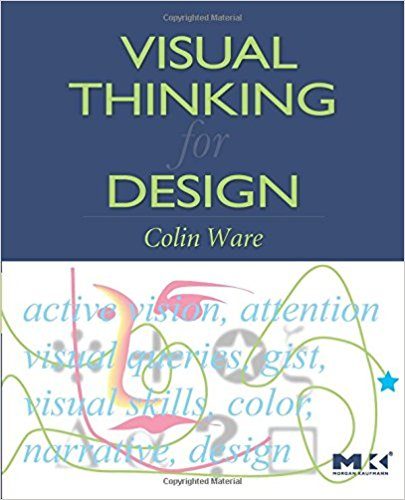
8. "Visual Thinking for Design” by Colin Ware
Author: Colin Ware
Website: Data Visualization Research Lab | Amazon
If you are interested in the science behind data visualization, this book is amazing. It's a great introduction to design and cognitive psychology. An understanding of this will make you a better visualization designer.
This book goes into the science and psychology behind design and how you can apply that to data visualization in order to communicate your message more effectively. It presents design as more of a tool, using specific techniques to take advantage of the brain’s process of perception and thinking. It includes hundreds of examples in text as well as visual full-color diagrams.
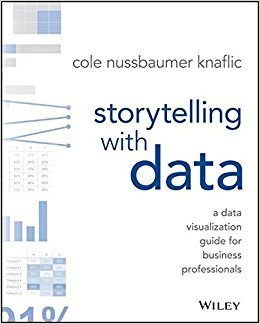
9. "Storytelling With Data: A Data Visualization Guide for Business Professionals” by Cole Nussbaumer Knaflic
Author: Cole Nussbaumer Knaflic
Website: Storytelling With Data
While a lot of data visualization books focus on the theory of the subject or the nitty-gritty how-to with using graphics in practice, this book focuses on the WHY: why we use visualization with data. Data itself is a tool and it’s up to us to craft the story with it. Much as writers strive to "show, don’t tell” with their text, "Storytelling With Data” emphasizes using visuals to convey the meaning of the data rather than hoping that the data will speak for itself. The book touches on honing the message of your data by choosing the right type of visual or graph, directing the reader’s attention, and how to effectively communicate using data.
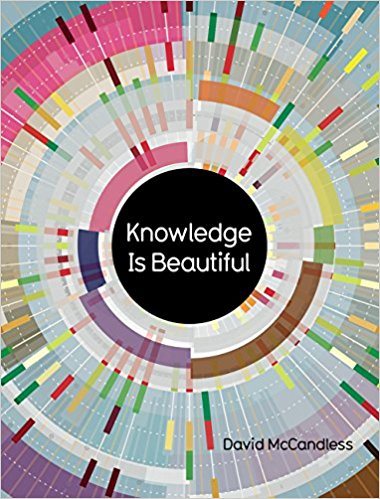
10. "Knowledge is Beautiful” by David McCandless
Author: David McCandless
Website: Information Is Beautiful
Written by the same author as the data visualization blog Information is Beautiful, "Knowledge is Beautiful” uses visuals to reveal the world. The book features infographics to present complex information, showing connections and relationships in visual displays. The book traverses data from art to science, from health to popular media, to show patterns and connections in our lives. From charting popular dog breeds to mapping out the exact relationships of the Middle East, this book will satisfy your curiosity itch.
11. "Visualize This: The Flowing Data Guide to Design, Visualization, and Statistics” by Nathan Yau
Author: Nathan Yau
Website: Flowing Data | Amazon
In this book, Nathan Yau provides practical tips and step-by-step tutorials to formulate data to tell a story. The book focuses mostly on statistical data with technical references and putting visualization into form through programming. "Visualize This” also features tools and software recommendations to design graphics for both the web and print, along with code examples for web programming like Python and JavaScript.
12. "The Big Book of Dashboards” by Steve Wexler, Jeffrey Shaffer, and Andy Cotgreave
Authors: Steve Wexler, Jeffrey Shaffer, and Andy Cotgreave
Website: Tableau | Amazon
If you need to look at a ton of dashboards for inspiration, look no further. "The Big Book of Dashboards” covers all sorts of dashboards for various industries and departments, using examples from healthcare, marketing, finance, customer service, sports, and others.
Real-world applications are the highlight here, covering the necessity of making sure your data is presentable whether you’re at your computer, presenting in a conference room, or on mobile on-the-go. As we saw with "Information Dashboard Design,” designing a dashboard is nearly as important as the data itself and "The Big Book of Dashboards” addresses practical and psychological factors you may run into before they even come up.