Using a Tornado Chart


Comparing the characteristics of one population is easy. But how about the same characteristics for two distinct groups? Enter the Tornado Chart, a special bar chart whose resulting image looks just like the natural phenomenon.
Tornado Charts excel at comparing the relative importance of a given variable. For example, males and females among different age groups in the population. Academic performance between children of low- and high-income families. Sales in two different regions.
In fact, one of our product consultants at Tableau was asked a question related to that:
"What is the number of sales in the east, versus the number of sales in the west, broken down by category. Please show the variability of this difference in a sorted Tornado Chart."
Here's their answer:
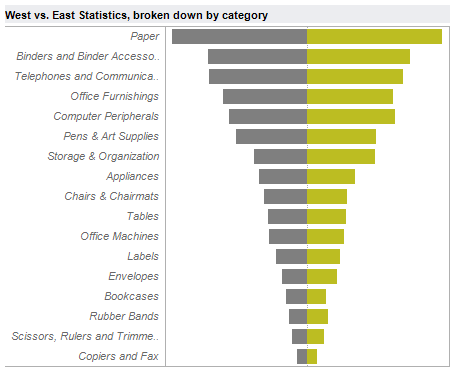
Why is this a valid Tableau Tornado Chart?
1. We count the number of sales events for the west, and do the same for the east.
2. For the east, we turn this number into a negative of that count.
3. We create a domain/range calc, which is simply the difference of these counts.
4. We then sort the categories by this domain/range amount.
With this chart we can discover just how important region is to the sales of a particular product. In this example, the answer is "not very."
If you would like to see and download the workbook that created the above chart, click here.