Viz Roundup: CO2 Emissions, Paris Attacks, & Premier League Injuries


As more people discover the power of visualizing data, we’re seeing more topical vizzes come online—and faster. This roundup includes vizzes on carbon emissions by country, Twitter's reaction to the attacks in Paris, and Premier League players' injuries. Handpicked from our Viz of the Day feed on Tableau Public, here is our latest viz roundup.
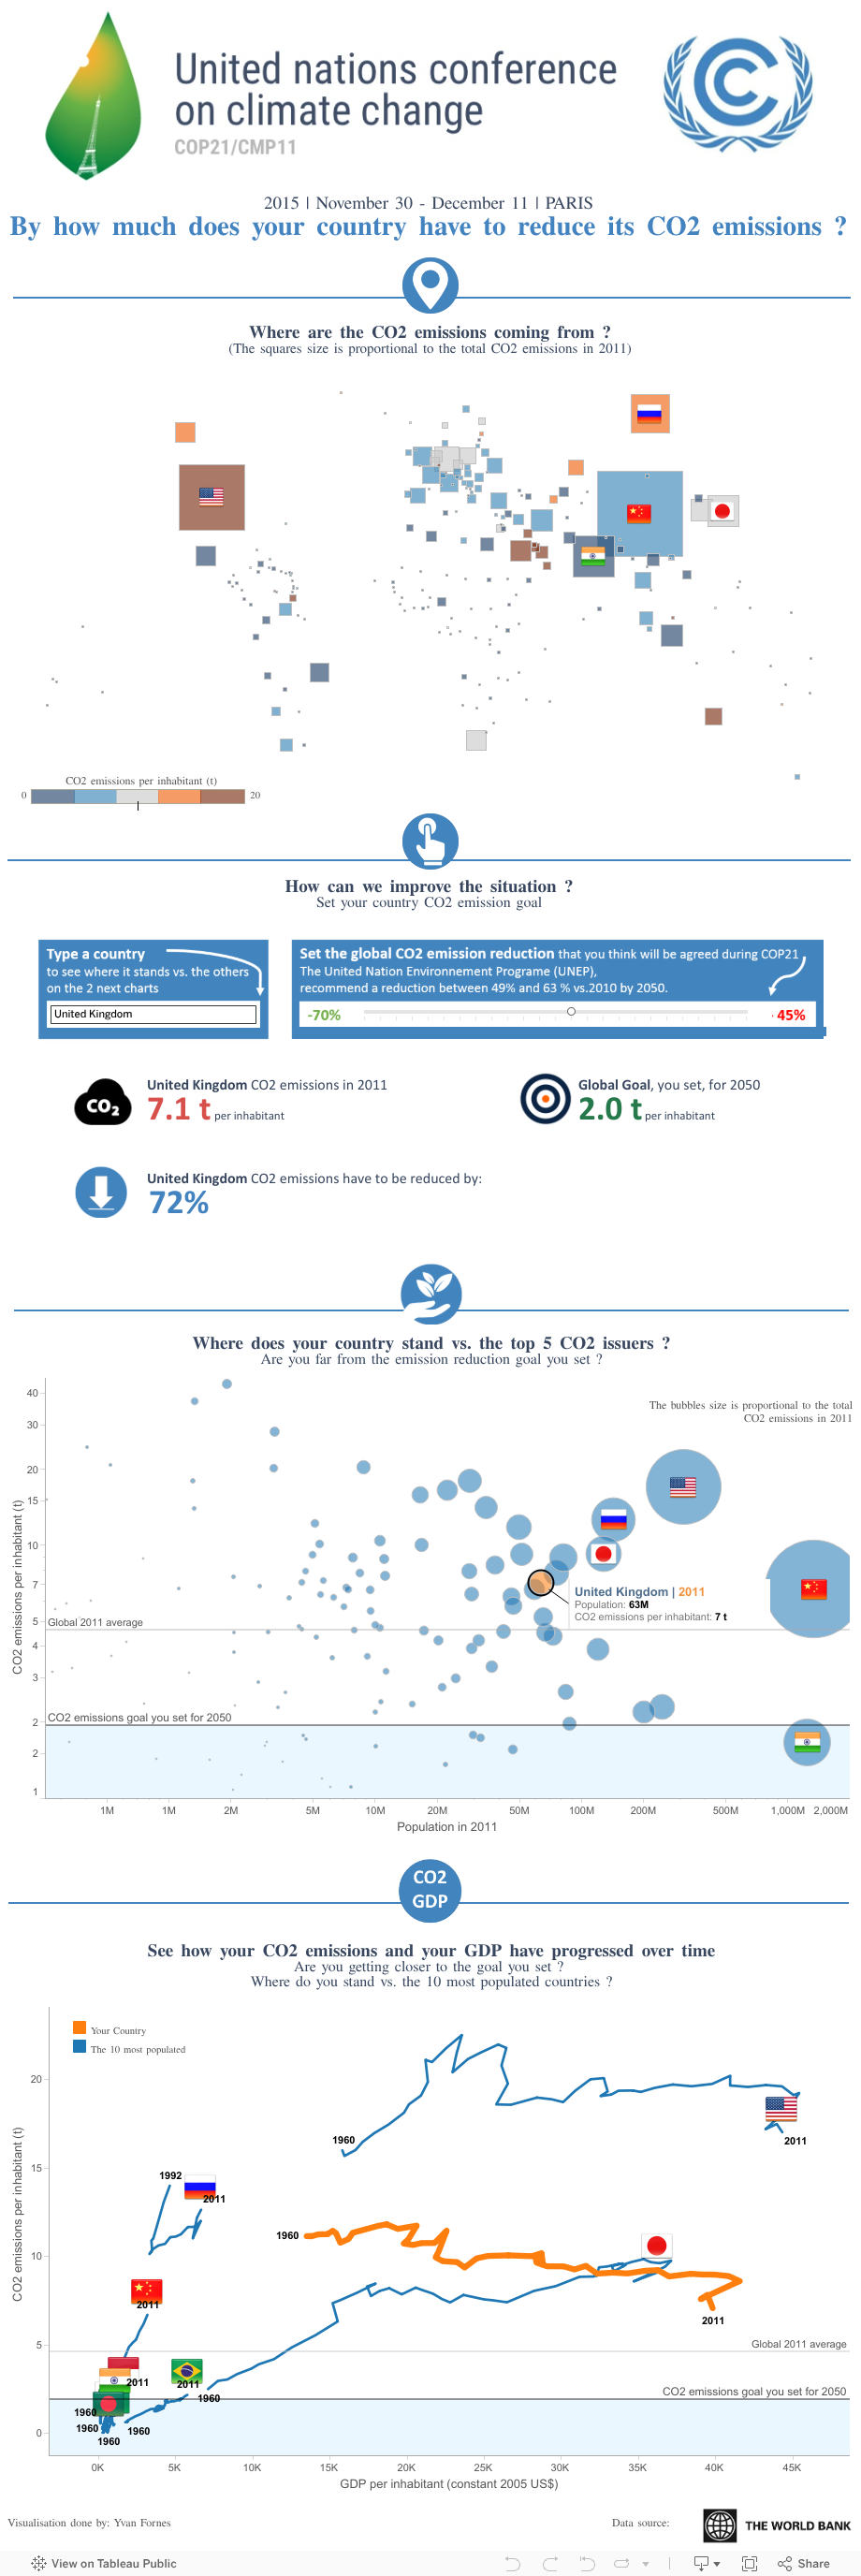
CO2 Emissions: Set Your Goal
In anticipation of the COP21, Yvan Fornes offered an overview of CO2 emissions per country. His target-setting tool lets you see how much each country would have to reduce individual CO2 emissions to meet the global goal by 2050.
Scroll down past the map and type in your country in the blue box. Set up your own global target for emissions reduction by moving the cursor to the left or right. If the viz is too long for your screen, you can visit the original on Tableau Public.
Variation in Hue across Movie Posters
Originally vizzed by Chris Love of the Information Lab, Steven Fenn of Stat Hunting remixed this visualization that shows which colors most frequently appear in movie posters.
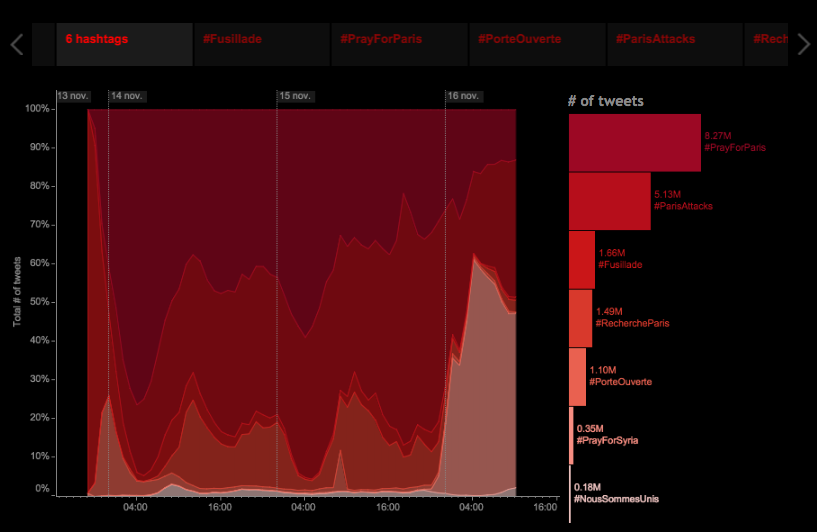
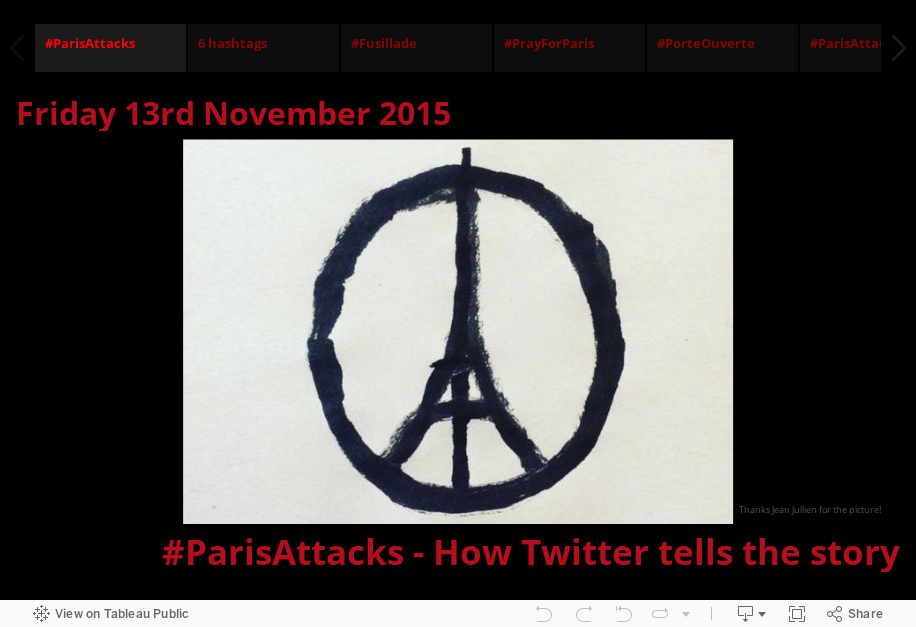
Twitter Reaction to Paris Attacks
In this data story, French author Jonathan Trajkovic used aggregated Twitter data to explore the conversations that followed the recent Paris attacks. (Jonathan also shared his thought process behind the viz.)
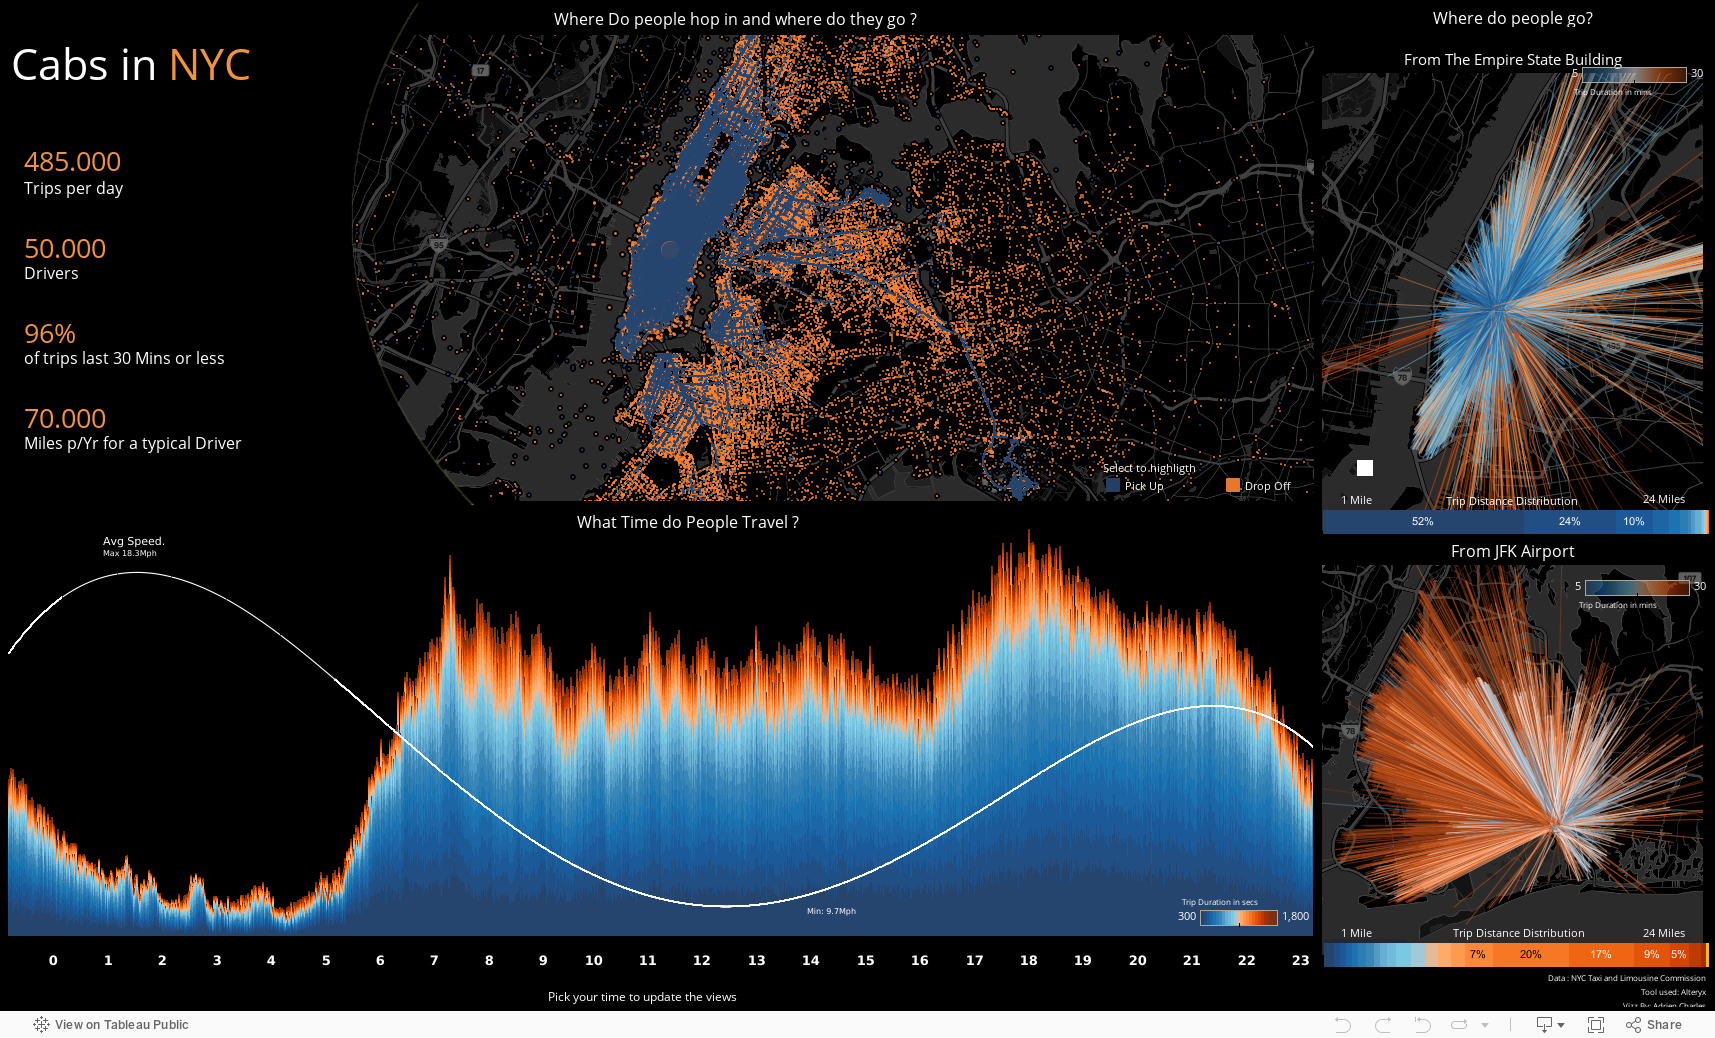
New York City Cabs
Ever wondered where people take cabs in New York City? Or how about peak travel times? Adrien Charles visualized taxi data in the Big Apple in this striking viz.

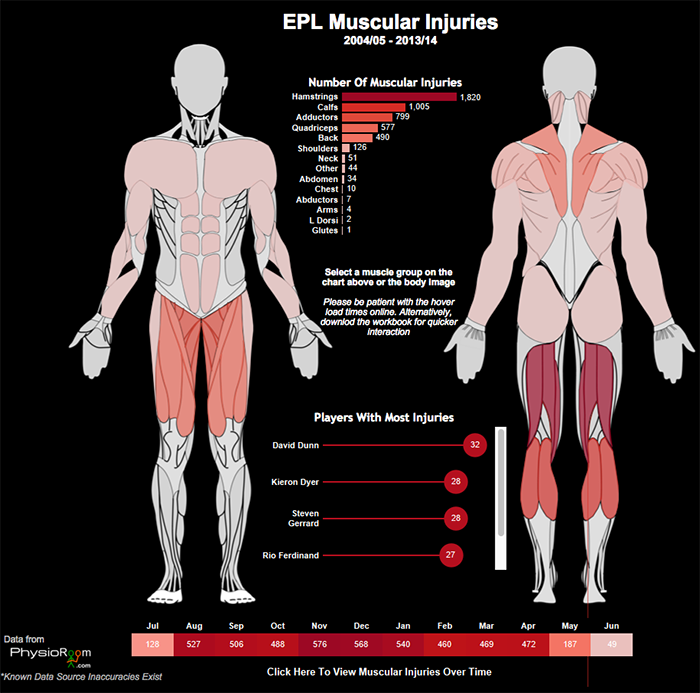
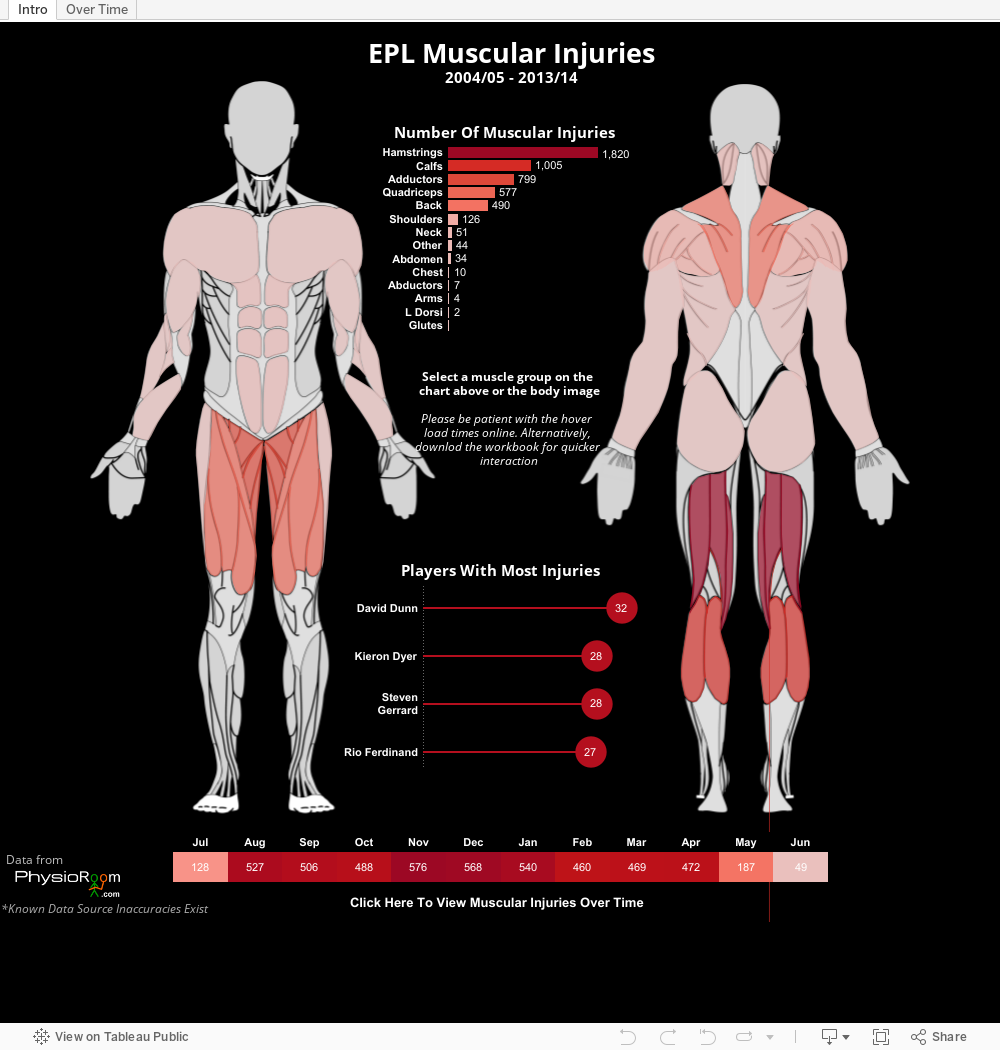
EPL Muscular Injuries
Brian Prestidge of the Information Lab really flexed his viz muscles in figuring out this novel use of custom polygons. He visualized Premier League muscular injuries from 2004 to 2014 using seasons data. With Brian's excellent use of highlighting, this viz couldn't be more clear or intuitive.
We hope you enjoyed this roundup. Of course, there were many more great vizzes than we had room for. To see a new, beautiful #VizOfTheDay every day, follow @tableaupublic on Twitter. We can't wait to see all the creativity 2016 will bring!