DataFam Roundup: May 26-30, 2025


Welcome! Dig into this week's DataFam Roundup—a weekly blog that brings together community content all in one post. As always, we invite you to send us your content—and the DataFam content from your peers that have inspired you! Find the content submission form here.
Community Highlight
To recognize new and consistent Tableau contributors—we’re excited to have a section within the weekly DataFam Roundup called the Tableau Community Highlight. Find out how to get involved.

Bj Price, Business Intelligence and Reporting Manager, Consumer Insight at The Walt Disney Company
Florida, USA
Bj began using Tableau in 2012 to visualize media mix modeling data. She learned the software primarily through instructor-led training and Tableau Conference hands-on sessions and keeps her skills current by attending Tableau User Groups and staying up to date on blogs and content put out by the DataFam. She appreciates the Tableau Community's willingness to share knowledge and has benefited from vizzes, blogs, and videos produced by the community. Bj’s favorite ways to be active in the community are attending Tableau User Groups and Chart Chat.
Inspiration for her Tableau Public vizzes comes from learning techniques from the DataFam, she has published over 15 vizzes exploring runDisney event race results data and, in addition to exploring other topics as well such as Basketball, the Tour de France, and other topics in popular culture. Bj shares her Tableau knowledge by leading a monthly Tableau Speaker Series at Disney and holding office hours to help users with their visualizations. Looking ahead, Bj is eager to connect with more DataFam members and share her expertise with the internal Tableau community at Disney.
Connect with Bj on Linkedin, X, and Tableau Public.
DataFam Content
Dive into content created by the Tableau Community:
-
Tharashasank Davuluru: What Newspapers Can Teach Us About Dashboard Design
-
Elaine Yuan and Dennis Kao: Explore data visualizations that celebrate Asian American and Pacific Islander Heritage Month
- Fi Gordon: Tableau Iron Viz Journey: Win or Learn, You Can't Lose with Kathryn McCrindle
-
Ojoswi Basu: Check out the Tableau DataFam Roundup
- Dawn Harrington: How Do You Compare?
- Johan de Groot: Show/Hide – but better
- Deepak Holla:
- Steve Adams: The Deli Dashboard Principle
Team Tableau Content
- Inside Track on Tableau Prep, Custom Themes and Tableau Semantics
Visualizations
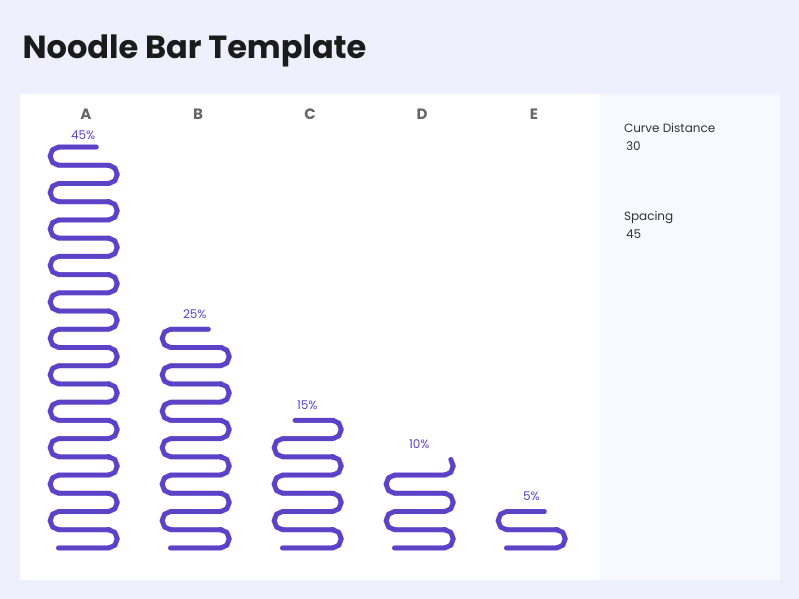
Lisa Trescott: Noodle Bar Template
See the latest Viz of the Day, trending vizzes, featured authors, and more on Tableau Public.
Check out some inspirational vizzes created by the community:
- Ellen Blackburn: TC25 Tips and Tricks
- Waqar Ahmed Shaik: Web Analytics Dashboard
- Neoris Spain: The Roland Garros Challenge
- Ojoswi Basu: NYC Taxi
- Shangruff Raina: How Do Men Prefer to Pee?
- Arshi Saleh: Sitz or Stand? How European Men Use the Toilet
Community Projects
Back 2 Viz Basics
A bi-weekly project helping those who are newer in the community and just starting out with Tableau. Not limited just to newbies!
Web: Back 2 Viz Basics
X: #B2VB
Workout Wednesday
Build your skills with a weekly challenge to re-create an interactive data visualization.
Web: Workout Wednesday
X: #WOW2022
Preppin' Data
A weekly challenge to help you learn to prepare data and use Tableau Prep.
Web: Preppin’ Data
X: #PreppinData
Makeover Monday
Create business dashboards using provided data sets for various industries and departments.
Web: Makeover Monday
X: #MakeoverMonday
Data ChangeMakers
Volunteer to design data visualizations that help nonprofits harness the power of data for social change.
Web: Data ChangeMakers
Visual Climate
Collaborate and share climate data.
Web: Visual Climate
X: #VisualClimate
DataFam Con
A monthly challenge covering pop culture and fandoms.
Web: DataFam Con
X: #DataFamCon
EduVizzers
A monthly project connecting real education data with real people.
Web: Eduvizzers
Games Night Viz
A monthly project focusing on using data from your favorite games.
Web: Games Nights Viz
X: #GamesNightViz
Iron Quest
Practice data sourcing, preparation, and visualization skills in a themed monthly challenge.
Web: Iron Quest
X: #IronQuest
Storytelling with Data
Practice data visualization and storytelling skills by participating in monthly challenges and exercises.
Web: Storytelling with Data
X: #SWDChallenge
Project Health Viz
Uncover new stories by visualizing healthcare data sets provided each month.
Web: Project Health Viz
X: #ProjectHealthViz
Diversity in Data
An initiative centered around diversity, equity & awareness by visualizing provided datasets each month.
Web: Diversity in Data
X: #DiversityinData
Sports Viz Sunday
Create and share data visualizations using rich, sports-themed data sets in a monthly challenge.
Web: Sports Viz Sunday
X: #SportsVizSunday
Real World Fake Data
Create business dashboards using provided data sets for various industries and departments.
Web: Real World Fake Data
X: #RWFD
Data Plus Music
A monthly project visualizing the data behind the music we love!
Web: Data Plus Music
X: #DataPlusMusic
Related Stories

DataFam Roundup June 2026
Tableau Ambassador Nominations and Applications are Open
 June 10, 2026
