DataFam Roundup: March 3-7, 2025


Welcome! Dig into this week's DataFam Roundup—a weekly blog that brings together community content all in one post. As always, we invite you to send us your content—and the DataFam content from your peers that have inspired you! Find the content submission form here.
Community Highlight
To recognize new and consistent Tableau contributors—we’re excited to have a section within the weekly DataFam Roundup called the Tableau Community Highlight. Find out how to get involved.

Imad Hamouchi, Analytics Engineer & DataViz Expert
Achères, France
Imad Hamouchi is an Analytics Engineer and data visualization expert. He began using Tableau when he found a gap at work in visualizing their data and needed a tool to turn raw data into meaningful insights. He discovered Tableau and was instantly drawn to its powerful capabilities, which led him to exploring further. Imad dove into hands-on projects but also learned Tableau through tutorials and resources created by the community such as blogs, community projects and challenges, and YouTube channels. Because he attributes much of his learning to community-created content, Imad was inspired to create his own YouTube channel in hopes of giving back and sharing his journey with others. He is also involved in the community by sharing his knowledge on Tableau Public and Linkedin.
On YouTube, Imad focuses on making complex topics more accessible, providing hands-on solutions to real-world data challenges, and helping others optimize their Tableau experience. In addition, he likes that not only does his YouTube channel give him the platform to create content, he is also able to connect with fellow data enthusiasts.
Connect with Imad on Linkedin, Tableau Public, and on his YouTube channel.
DataFam Content
Dive into content created by the Tableau Community:
- Adam Mico: The Future of Tableau-Centric Roles: What’s Next for Data Professionals in the Next Five Years
- Viraj Bhargave: Tableau Know the Calculation Editor
- Brittany Rosenau: Profile Organization in Tableau Public — How I’m Using the New Feature to Showcase My Data Viz Portfolio
- Nisar Ahmed: The Data Nerd Podcast: Inform. Educate. Entertain. Lessons from a Tableau Evangelist
- Blake Feiza: Tableau Map Layers Magic: Heatmap + Marginal Histograms
- Johan de Groot: Better Titles on Multiple Measure Panes
- Li-Lun Tu: 《Tableau 基礎》從數據小白到Tableau資料視覺化玩家 | 資料視覺化設計師的實務教學! | Ep.40
- Deepak Holla:
- Michael Markin: Your Dashboard is Live — Now What?
- Vizable Insights: Tableau performance tips and tricks – building efficient data sources
- Steve Adams: Unlocking The Secrets Of Effective Dashboard Building: Your Proven Process
- Yuri Fal: Tableau: Funnel: the Gathering
Team Tableau Content
- We’re excited to announce the launch of Manual Categorization as part of the second ship point for the Profile Organization feature on Tableau Public! This update allows you to have full control over how you present your work by creating, managing, and organizing your own categories, ensuring your profile reflects your unique expertise and style. This feature is available for users who have 10 or more vizzes published to their Tableau Public profile page. To get started organizing your vizzes, log in now!
- Inside Track on Tableau Conference 2025
Upcoming events and community participation
Visualizations
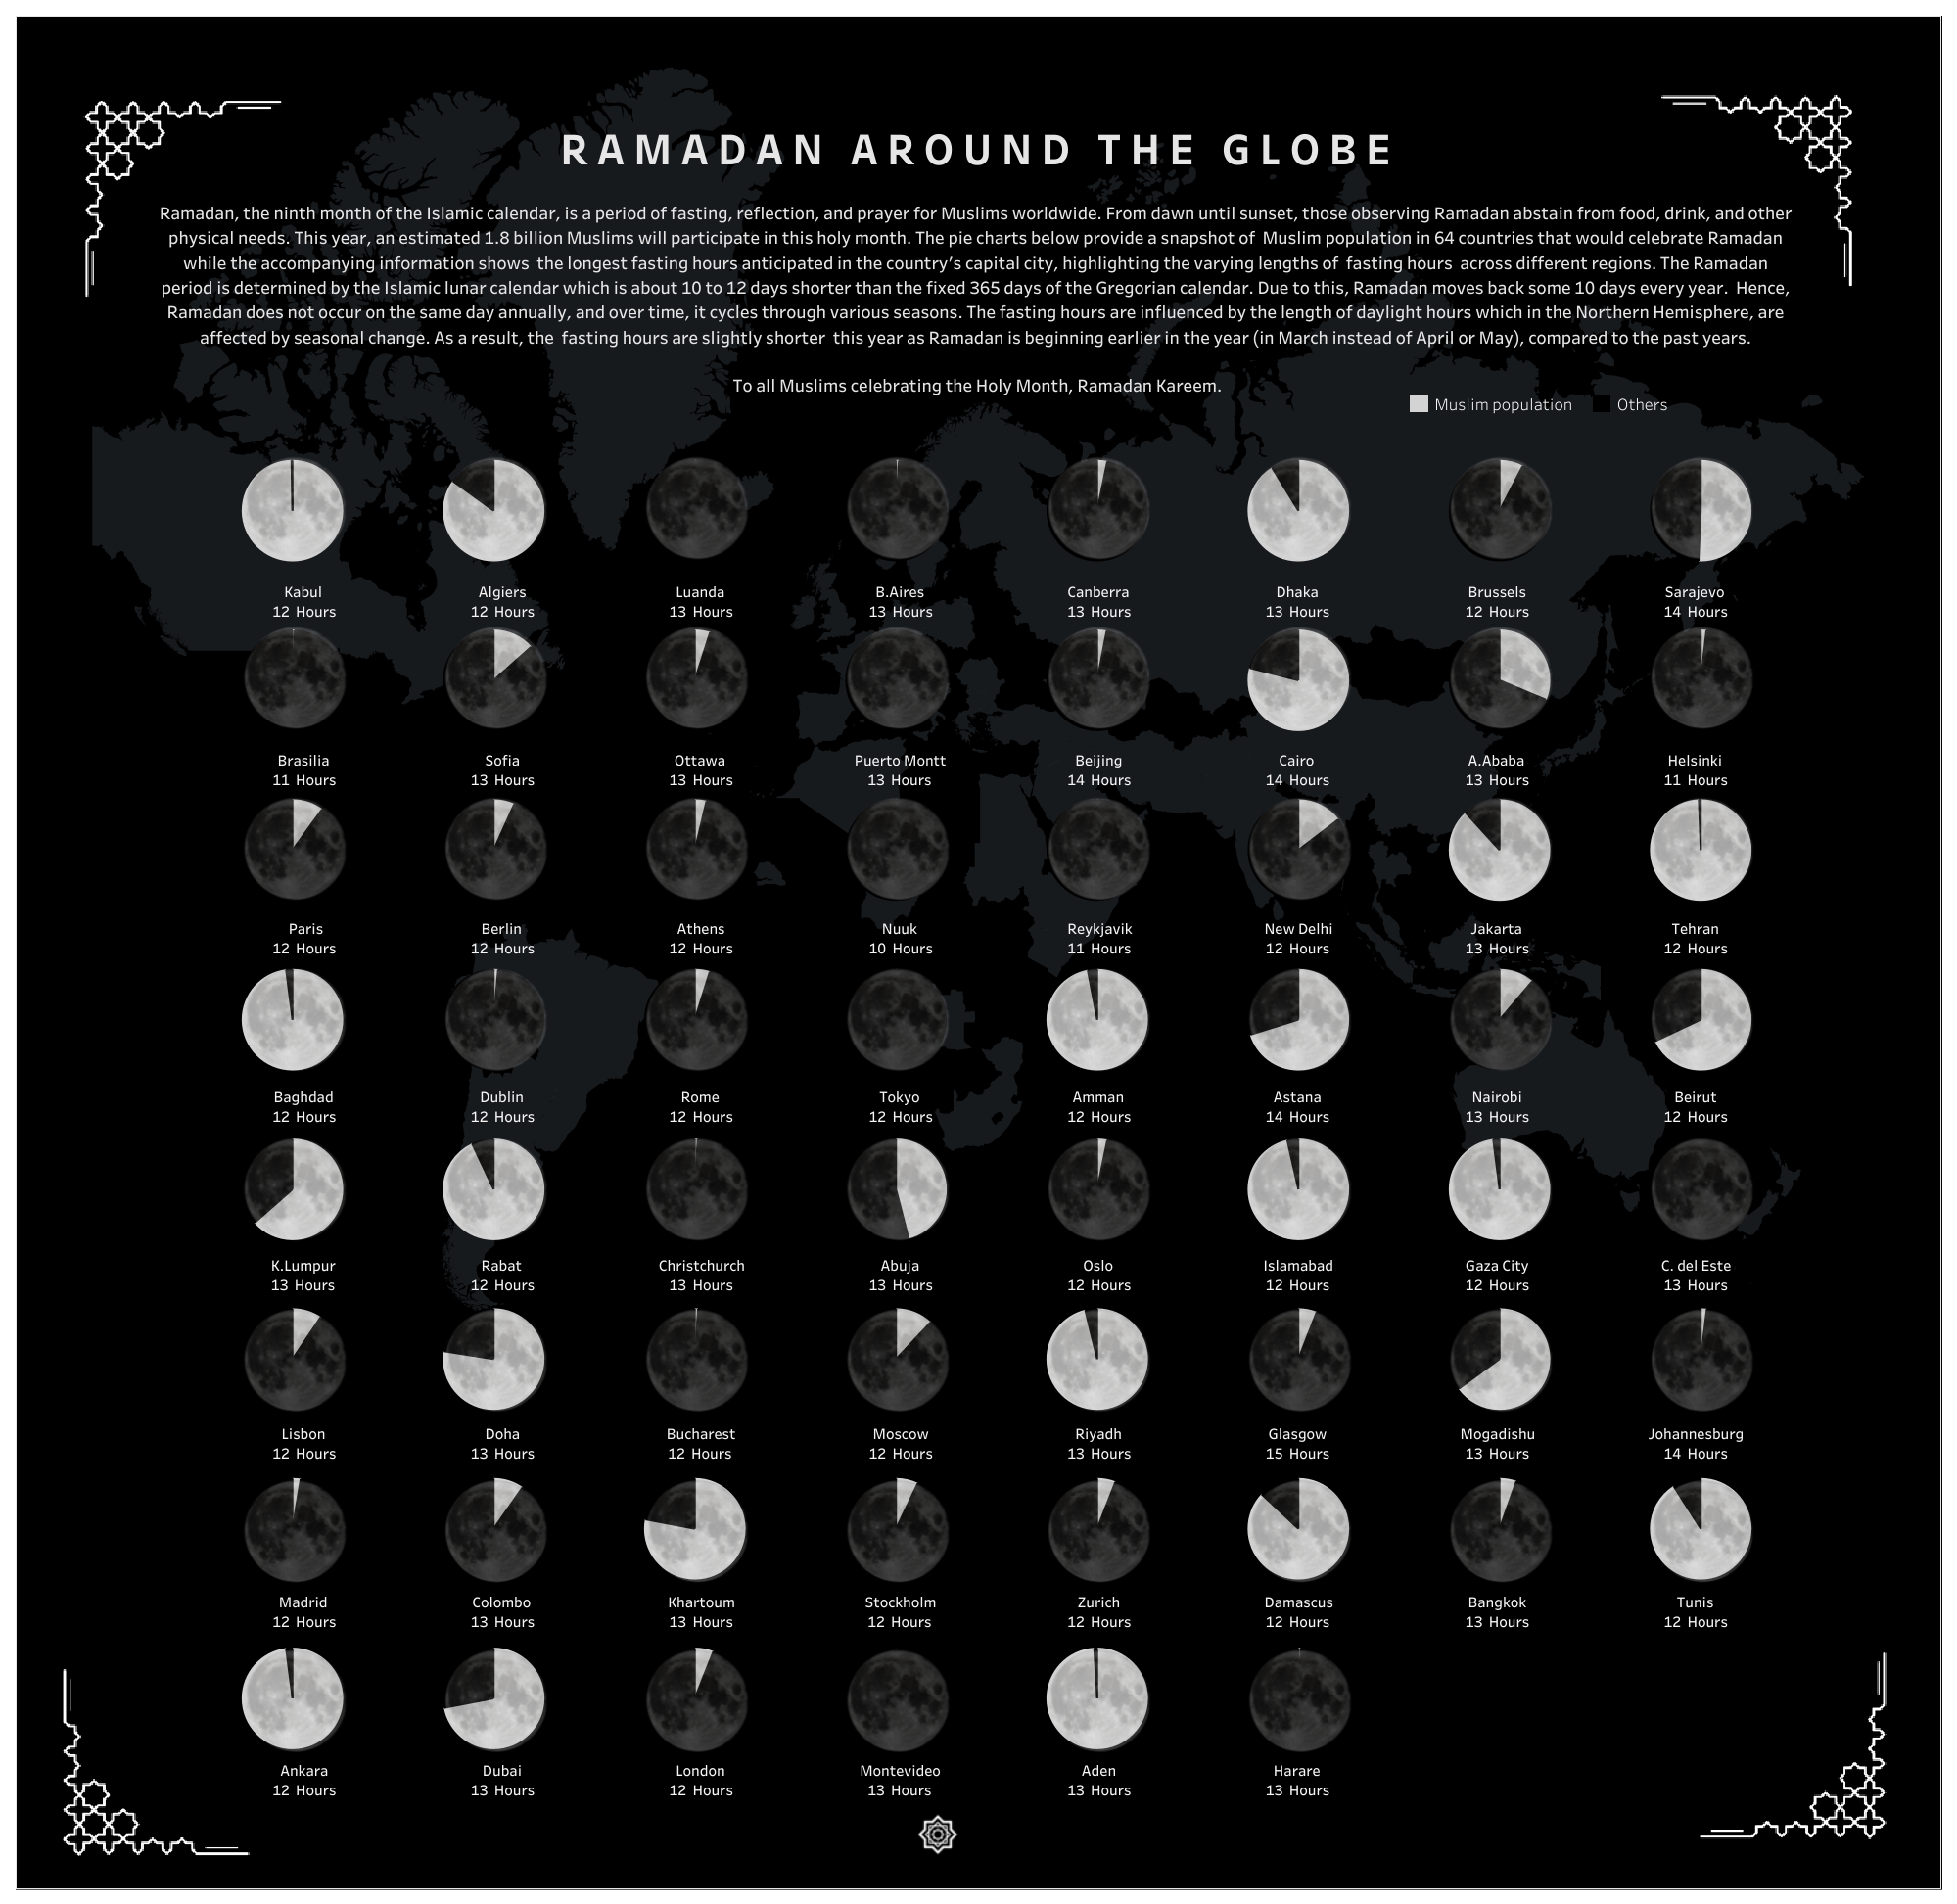
Shazeera Ahmad Zawawi: Ramadan Around The Globe
See the latest Viz of the Day, trending vizzes, featured authors, and more on Tableau Public.
Check out some inspirational vizzes created by the community:
- Dan Wade: F1 Lap Times Beeswarm | Tableau Community Art Gallery
- William Watkins: DEEEEETROIT'S (BACK)SKETBALL
- Prashant Sampathkumar: World's Population Estimates by 2050 #MakeoverMonday 2025 Week 9
- Deepak Holla: 4 Possible Ways to Visualize Ranking in Tableau
- Shangruff Raina:
Community Projects
Back 2 Viz Basics
A bi-weekly project helping those who are newer in the community and just starting out with Tableau. Not limited just to newbies!
Web: Back 2 Viz Basics
X: #B2VB
Workout Wednesday
Build your skills with a weekly challenge to re-create an interactive data visualization.
Web: Workout Wednesday
X: #WOW2022
Preppin' Data
A weekly challenge to help you learn to prepare data and use Tableau Prep.
Web: Preppin’ Data
X: #PreppinData
Makeover Monday
Create business dashboards using provided data sets for various industries and departments.
Web: Makeover Monday
X: #MakeoverMonday
Visual Climate
Collaborate and share climate data.
Web: Visual Climate
X: #VisualClimate
DataFam Con
A monthly challenge covering pop culture and fandoms.
Web: DataFam Con
X: #DataFamCon
EduVizzers
A monthly project connecting real education data with real people.
Web: Eduvizzers
Viz for Social Good
Volunteer to design data visualizations that help nonprofits harness the power of data for social change.
Web: Viz for Social Good
X: #VizforSocialGood
Games Night Viz
A monthly project focusing on using data from your favorite games.
Web: Games Nights Viz
X: #GamesNightViz
Iron Quest
Practice data sourcing, preparation, and visualization skills in a themed monthly challenge.
Web: Iron Quest
X: #IronQuest
Storytelling with Data
Practice data visualization and storytelling skills by participating in monthly challenges and exercises.
Web: Storytelling with Data
X: #SWDChallenge
Project Health Viz
Uncover new stories by visualizing healthcare data sets provided each month.
Web: Project Health Viz
X: #ProjectHealthViz
Diversity in Data
An initiative centered around diversity, equity & awareness by visualizing provided datasets each month.
Web: Diversity in Data
X: #DiversityinData
Sports Viz Sunday
Create and share data visualizations using rich, sports-themed data sets in a monthly challenge.
Web: Sports Viz Sunday
X: #SportsVizSunday
Real World Fake Data
Create business dashboards using provided data sets for various industries and departments.
Web: Real World Fake Data
X: #RWFD
Data Plus Music
A monthly project visualizing the data behind the music we love!
Web: Data Plus Music
X: #DataPlusMusic
Related Stories

DataFam Roundup June 2026

Tableau Ambassador Nominations and Applications are Open
 June 10, 2026
