DataFam Roundup: March 18–22, 2024


Welcome! Dig into this week's DataFam Roundup—a weekly blog that brings together community content all in one post. As always, we invite you to send us your content—and the DataFam content from your peers that have inspired you! Find the content submission form here.
Community Highlight
To recognize new and consistent Tableau contributors—we’re excited to have a section within the weekly DataFam Roundup called the Tableau Community Highlight. Find out how to get involved.

Nick Gerend, Lead Data Scientist at JP Morgan Chase
Texas, USA
Nick Gerend is the Lead Data Scientist at JP Morgan Chase. He stays active in the Tableau Community by sharing his knowledge on Linkedin and X, publishing vizzes on Tableau Public, and writing on his personal blog. Coming from a background in software development that was heavily intertwined with analytics and data science, Nick learned Tableau primarily through trial and error.
On his Medium blog, Nick shares visualization algorithms he has created that break new ground with techniques for different data structures. After creating a repository of about 30 different algorithms, Nick began releasing them in python and using his blog as a way to showcase them to the community. Nick also uses Tableau Public as a resource to test out the different algorithms he creates and inspire others that may be interested in unconventional ways to frame data in an artistic way.
Connect with Nick on Linkedin, X, Tableau Public, and on his blog.
DataFam content
Dive into content created by the Tableau Community:
-
Dawn Harrington, Tech Tips Girl: What are RAG Ratings for a Project Management Dashboard?
-
Kevin Flerlage, The Flerlage Twins: Tiny Tableau Tips - Round 5
-
Eric Balash, The Tableau Student Guide: Ian Cedric Io - Business Analytics
-
Shreya Arya: How to Embed a Spotify Player into Tableau Dashboards
-
Deepak Holla:
-
Adam Mico: ChatGPT - tBlueprint Navigator for Tableau Customer Success
-
Ian Cedric Io: Viz Review: Heatmaps
Team Tableau
-
How to grow your data skills with Tableau Community Projects | DataFam Explained
-
Hit the trails with the new Tableau Hands-On Challenges on Trailhead. Get hands-on experience and real-time feedback as you create new vizzes and build your Tableau Public portfolio, for free! To get started, log in or create a Trailhead account and explore one of these 5 new badges:
-
Data Storytelling with Tableau Public - Visualize data on any topic, share your data story worldwide, and get inspired.
-
The Tableau Data Model - Load your dataset and create relationships between tables.
-
Metadata Management in Tableau - Prepare a Tableau dataset with well-managed metadata.
-
Detailed Data Analysis - Ask questions and configure visuals to communicate insights.
-
Data Presentation in Tableau - Build dashboards in Tableau that guide stakeholders through critical analysis.
-
Upcoming events and community participation
-
Data Lead[HER]: Shaping the Future of Data & AI Join us for a virtual event in March, Women's History Month, designed to empower and elevate women leaders in the data and AI space. This program will feature insightful discussions and actionable strategies from women in leadership.
-
Lights, Camera, Action: Tableau and IMDb Launch Data Visualization Campaign for Movie Lovers
-
2024 Vizzies Award Nomination: The Tableau World Podcast established the Vizzies as a way to recognise individuals in the Tableau community who are not recognised through the visionary program. It is our goal that these awards are diverse and inclusive of the Tableau community.Without further ado, we present the 9th Annual Vizzies.Nominations are open now through March 25th 11:59pm EST. Winners will announced live on stage at TC24!
Vizzes
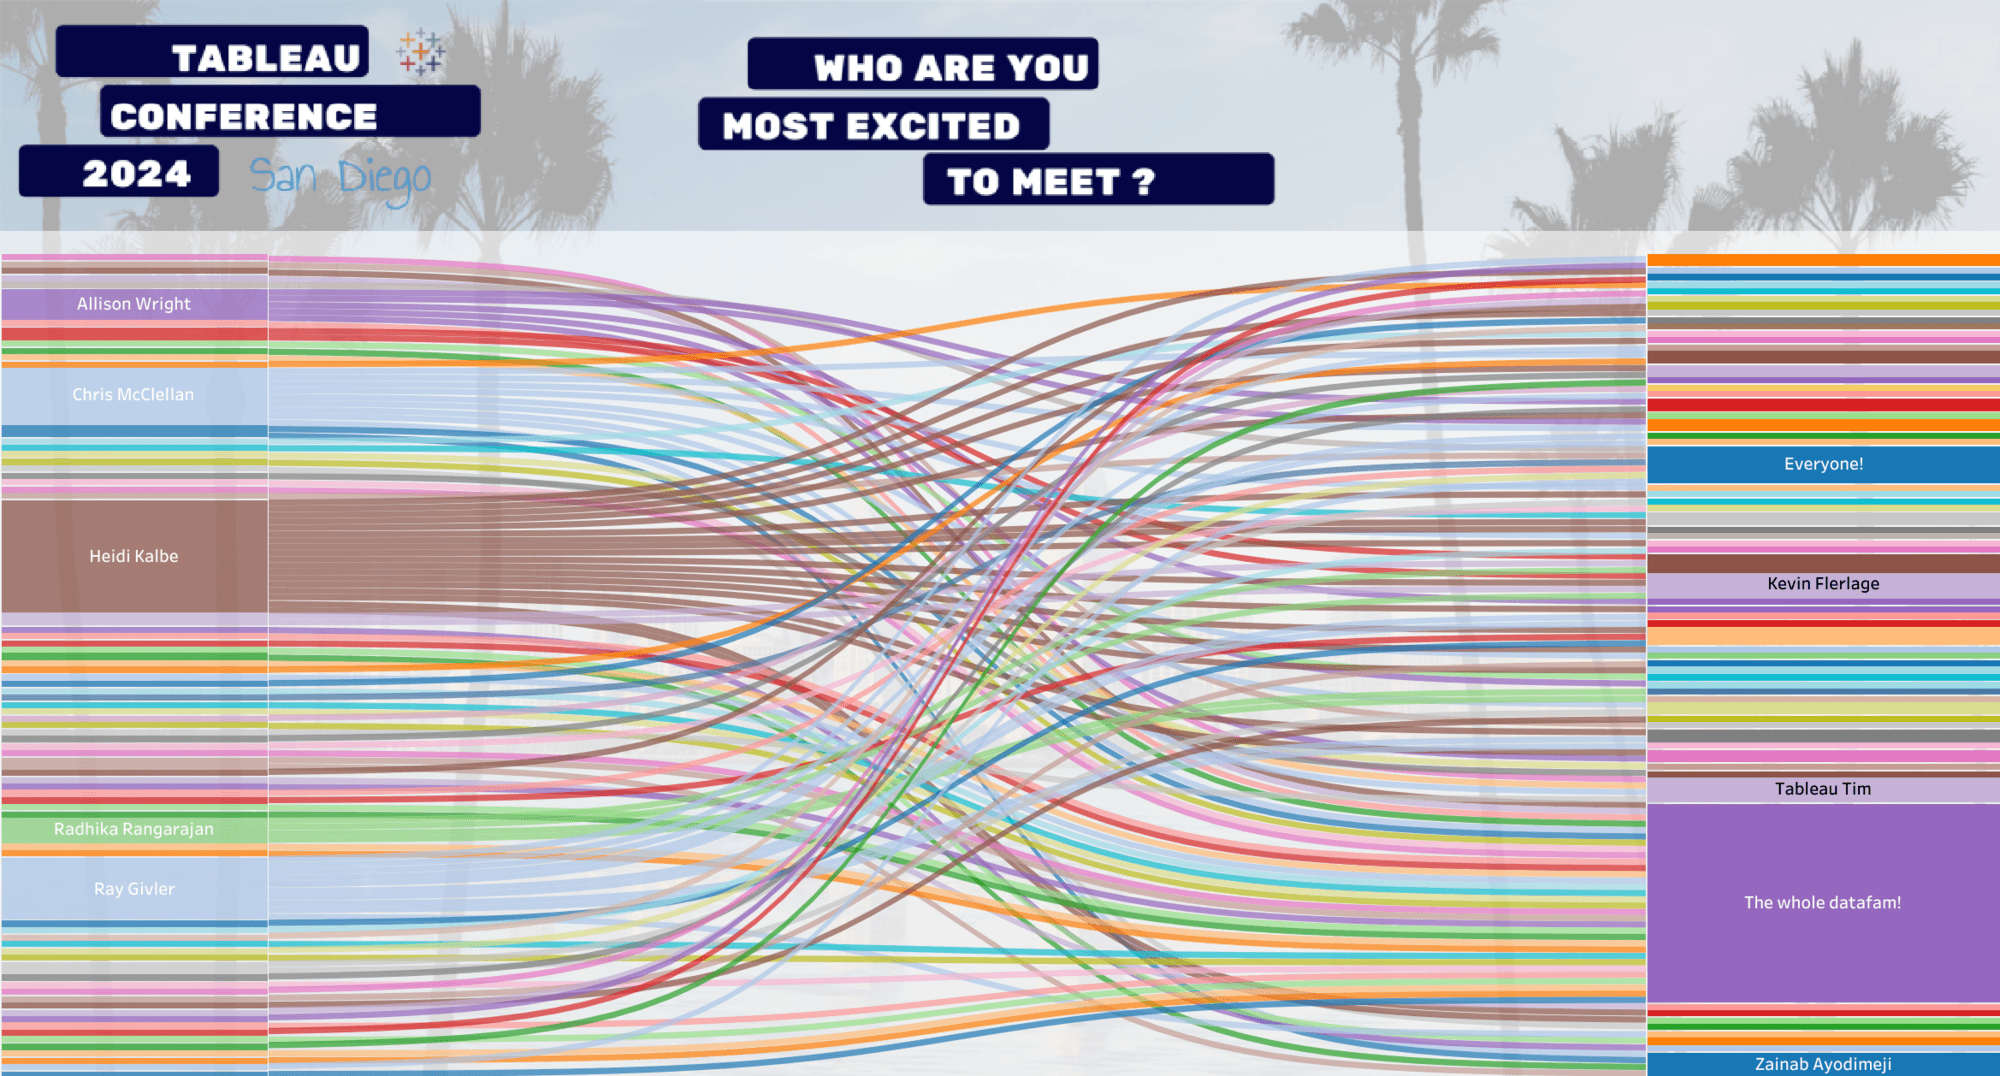
Chris McClellan: #DATA24 Who are you excited to meet
See the latest Viz of the Day, trending vizzes, featured authors, and more on Tableau Public.
Check out some inspirational vizzes created by the community:
-
CJ Mayes: Strava | Marginal Histogram
-
Satoshi Ganeko: Animal Rights (MOM Week09 2024)
-
Dennis Kao: San Diego Trolley
-
Annabelle Rincon: Put some flowers in your life
-
TableauCats: TableauCats_Portal
-
Sherzodbek Ibragimov: Best and Worst Countries For Animal Rights in 2021
-
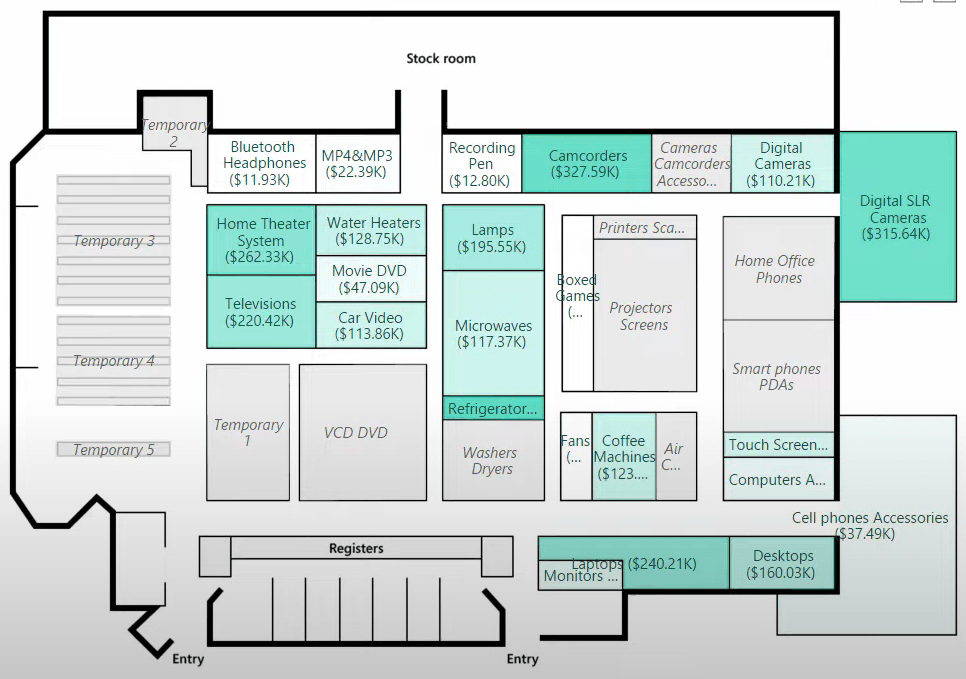
Ian Cedric Io: Grocery Store Analysis
-
Deborah Simmonds: #WOW2018 Week 35 - Superstore Small Multiples
-
Chris McClellan: #DATA24 Who are you excited to meet
Community Projects
Recreations of W.E.B Dubois's Data Portraits
Recreations of W.E.B Dubois's Data Portraits
Web: W.E.B. Dubois's Data Portraits
Twitter: #DubiosChallenge
Back 2 Viz Basics
A bi-weekly project helping those who are newer in the community and just starting out with Tableau. Not limited just to newbies!
Web: Back 2 Viz Basics
Twitter: #B2VB
Week 6: Design Insightful BANs
Workout Wednesday
Build your skills with a weekly challenge to re-create an interactive data visualization.
Web: Workout Wednesday
Twitter: #WOW2022
Week 12: Playing with Stacks
Preppin' Data
A weekly challenge to help you learn to prepare data and use Tableau Prep.
Web: Preppin’ Data
Twitter: #PreppinData
Week 12: Graduate Student Loan Repayments
DataFam Con
A monthly challenge covering pop culture and fandoms.
Web: DataFam Con
Twitter: #DataFamCon
March 2024 Challenge: Sports Movies Edition
Makeover Monday
Create business dashboards using provided data sets for various industries and departments.
Web: Makeover Monday
Twitter: #MakeoverMonday
Week 12: St Patrick's Day Data center
EduVizzers
A monthly project connecting real education data with real people.
Web: Eduvizzers
March 2024: Teacher Loan Forgiveness
Viz for Social Good
Volunteer to design data visualizations that help nonprofits harness the power of data for social change.
Web: Viz for Social Good
Twitter: #VizforSocialGood
March 15 - April 19, 2023: Visualizing the Social Impact of Viz for Social Good
Games Night Viz
A monthly project focusing on using data from your favorite games.
Web: Games Nights Viz
Twitter: #GamesNightViz
Season 2: With great power comes great vizzes
Iron Quest
Practice data sourcing, preparation, and visualization skills in a themed monthly challenge.
Web: Iron Quest
Twitter: #IronQuest
Women
Storytelling with Data
Practice data visualization and storytelling skills by participating in monthly challenges and exercises.
Web: Storytelling with Data
Twitter: #SWDChallenge
March 2024: design for accessibility
Project Health Viz
Uncover new stories by visualizing healthcare data sets provided each month.
Web: Project Health Viz
Twitter: #ProjectHealthViz
October 2023: Customizing Shapes with Opacity in Tableau
Diversity in Data
An initiative centered around diversity, equity & awareness by visualizing provided datasets each month.
Web: Diversity in Data
Twitter: #DiversityinData
November 2023: Disney Demographics
Sports Viz Sunday
Create and share data visualizations using rich, sports-themed data sets in a monthly challenge.
Web: Sports Viz Sunday
Twitter: #SportsVizSunday
Real World Fake Data
Create business dashboards using provided data sets for various industries and departments.
Web: Real World Fake Data
Twitter: #RWFD
2024 - Admin Insights
Data Plus Music
A monthly project visualizing the data behind the music we love!
Web: Data Plus Music
Twitter: #DataPlusMusic
Related Stories

DataFam Roundup June 2026
Tableau Ambassador Nominations and Applications are Open
 June 10, 2026
