DataFam Roundup July 7-11, 2025


Welcome! Dig into this week's DataFam Roundup—a weekly blog that brings together community content all in one post. As always, we invite you to send us your content—and the DataFam content from your peers that have inspired you! Find the content submission form here.
Community Highlight
To recognize new and consistent Tableau contributors—we’re excited to have a section within the weekly DataFam Roundup called the Tableau Community Highlight. Find out how to get involved.

Fathima Shanavas, Operations Data Associate at Grid Dynamics
Karnataka, India
Fathima Shanavas is an Operations Data Associate at Grid Dynamics. She started out her career as an educator but later wanted to pivot to data analysis, and Tableau stood out as the tool to explore. She started her journey with a course that gave her foundational knowledge about Tableau Desktop, then continued sharpening her skills by connecting with community members, attending Tableau User Groups, and participating in community projects like Makeover Monday, Back to Viz Basics, and Workout Wednesday.
Now, Fathima stays active in the community by publishing vizzes on Tableau Public (with over 60 vizzes published), attending the Career Pathmakers, Tableau Buddy, and Lagos TUGs, participating in community projects, and offering her time and mentorship to people just starting out with Tableau. On Tableau Public, she gets her inspiration from vizzes, resources, and books created by other community members.
Connect with Fathima on Linkedin and Tableau Public.
DataFam Content
- Darragh Murray: Early Experiments in Tableau’s New MCP Service: Connecting AI to Business Intelligence Platforms
- Dawn Harrington: How do you show Alaska and Hawaii in a Dashboard?
- Jacob Rothemund: Breaking the Blank Canvas – Finding Inspiration for Visualisation Projects
- Fi Crocker: Data Disasters, AI Anxiety and Consulting Gold with Chris Love and Carl Allchin
- Chris Perry: Day Zero Project Hierarchy (Tableau REST API Challenge)
- Tharashasank Davuluru: Visualizing Trust: How to Tell the Story of Data Privacy Through Dashboards
- Ann Pregler: Grey Out Irrelevant Areas With Dynamic Zone Visibility
- Kim Tricker: Formatting Tables and Graphs in Tableau
- Adam Mico & Annabelle Rincon: Hello, Tableau Next!
- Heather Cox: Ambass It On - a Suno AI generated song about nominating Tableau Ambassadors
- Johan de Groot:
- Steve Adams:
- Deepak Holla:
Team Tableau Content
Visualizations
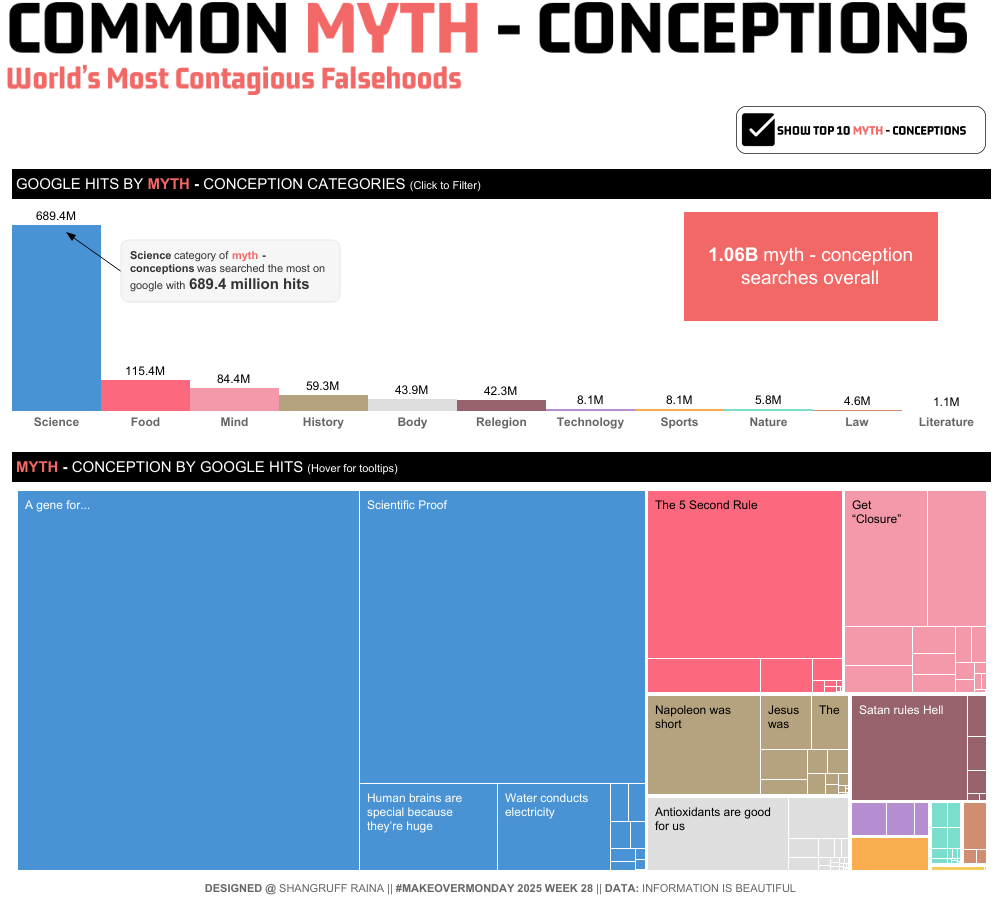
Shangruff Raina: Common Myth - Conceptions (World’s Most Contagious Falsehoods)
See the latest Viz of the Day, trending vizzes, featured authors, and more on Tableau Public.
Check out some inspirational vizzes created by the community:
-
Bill Chen (Kochin Chen 陳克勤): Core skills in 2030 (Data from Future of Jobs Report 2025)
-
Veronica Simoes: Students Habits and Performance
- Frederic Fery: Pedaling for a Purpose: 24000 km from France to Australia
- Tanya Lomskaya: Who's In The Spotlight? | GoT Character Interactions By Season
- Pat Sarsfield: The Many Sweaters of Mister Rodgers
- Dennis Kao: Light at the End of the Tunnel?
- John Johansson: Viz Design Catalog Vol. II
- Andy Holt: 'Choose Your Own Adventure' self-service report builder
- Shangruff Raina: Life Expectancy in 2025
- Waqar Ahmed Shaikh:
- Ojoswi Basu:
Community Projects
Back 2 Viz Basics
A bi-weekly project helping those who are newer in the community and just starting out with Tableau. Not limited just to newbies!
Web: Back 2 Viz Basics
X: #B2VB
Workout Wednesday
Build your skills with a weekly challenge to re-create an interactive data visualization.
Web: Workout Wednesday
X: #WOW2022
Preppin' Data
A weekly challenge to help you learn to prepare data and use Tableau Prep.
Web: Preppin’ Data
X: #PreppinData
Makeover Monday
Create business dashboards using provided data sets for various industries and departments.
Web: Makeover Monday
X: #MakeoverMonday
Data ChangeMakers
Volunteer to design data visualizations that help nonprofits harness the power of data for social change.
Web: Data ChangeMakers
Visual Climate
Collaborate and share climate data.
Web: Visual Climate
X: #VisualClimate
DataFam Con
A monthly challenge covering pop culture and fandoms.
Web: DataFam Con
X: #DataFamCon
EduVizzers
A monthly project connecting real education data with real people.
Web: Eduvizzers
Games Night Viz
A monthly project focusing on using data from your favorite games.
Web: Games Nights Viz
X: #GamesNightViz
Iron Quest
Practice data sourcing, preparation, and visualization skills in a themed monthly challenge.
Web: Iron Quest
X: #IronQuest
Storytelling with Data
Practice data visualization and storytelling skills by participating in monthly challenges and exercises.
Web: Storytelling with Data
X: #SWDChallenge
Project Health Viz
Uncover new stories by visualizing healthcare data sets provided each month.
Web: Project Health Viz
X: #ProjectHealthViz
Diversity in Data
An initiative centered around diversity, equity & awareness by visualizing provided datasets each month.
Web: Diversity in Data
X: #DiversityinData
Sports Viz Sunday
Create and share data visualizations using rich, sports-themed data sets in a monthly challenge.
Web: Sports Viz Sunday
X: #SportsVizSunday
Real World Fake Data
Create business dashboards using provided data sets for various industries and departments.
Web: Real World Fake Data
X: #RWFD
Data Plus Music
A monthly project visualizing the data behind the music we love!
Web: Data Plus Music
X: #DataPlusMusic
BizViz52
A weekly project centered around designing business dashboards.
Web: BizViz52
X: #BizViz52
Related Stories

DataFam Roundup June 2026

Tableau Ambassador Nominations and Applications are Open
 June 10, 2026
