DataFam Roundup: July 3-7, 2023


Welcome! Dig into this week's DataFam Roundup—a weekly blog that brings together community content all in one post. As always, we invite you to send us your content—and the DataFam content from your peers that have inspired you! Find the content submission form here.
Community Highlight
To recognize new and consistent Tableau contributors—we’re excited to have a section within the weekly DataFam Roundup called the Tableau Community Highlight. Find out how to get involved.

Ludovic Tavernier, Senior Data Analyst and Data Visualization Specialist at Ledger
Paris, France
Ludovic Tavernier is a Senior Data Analyst and Data Visualization Specialist at Ledger. He stays active in the Tableau Community by participating in community projects, such as Makeover Monday, publishing vizzes on Tableau Public, and sharing tips on Twitter.
After getting started with Tableau 8 years ago, Ludovic began using Tableau Public as a learning tool to develop his skills and portfolio. He was introduced to the community through his learning journey as he was able to easily get answers to his questions through Linkedin and Twitter.
Now, Ludovic’s biggest contribution to the community is sharing weekly Tableau Tips on Twitter. The initiative, called #BigLittleTips, aims to highlight features and address different issues that users may face. Check out Ludovic and his partner’s Medium article that wraps up all of the tips that have been shared so far.
Ludovic is also involved with the DataSuperStar community project, a competition for the best business dashboards, where he participates as a judge. He also competed in Tableau’s Iron Viz competition and was a finalist.
Connect with Ludovic on Linkedin, Twitter, and Tableau Public.
DataFam content
Dive into content created by the Tableau Community:
-
Rika Fujiwara: Tableau Conference 2023take away コミュニティを探索しよう!行き来しよう !越境活動のススメ
- Priyanka Dobhal: Use Cases for Dynamic Zone Visibility
- Rafael Simancas, Playfair Data: Introducing Pilula (aka Dr. Mario) Charts in Tableau
- Don Wise: Tableau Blueprint
- Steve Wood: table formatting in Tableau
-
The Information Lab: Soha Elghany, #IWD viz inspiration
-
Sarah Bartlett: Salesforce World Tour Highlights
-
Jennifer Dawes, herdata: Map Layers in Tableau
-
Alex Eskinasy: Tableau Embedded Error Handling— the Nice and Ugly ways
-
Ann Pregler: Tableau Dynamic Zones, The Basics
-
Valerie Logan, The Data Leadership Collaborative: Data Literacy vs. Data Fluency: What's in a Name?
-
Solomon Kahn, The Data Leadership Collaborative: AI + Data: 5 Ways to Maximize Your Impact
-
Viraj Bhargave: Have you noticed the connection between the field type and its positioning in the view when you double-click on the field?
-
Jacob Rothemund, #TinyTableauTip: Save time in your design workflow by dropping all your objects in first
-
Prasann Prem: How to show a "No Data" message in Tableau when there is no data in the view and it shows blank?
Team Tableau
Upcoming events and community participation
-
Michelle Frayman, Zak Geis and Nicole Klassen: Viz Feedback Office Hours
-
Data Book Club: This spring we'll be reading Avoiding Data Pitfalls: How to Steer Clear of Common Blunders When Working with Data and Presenting Analysis and Visualizations by Ben Jones.
-
TrailblazerDX ’23 Tableau Quest: Leverage the power of data with the world’s leading analytics platform to drive better business decisions.
-
Community Calendar and Upcoming Events: stay up-to-date on the latest Women in Dataviz events and other data visualization-related events. If you'd like to submit an event to the calendar, please fill out this form.
Vizzes
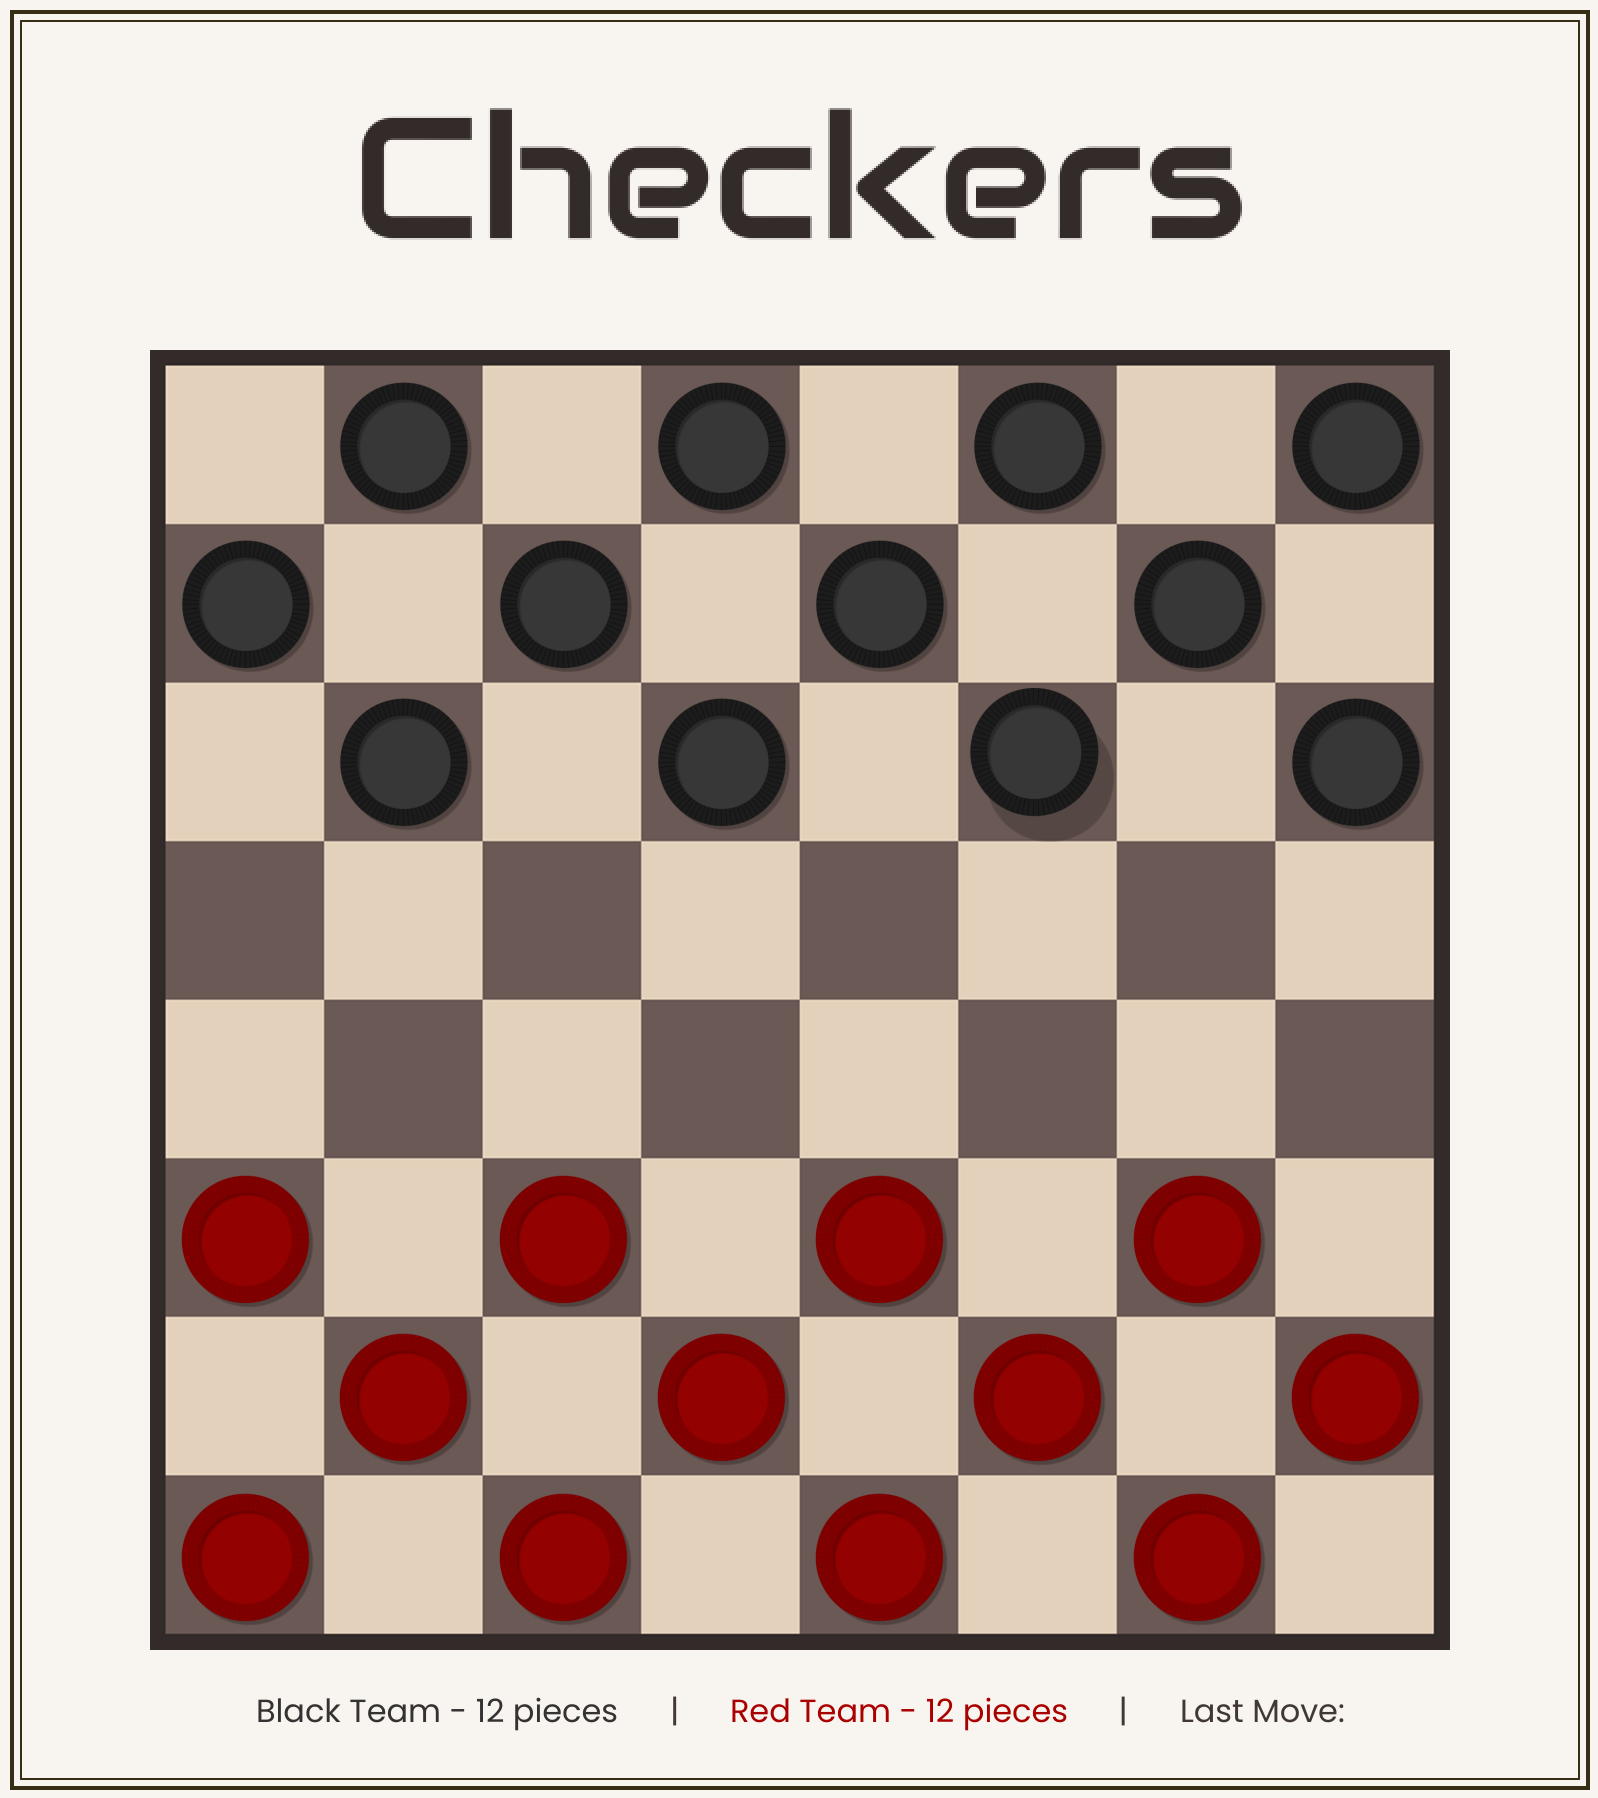
Brian Moore: Checkers
See the latest Viz of the Day, trending vizzes, featured authors, and more on Tableau Public.
Check out some inspirational vizzes created by the community:
-
Lorela Ferhati: Entrepreneurs and Mental Health
-
Brian Moore: Checkers
-
Shaheen Arshiya, JLL Viz Challenge - Tableau Conference Steps Count Data
-
Tamás Varga, Guided Tour Dashboard
-
Aakarsh R: Nobel Prize - Women who changed the world
-
Lilla Rasztik: #IronQuest 2013-2022 Press Freedom Index | Europe
Community Projects
Back 2 Viz Basics
A bi-weekly project helping those who are newer in the community and just starting out with Tableau. Not limited just to newbies!
Web: Back 2 Viz Basics
Twitter: #B2VB
Week 13: Catch-up Week
Workout Wednesday
Build your skills with a weekly challenge to re-create an interactive data visualization.
Web: Workout Wednesday
Twitter: #WOW2022
Week 27: Re-viz: Discovery Dashboard
Makeover Monday
A weekly social data project.
Web: Makeover Monday
Twitter: #MakeoverMonday
Week 27: OECD Alcohol consumption
Preppin' Data
A weekly challenge to help you learn to prepare data and use Tableau Prep.
Web: Preppin’ Data
Twitter: #PreppinData
Week 27: The Cost of Running the Prep School
DataFam Con
A monthly challenge covering pop culture and fandoms.
Web: DataFam Con
Twitter: #DataFamCon
April 2023: Kids Month!
EduVizzers
A monthly project connecting real education data with real people.
Web: Eduvizzers
July 2023: NYC SAT (College Board) 2010 School Level Results
Games Night Viz
A monthly project focusing on using data from your favorite games.
Web: Games Nights Viz
Twitter: #GamesNightViz
Level 6: The Final Boss
Iron Quest
Practice data sourcing, preparation, and visualization skills in a themed monthly challenge.
Web: Iron Quest
Twitter: #IronQuest
Advanced Chart Types
Storytelling with Data
Practice data visualization and storytelling skills by participating in monthly challenges and exercises.
Web: Storytelling with Data
Twitter: #SWDChallenge
July 2023: bring on the bubbles
Project Health Viz
Uncover new stories by visualizing healthcare data sets provided each month.
Web: Project Health Viz
Twitter: #ProjectHealthViz
June 2023: Funding for Research for Various Conditions and Diseases
Diversity in Data
An initiative centered around diversity, equity & awareness by visualizing provided datasets each month.
Web: Diversity in Data
Twitter: #DiversityinData
May 2023: Mental Health Awareness Month and LGBTQ+ Representation in film
Sports Viz Sunday
Create and share data visualizations using rich, sports-themed data sets in a monthly challenge.
Web: Sports Viz Sunday
Twitter: #SportsVizSunday
January 2023: Is it a Sport or a Game?
Viz for Social Good
Volunteer to design data visualizations that help nonprofits harness the power of data for social change.
Web: Viz for Social Good
Twitter: #VizforSocialGood
June 9 - July 18, 2023: Gord Downie & Chanie Wenjack Fund
Real World Fake Data
Create business dashboards using provided data sets for various industries and departments.
Web: Real World Fake Data
Twitter: #RWFD
Session 5: Diversity Score Card
Data Plus Music
A monthly project visualizing the data behind the music we love!
Web: Data Plus Music
Twitter: #DataPlusMusic
Related Stories

DataFam Roundup June 2026
Tableau Ambassador Nominations and Applications are Open
 June 10, 2026
