DataFam Roundup: July 17-21, 2023


Welcome! Dig into this week's DataFam Roundup—a weekly blog that brings together community content all in one post. As always, we invite you to send us your content—and the DataFam content from your peers that have inspired you! Find the content submission form here.
Community Highlight
To recognize new and consistent Tableau contributors—we’re excited to have a section within the weekly DataFam Roundup called the Tableau Community Highlight. Find out how to get involved.

Ana Milana, Data Visualization Developer
London, United Kingdom
Ana Milana is a Data Visualization Developer. She stays involved in the Tableau Community as a member of the London Tableau User Group, publishing vizzes on Tableau Public, and sharing her knowledge on her blog.
After finding herself answering the same questions and offering the same advice repeatedly, Ana decided to create a place where she could share her wisdom and direct people to it. Her blog has allowed her to share previous work and learnings, but also use it as a place to share inspirational and useful content focused on Data & Technology learning and Women Empowerment (e.g. tutorials, course & book recommendations, and Tableau dashboards). Ana also occasionally publishes other content such as book reviews and digital art.
Ana recently worked with a Peruvian non-profit organization to build an Impact Metrics dashboard on Tableau Public that is aimed at increasing visibility to the general public, stakeholders and institutions alike. In the future, she hopes to take on more projects that give her the opportunity to work with non-profit organizations and charities.
In addition to sharing her knowledge online, Ana is in the process of organizing a Tableau Basics Workshop, set to be held later this year. She hopes to channel her passions for teaching and meeting and talking with people through her workshop.
Connect with Ana on Twitter, Tableau Public, and on her blog.
DataFam content
Dive into content created by the Tableau Community:
-
Ken Flerlage, The Flerlage Twins: 5 Ways to Share Tableau Content Publicly
-
Christina Gorga: Tiny Tableau Tip
-
Prasann Prem: Create a Chord Diagram in 5 Minutes
-
Will Sutton: Switching Careers to Tech and Developing Tableau Skills | Salesforce World Tour London
-
Ant Pulley: Cool stuff in Tableau Public
-
Sarah Bartlett: Iron Quest Feedback - Advanced Chart Types
-
Tim Ngwena, Tableau Tim: ChatGPT Code Interpreter vs Tableau | ChatGPT, Tableau GPT & LLMs
-
Pooja Kamath, The Data Leadership Collaborative: Delivering the Ultimate Customer Experience with Data + Culture
-
Do Moore With Data: It Depends: Market Basket Analysis
-
The Data Leadership Collaborative: Enterprise AI: A Data Leader’s Guide to Success
-
Jared Flores: Tableau Relationships vs Joins
-
Sai Krishna: 2 used cases of Parameter Actions in Tableau (Index charts and Multi-Measures) — Part 1
Team Tableau
Upcoming events and community participation
-
Data + Diversity: Data Driven Strategies for Eliminating Health Disparities with Talithia Williams Virtual Event - Data + Diversity provides a platform for community conversations surrounding the challenges and solutions to diversity in data. Dr. Williams will discuss how data is essential for understanding social determinants of health and provide suggestions for improvement.
-
DLC Networking Hour: Everything you need to know about AI/ML
-
VizIt Sydney is happening October 31 - November 1! A Tableau Community Conference, by the Datafam for the Datafam. Sign up to be the first to know when registration opens and submit to be a speaker now
-
Michelle Frayman, Zak Geis and Nicole Klassen: Viz Feedback Office Hours
-
Data Book Club: This summer, the Data Book Club is reading Living in Data: A Citizen's Guide to a Better Information Future by Jer Thorp.
-
TrailblazerDX ’23 Tableau Quest: Leverage the power of data with the world’s leading analytics platform to drive better business decisions.
-
Community Calendar and Upcoming Events: stay up-to-date on the latest Women in Dataviz events and other data visualization-related events. If you'd like to submit an event to the calendar, please fill out this form.
Vizzes
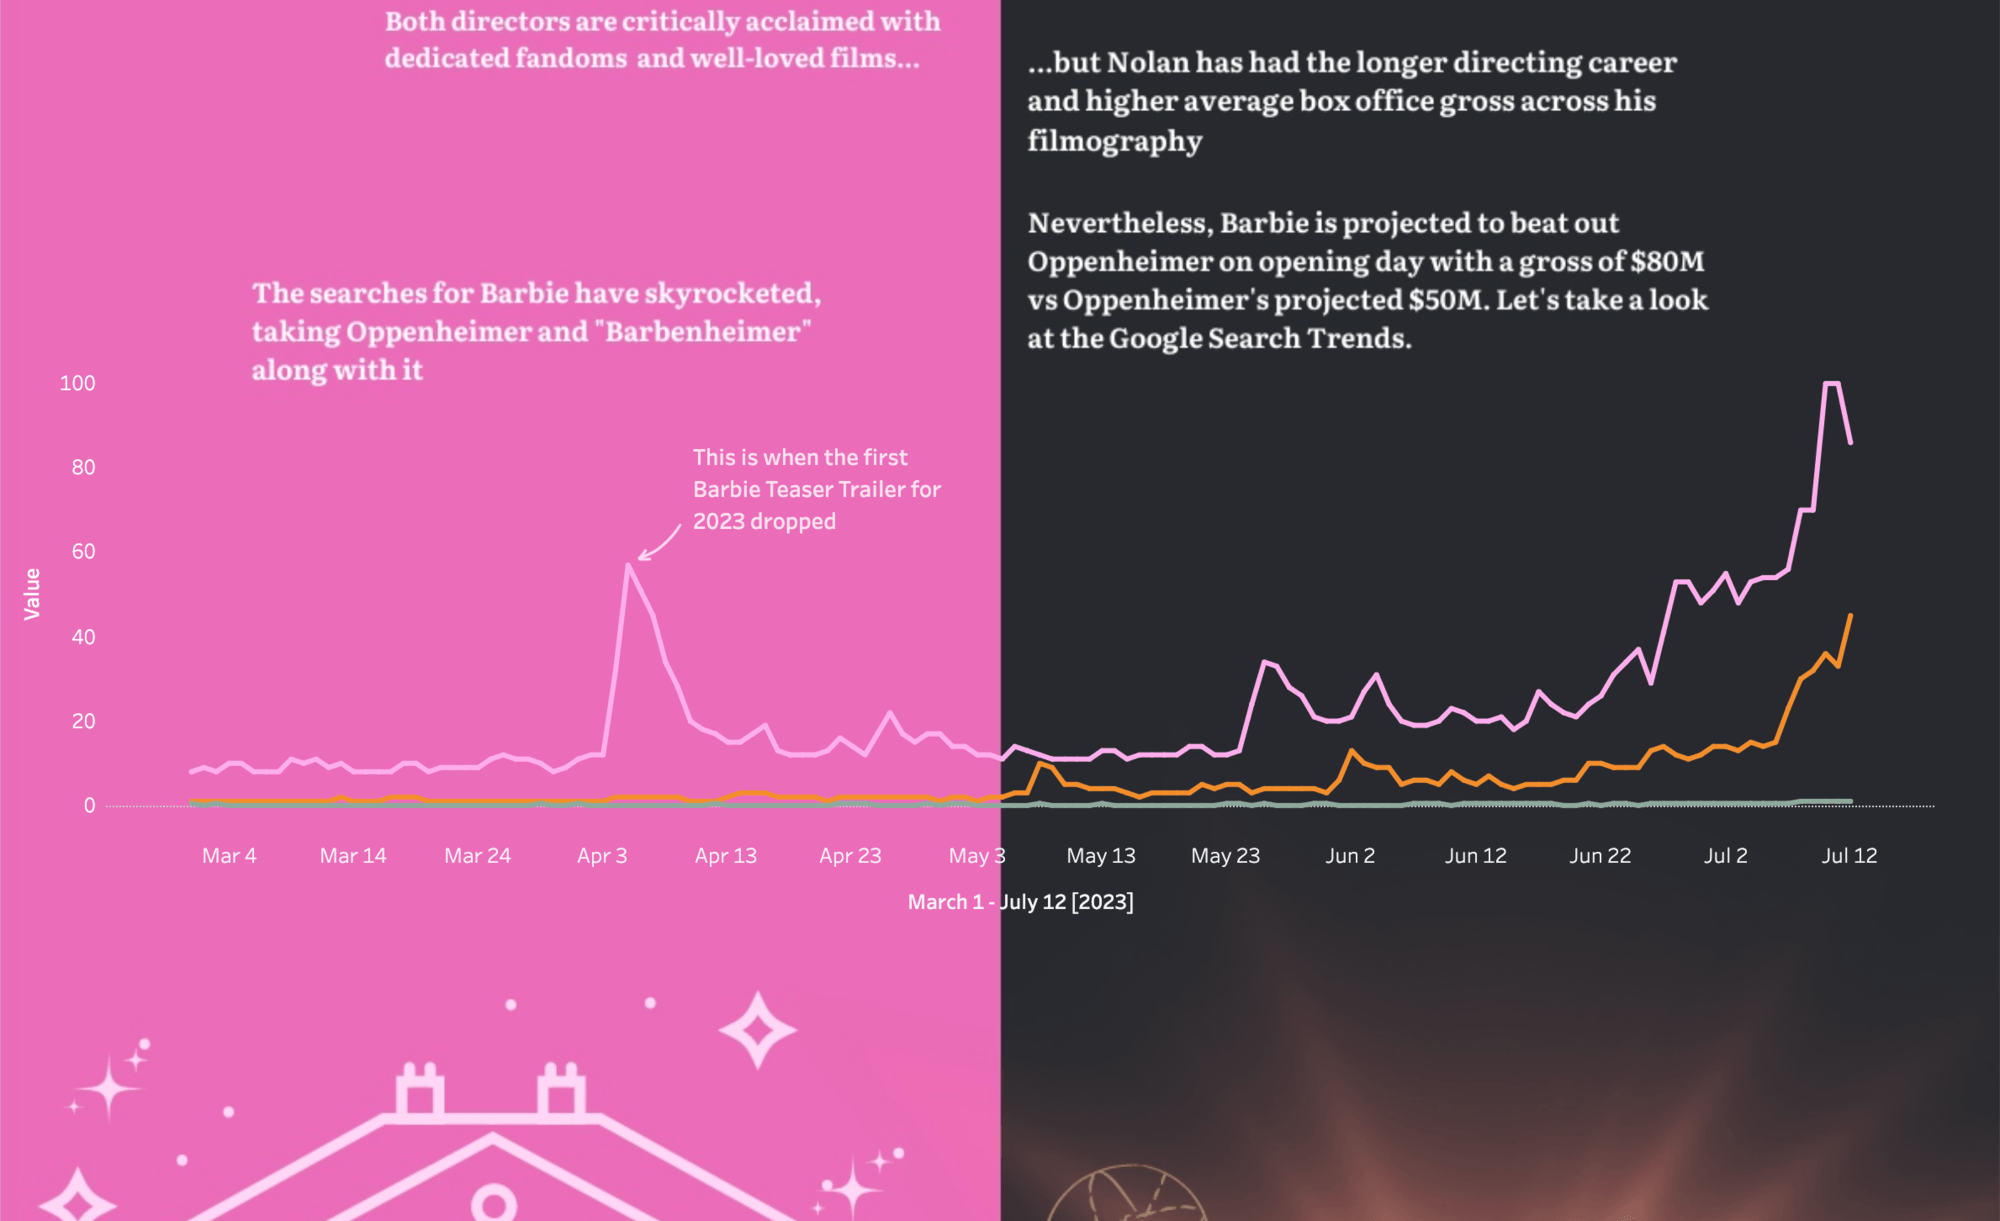
Gio Exume: Barbenheimer: Barbie vs Oppenheimer
See the latest Viz of the Day, trending vizzes, featured authors, and more on Tableau Public.
Check out some inspirational vizzes created by the community:
-
Varun Jain: Re-Discovering the Love for Books | #IronQuest
-
Maureen Okonkwo: The Heneley Passprt Index - West Africa
-
Gio Exume: Barbenheimer: Barbie vs Oppenheimer
Community Projects
Back 2 Viz Basics
A bi-weekly project helping those who are newer in the community and just starting out with Tableau. Not limited just to newbies!
Web: Back 2 Viz Basics
Twitter: #B2VB
Week 14: Write a Clear Title
Workout Wednesday
Build your skills with a weekly challenge to re-create an interactive data visualization.
Web: Workout Wednesday
Twitter: #WOW2022
Week 29: Re-viz : Blind leading the blind
Makeover Monday
A weekly social data project.
Web: Makeover Monday
Twitter: #MakeoverMonday
Week 29: Climate Action Tracker
Preppin' Data
A weekly challenge to help you learn to prepare data and use Tableau Prep.
Web: Preppin’ Data
Twitter: #PreppinData
Week 29: Moving Averages
DataFam Con
A monthly challenge covering pop culture and fandoms.
Web: DataFam Con
Twitter: #DataFamCon
April 2023: Kids Month!
EduVizzers
A monthly project connecting real education data with real people.
Web: Eduvizzers
July 2023: NYC SAT (College Board) 2010 School Level Results
Games Night Viz
A monthly project focusing on using data from your favorite games.
Web: Games Nights Viz
Twitter: #GamesNightViz
Level 6: The Final Boss
Iron Quest
Practice data sourcing, preparation, and visualization skills in a themed monthly challenge.
Web: Iron Quest
Twitter: #IronQuest
Advanced Chart Types
Storytelling with Data
Practice data visualization and storytelling skills by participating in monthly challenges and exercises.
Web: Storytelling with Data
Twitter: #SWDChallenge
July 2023: bring on the bubbles
Project Health Viz
Uncover new stories by visualizing healthcare data sets provided each month.
Web: Project Health Viz
Twitter: #ProjectHealthViz
June 2023: Funding for Research for Various Conditions and Diseases
Diversity in Data
An initiative centered around diversity, equity & awareness by visualizing provided datasets each month.
Web: Diversity in Data
Twitter: #DiversityinData
May 2023: Mental Health Awareness Month and LGBTQ+ Representation in film
Sports Viz Sunday
Create and share data visualizations using rich, sports-themed data sets in a monthly challenge.
Web: Sports Viz Sunday
Twitter: #SportsVizSunday
January 2023: Is it a Sport or a Game?
Viz for Social Good
Volunteer to design data visualizations that help nonprofits harness the power of data for social change.
Web: Viz for Social Good
Twitter: #VizforSocialGood
June 9 - July 18, 2023: Gord Downie & Chanie Wenjack Fund
Real World Fake Data
Create business dashboards using provided data sets for various industries and departments.
Web: Real World Fake Data
Twitter: #RWFD
Session 5: Diversity Score Card
Data Plus Music
A monthly project visualizing the data behind the music we love!
Web: Data Plus Music
Twitter: #DataPlusMusic
Related Stories

DataFam Roundup June 2026
Tableau Ambassador Nominations and Applications are Open
 June 10, 2026
