DataFam Roundup July 14-18, 2025


Welcome! Dig into this week's DataFam Roundup—a weekly blog that brings together community content all in one post. As always, we invite you to send us your content—and the DataFam content from your peers that have inspired you! Find the content submission form here.
Community Highlight
To recognize new and consistent Tableau contributors—we’re excited to have a section within the weekly DataFam Roundup called the Tableau Community Highlight. Find out how to get involved.

Oluwadunsin Agbolabori, Data Analyst
Georgia, USA
Oluwadunsin Agbolabori is a Data Analyst and active member of the Tableau Community. Starting his Tableau journey to enhance business data analysis in Excel, he quickly mastered the platform through online tutorials, community forums, and hands-on practice. Today, he's an active member of the Atlanta Tableau User Group and regularly publishes work on Tableau Public, engaging with other authors and contributing to online discussions. His volunteer work as a Data Visualization Specialist with the World Disaster Centre further highlights his dedication, where he transforms raw data into impactful dashboards that aid NGOs in understanding disaster trends and improving funding decisions. Oluwadunsin deeply values the Tableau Community's generosity, and appreciates how members of the DataFam uplift one another.
Beyond his community involvement, Oluwadunsin shares his expertise through his blog, aiming to demystify data analysis and dashboard design for others. He focuses on common challenges and practical techniques, making complex concepts accessible. Whether through Tableau Public, LinkedIn, user group meetings, or informal mentoring, he's committed to building confidence and fostering collaboration within the community. Looking ahead, Oluwadunsin is excited to refine his design skills, explore advanced analytics, and continue his volunteer work, using data storytelling to support disaster relief efforts and push the boundaries of data visualization.
Connect with Oluwadunsin on Linkedin, X, Tableau Public, and on his blog
DataFam Content
- Annabelle Rincon and Adam Mico: Pulse for Everyday Insights
- Kim Tricker: How to Implement Multiple URL Actions in a Single Sheet in Tableau
- Jim Dehner: Maps: The Basics and Cool New Techniques
- Annabelle Rincon: Collaborate to Elevate your Skills
- Fi Crocker:
- Deepak Holla:
Team Tableau Content
- Tableau 2025.2 is Now Available
- 2025 Tableau Ambassador Nominations and Applications are Open Until 7/25/25
Visualizations
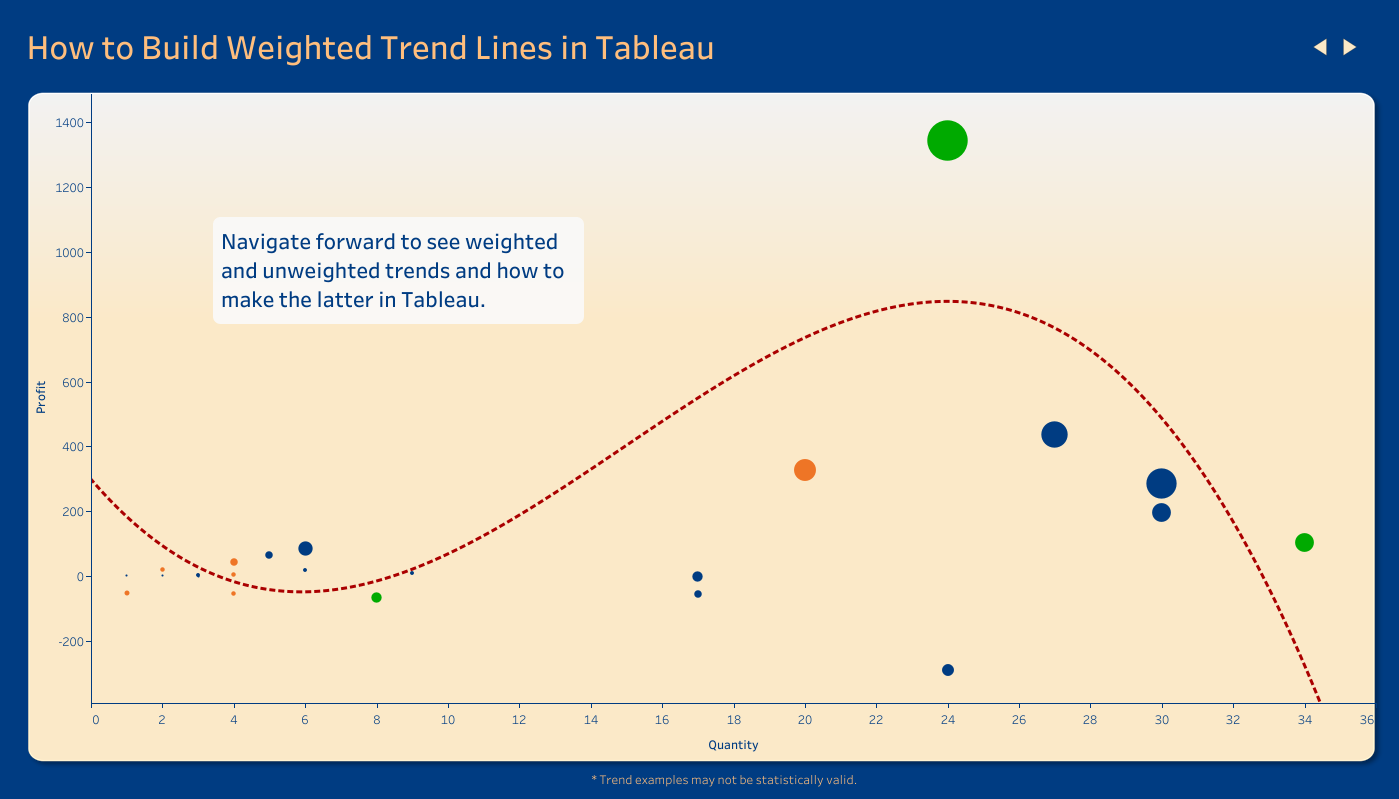
Ray Givler: How to Build Weighted Trend Lines in Tableau
See the latest Viz of the Day, trending vizzes, featured authors, and more on Tableau Public.
Check out some inspirational vizzes created by the community:
- Annabelle Rincon: She is back ! New home for little mouse
- Haroon Tahir: Telecom Market Share Dashboard
- Jacob Rothemund: Tableau Public Portfolio (+Template)
- Zyad Wael: Ancient Egypt Attractions
- Anubha Gupta: Uncover Your Birthday's Fame
Community Projects
Back 2 Viz Basics
A bi-weekly project helping those who are newer in the community and just starting out with Tableau. Not limited just to newbies!
Web: Back 2 Viz Basics
X: #B2VB
Workout Wednesday
Build your skills with a weekly challenge to re-create an interactive data visualization.
Web: Workout Wednesday
X: #WOW2022
Preppin' Data
A weekly challenge to help you learn to prepare data and use Tableau Prep.
Web: Preppin’ Data
X: #PreppinData
Makeover Monday
Create business dashboards using provided data sets for various industries and departments.
Web: Makeover Monday
X: #MakeoverMonday
Data ChangeMakers
Volunteer to design data visualizations that help nonprofits harness the power of data for social change.
Web: Data ChangeMakers
Visual Climate
Collaborate and share climate data.
Web: Visual Climate
X: #VisualClimate
DataFam Con
A monthly challenge covering pop culture and fandoms.
Web: DataFam Con
X: #DataFamCon
EduVizzers
A monthly project connecting real education data with real people.
Web: Eduvizzers
Games Night Viz
A monthly project focusing on using data from your favorite games.
Web: Games Nights Viz
X: #GamesNightViz
Iron Quest
Practice data sourcing, preparation, and visualization skills in a themed monthly challenge.
Web: Iron Quest
X: #IronQuest
Storytelling with Data
Practice data visualization and storytelling skills by participating in monthly challenges and exercises.
Web: Storytelling with Data
X: #SWDChallenge
Project Health Viz
Uncover new stories by visualizing healthcare data sets provided each month.
Web: Project Health Viz
X: #ProjectHealthViz
Diversity in Data
An initiative centered around diversity, equity & awareness by visualizing provided datasets each month.
Web: Diversity in Data
X: #DiversityinData
Sports Viz Sunday
Create and share data visualizations using rich, sports-themed data sets in a monthly challenge.
Web: Sports Viz Sunday
X: #SportsVizSunday
Real World Fake Data
Create business dashboards using provided data sets for various industries and departments.
Web: Real World Fake Data
X: #RWFD
Data Plus Music
A monthly project visualizing the data behind the music we love!
Web: Data Plus Music
X: #DataPlusMusic
BizViz52
A weekly project centered around designing business dashboards.
Web: BizViz52
X: #BizViz52
Related Stories

DataFam Roundup June 2026
Tableau Ambassador Nominations and Applications are Open
 June 10, 2026
