All Analyst Stories
 Tableau Community
Nominate a Tableau Social Media Ambassador!
 December 17, 2015
Do you know an exceptional Tableau user who helps others via social media? Nominate the person to be a Tableau Ambassador! Earlier this year, we launched our Tableau Ambassador program, which recognizes community members who go above and beyond the call of duty to help other Tableau users. The program began with a single branch, the Tableau Ambassadors for the Community Forums. We soon added two more branches: the Tableau Ambassadors for User Groups and the Tableau Ambassadors for Social Media. The Ambassador program now encompasses three different—but deeply-connected—areas of the Tableau community: the community forums, the user groups, and social media.
December 17, 2015
Do you know an exceptional Tableau user who helps others via social media? Nominate the person to be a Tableau Ambassador! Earlier this year, we launched our Tableau Ambassador program, which recognizes community members who go above and beyond the call of duty to help other Tableau users. The program began with a single branch, the Tableau Ambassadors for the Community Forums. We soon added two more branches: the Tableau Ambassadors for User Groups and the Tableau Ambassadors for Social Media. The Ambassador program now encompasses three different—but deeply-connected—areas of the Tableau community: the community forums, the user groups, and social media. Visualizations
Data Geeks, Visualize Our Star Wars Data
December 11, 2015
Here at Tableau, we might be getting a little too excited about next week’s Star Wars release. But who can blame us? Star Wars basically has the perfect combination of brainy geekiness and excellent storytelling that we love here at Tableau.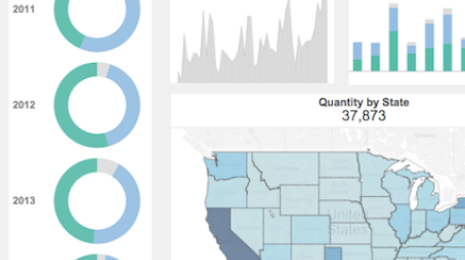 Visualizations
Format This Interactive Key-Metrics Dashboard in Just 10 Minutes
Want more of your colleagues to dive into data? Introduce them to the data-informed way of life with an elegant dashboard about key metrics. A high-level dashboard that keeps the company updated at all levels and also drills down in seconds can help people evolve from passive consumers of data to self-service can-doers.
 Product
Tableau Server Now Supported in Microsoft Azure
 December 4, 2015
Today, we are excited to take another step in the cloud by extending our integration with Microsoft’s cloud platform with support for Microsoft Azure Virtual Machines. This is an important part of the broad integration that Tableau offers with Microsoft technologies.
December 4, 2015
Today, we are excited to take another step in the cloud by extending our integration with Microsoft’s cloud platform with support for Microsoft Azure Virtual Machines. This is an important part of the broad integration that Tableau offers with Microsoft technologies.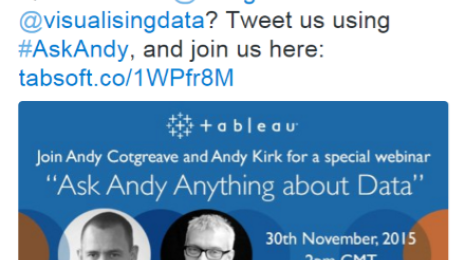 Data
Data#AskAndy Anything about Data: Further Reading
 December 1, 2015
Did you catch the Ask Andy Anything About Data webinar? I talked with Andy Kirk (of visualisingdata.com) about the state of data visualization, appropriate chart choices, and the etiquette of critiquing others. It was great fun and we managed to tackle ten questions in the hour. We discussed a lot of different resources which are gathered here.
December 1, 2015
Did you catch the Ask Andy Anything About Data webinar? I talked with Andy Kirk (of visualisingdata.com) about the state of data visualization, appropriate chart choices, and the etiquette of critiquing others. It was great fun and we managed to tackle ten questions in the hour. We discussed a lot of different resources which are gathered here. Visualizations
Data Dialogues: To Pie Chart or Not to Pie Chart?
 November 26, 2015
Oh, the poor, maligned pie chart. The chart type that gets pushed around and bullied on the data-viz playground more than any other.
 Visualizations
Got a Scatter Plot? Learn How to Add Marginal Histograms
November 16, 2015
Scatter plots are my favorite visualization type, hands down. From my very first interactive data graphic about The Great One to the most recent visualization below on major league pitchers, I’ve learned a great deal from these Cartesian classics over the years. In this post I’ll show you how to make them even better than the standard ones in Tableau.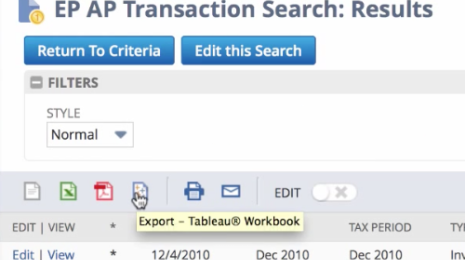 Product
Analyze Cloud Business Data with Tableau's New NetSuite Integration
October 28, 2015
We are excited to announce a new integration with NetSuite, a provider of cloud-based financials/ERP and omnichannel commerce software suites. We’ve added a new feature that exports NetSuite data as a .twbx file for easy analysis in Tableau. Tableau Community
Data + Women: Advice from the SFBATUG Members
How can women succeed in the data industry? For one, it’s important to push your own boundaries. That was the consensus at a recent SFBATUG meeting on the topic of Data + Women. Here are some takeaways from the discussion.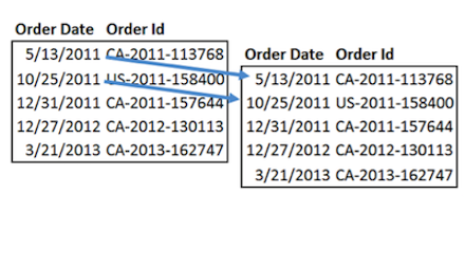 Data
DataTableau Doctor: 1 Column, 2 Dates? Use Custom SQL
 September 30, 2015
I am a huge fan of doing things the right way instead of using workarounds or shortcuts. Tableau is an incredible tool for solving problems, and using the functionality within Tableau, I have rarely found a problem unsolvable. That being said, sometimes it just makes more sense to make the data easier to work with before bringing it into Tableau.
September 30, 2015
I am a huge fan of doing things the right way instead of using workarounds or shortcuts. Tableau is an incredible tool for solving problems, and using the functionality within Tableau, I have rarely found a problem unsolvable. That being said, sometimes it just makes more sense to make the data easier to work with before bringing it into Tableau. Visualizations
Tableau on Tableau: How we design our Salesforce dashboards
 September 14, 2015
A dashboard is only effective if it answers useful questions for people. That’s why a customized, user-specific dashboard is more impactful than a ready-made, one-size-fit-all report. Here at Tableau, we always design visualizations with the user in mind. Here are several techniques we use to customize our sales dashboards.
September 14, 2015
A dashboard is only effective if it answers useful questions for people. That’s why a customized, user-specific dashboard is more impactful than a ready-made, one-size-fit-all report. Here at Tableau, we always design visualizations with the user in mind. Here are several techniques we use to customize our sales dashboards. Tableau Community
Personality Test, Pianeau among Best of the Tableau Web
September 4, 2015
One the many gems in this month’s roundup: a Tableau personality test! Put this test to the test by using the sliders to answer the questions, says Matt Francis, who created the test using a radar chart.