Now available in Tableau 2021.2—Ask Data and Explain Data for Viewers, Collections, a connected Tableau Desktop experience for web authoring, and more


The newest release of Tableau is here! Tableau 2021.2 brings new and improved ways to interact with your data to ensure everyone across your organization can ask meaningful questions and get valuable answers from their data. Upgrade now to take advantage of these new innovations, and get the most from your data with our latest augmented analytics features.
Let’s look at some of the exciting features in the Tableau 2021.2 release:
- Enable everyone to ask relevant questions of their data using natural language and uncover insights with new experiences for Ask Data and Explain Data.
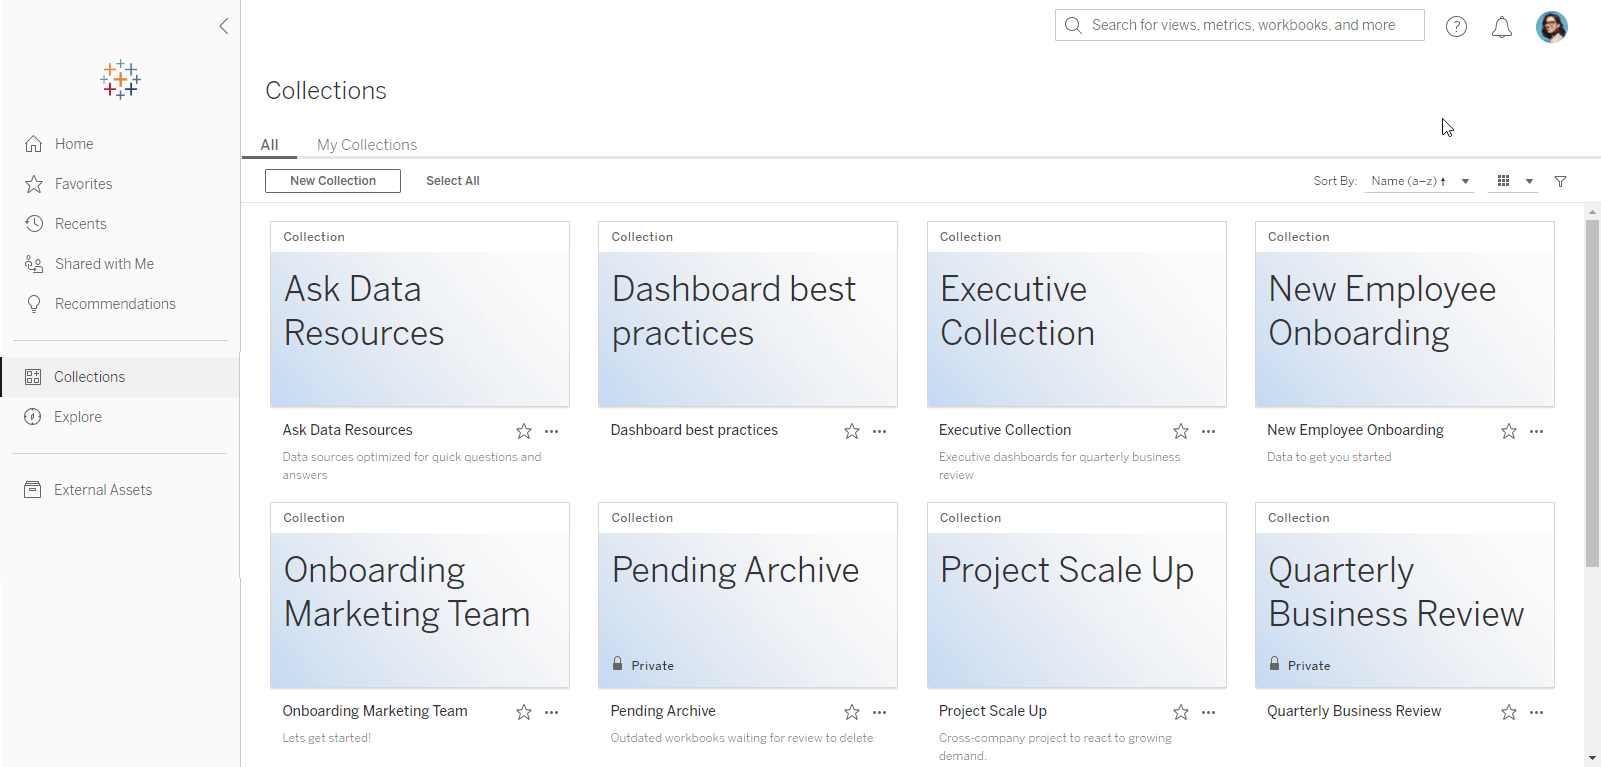
- Organize your content on Tableau Server and Tableau Online with Collections, a new way to bring relevant, meaningful data together in one place.
- Jumpstart your Salesforce connection on Tableau Online with a newly enabled Integration tab that makes it easy to connect to and analyze your data from Sales and Service Cloud.
- Transition seamlessly from web authoring to Tableau Desktop for an improved workflow with connected Desktop for web authoring.
Now we’ll take a deeper look at some of the biggest new features in this release.
Upgrade how you interact with your data with a reimagined Ask Data and Explain Data experience
In Tableau 2021.2, we’re excited to bring an improved, reimagined Ask Data and Explain Data experience to everyone across your organization. That’s right, now everyone with a Tableau license—Creators, Explorers, and now Viewers—can access both Ask Data and Explain Data to better understand their data and drive more meaningful business decisions.
Ask Data
We deeply believe in empowering anyone, technical and non-technical users alike, to be confident in the answers they seek from their data. This begins with confidence in what questions to ask—an increasingly difficult challenge as data in organizations continue to grow and become more complex. Since our initial launch of Ask Data, we’ve been hard at work building out new natural language capabilities. In Tableau 2021.2, we’re excited to introduce a completely redesigned natural language experience for business users. Let’s take a look at the details:
- Dashboard integration: Ask Data has landed in the dashboard! We’ve added a new Ask Data dashboard object so you can seamlessly embed Ask Data into Tableau dashboards. Now, interacting with and asking questions via Ask Data is a natural part of a user’s analytics workflow. Feature Ask Data as a main part of a dashboard, or include it as a show/hide object for additional exploration when needed.
- Entity search: Ask Data’s new search experience makes it easier for users to explore what’s in their data, especially when they are not familiar with the data source. With entity search, users have more control over how their questions are interpreted, and get guidance on what questions can be asked, making it easier to adjust their inputs so that they can get to the result they’re looking for.
- Ask Data Lenses: Lenses are a new content type that makes it easy to curate existing data sources for Ask Data. Analysts (Creators & Explorers) can now create better, curated experiences of Ask Data for others—such as hiding unnecessary fields, adding synonyms, and creating custom vizzes—so that users are asking questions off of the most trusted, accurate data source.
Please note: Ask Data is currently available in English only.
Explain Data
We’ve also broadened the reach of Explain Data with a newly designed user interface, optimized for deeper exploration. Now available for Viewers, Explain Data makes it easier for anyone to explore and interact with data. When you select a mark and run Explain Data, Tableau proposes possible explanations for the drivers of the value of that mark based on statistical models, giving you a jumping-off point to help you explore data more deeply and ask better questions.
Organize your data the way you think with Collections
Finding the data you need for your analysis has never been easier. Collections are a new way to gather the content from across your site on Tableau Online or Server and organize it to fit how you use it. Collections can contain items that span different projects and workbooks, allowing you to reuse content in multiple contexts without additional storage or resources. And, it’s easy to organize and share content around key topics—for example, curated resources for new users for onboarding, or a center of excellence collection that includes dashboards showcasing best practices.
Start leveraging the power of Salesforce and Tableau together
Jumpstart your Salesforce connection
Get users started quickly with their Salesforce data on Tableau Online. Under a newly enabled Integrations tab, you’ll find a new “Connect to Salesforce Data” button that makes it simple to connect to Salesforce Sales or Service Cloud data, automatically pulling it into a ready-to-go dashboard to get your analysis started.
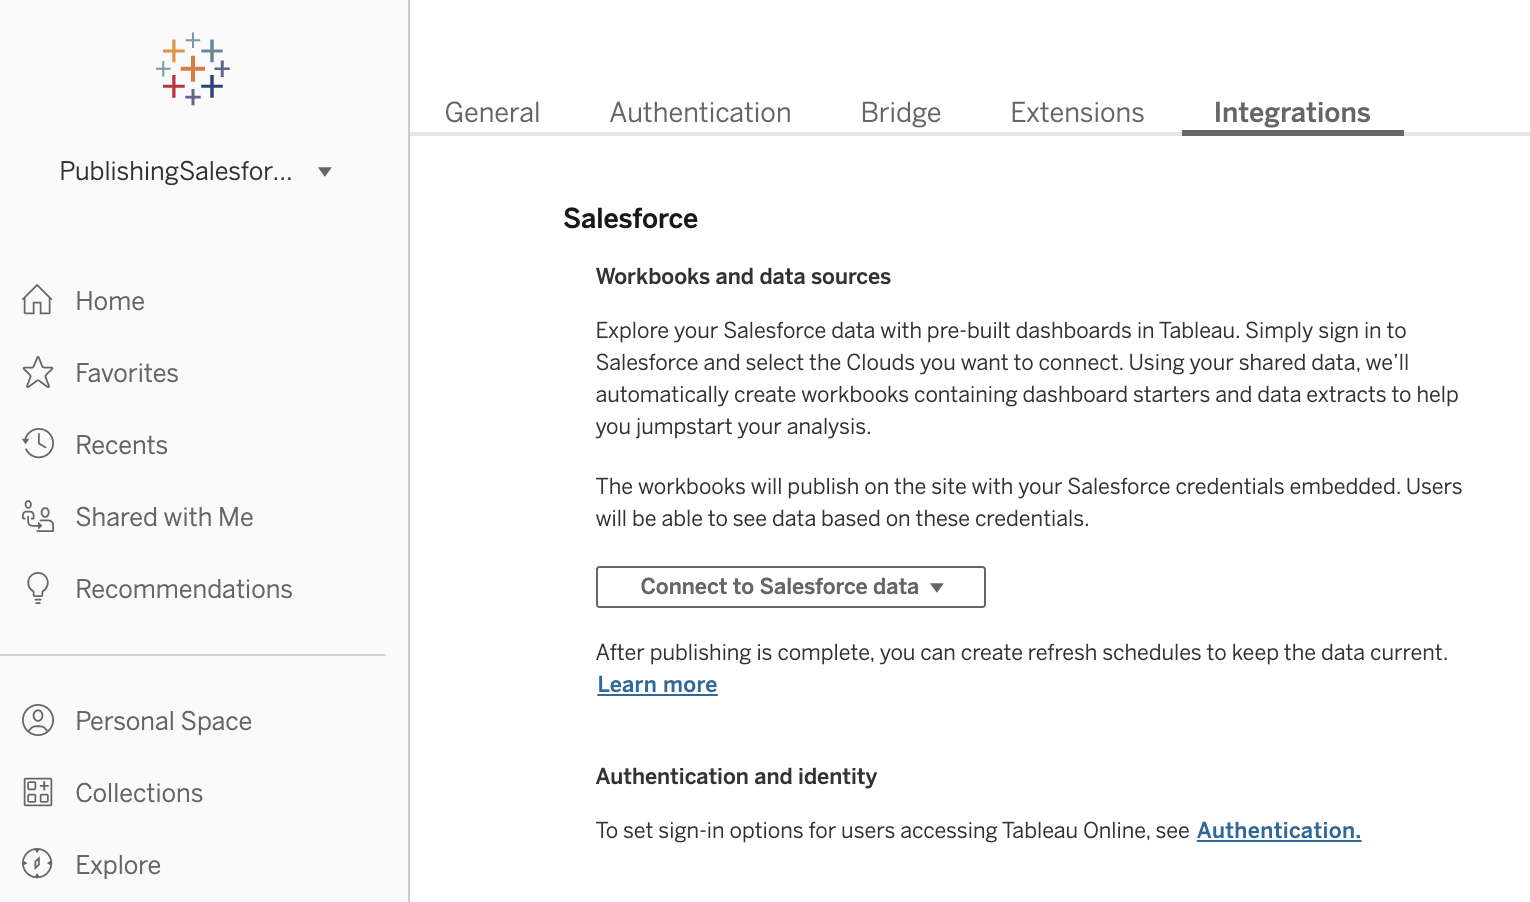
Users can also now log in to their Tableau Online account using their Salesforce login credentials, which means fewer passwords to manage while maintaining quick and secure authentication—a win-win for everyone. Read more about details and setup to get started.
Bulk scoring in Tableau Prep Builder
Write machine learning predictions (scores) from Einstein Discovery directly into your data sets in Tableau Prep web authoring and Tableau Prep Conductor. This integration allows you to score data in bulk, including writing in key drivers of predictions and improvements. Read more about bulk scoring and other Einstein Discovery integrations.
Better workflow, better analysis, better decisions
Connected Desktop for web authoring
We know that switching back and forth between web authoring and Tableau Desktop can be cumbersome and interrupt your workflow—so we’re bringing more flexibility to the authoring experience. Creators can now transition seamlessly from web authoring to Tableau Desktop with a click of a button. Start your workflow in web authoring and choose to transition to Desktop at any point in your analysis, without having to download the workbook locally to your computer. And when you’re finished, simply save to Tableau Online or Server so your content reflects the latest changes for others in your organization.
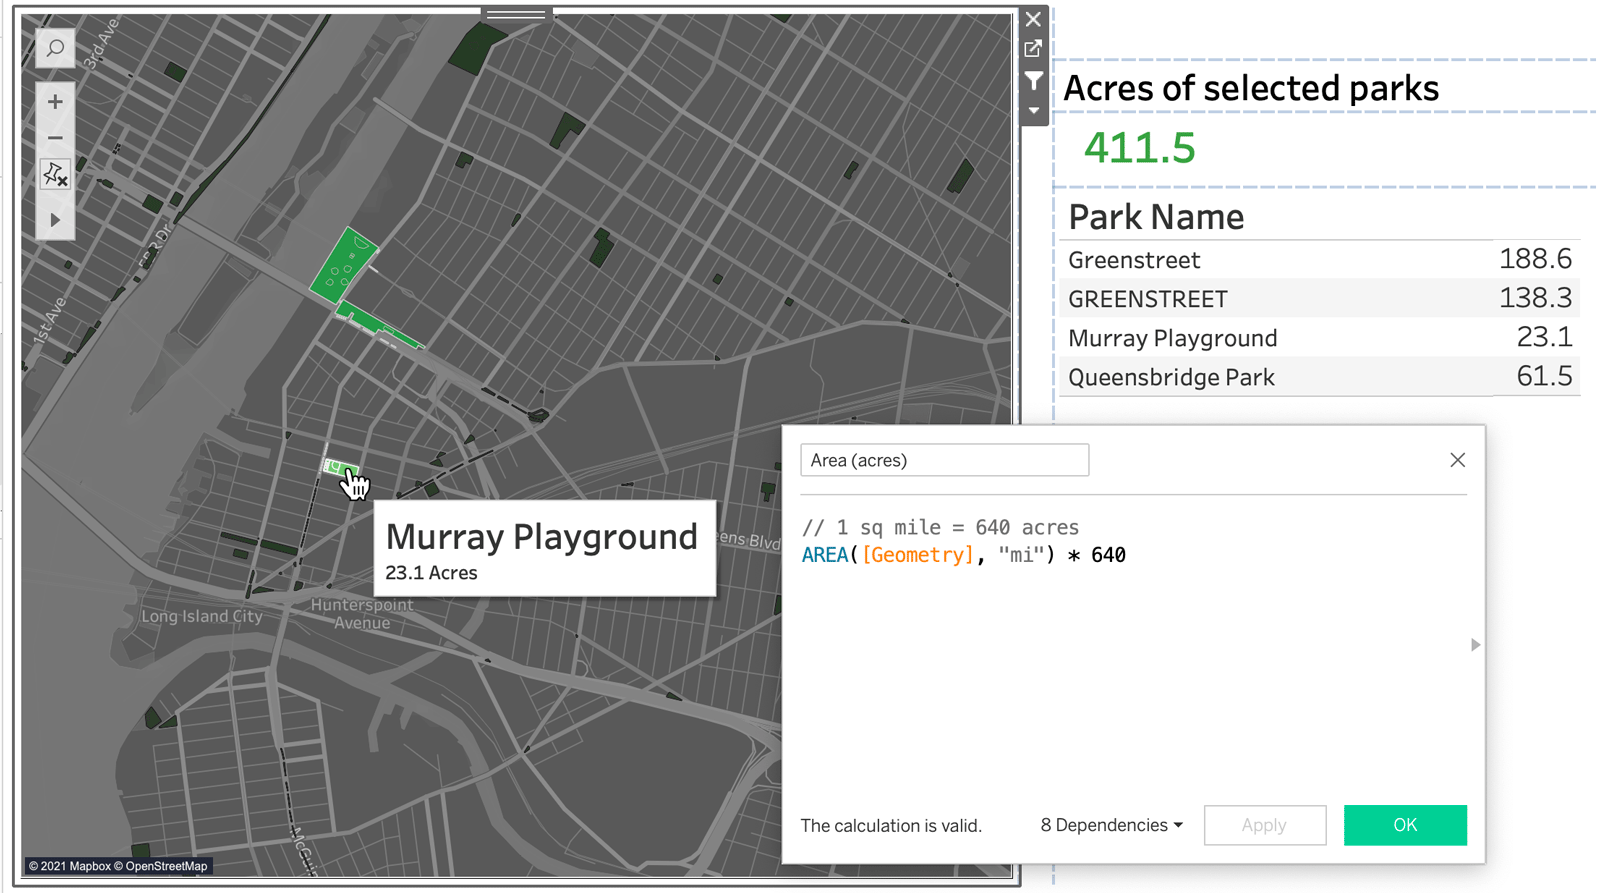
Area spatial calculation + Map layer control
The 2021.2 release also brings a new addition to your geospatial toolkit—the area spatial calc. You can now measure the square area of your selection on a map in units that you specify. Combined with the power of spatial joins, answering location-based questions is easier than ever. For example, in the dashboard, you can easily calculate the total acres of multiple parks you’ve selected on a map. Or, a business could use this to calculate population densities to inform a decision about where to open their next store.
Also new in 21.2 is the map layer control, which allows you to control the visibility and interactivity of marks layers without editing the workbook. When enabled by the author, users can simply use the new toggle settings to customize the map view to best answer their own location questions.
Run Tableau Server on Linux in a container
Containers are quickly becoming the standard way for businesses to leverage the cloud by increasing availability, orchestrating large deployments, and sharing infrastructure. This deployment option adds the ability for our customers to run Tableau Server on Linux in a single container, making production and development deployments easier, faster, and potentially more cost effective.
Thank you, Tableau Community
You are at the heart of everything we do and the Tableau 2021.2 release is no different. We can’t do this without you, so thank you for your continued feedback and inspiration.
Check out the Ideas forum to see all of the features that have been incorporated as a result of your brilliant ideas, and get the newest version of Tableau today.
Related Stories

The Tableau+ Bundle with Premium AI, Enterprise Capabilities, and Premier Success
 June 24, 2026

What is Tableau Prep?
 April 30, 2026
Insights Wherever You Work: Meet the Tableau App for Microsoft 365
 March 16, 2026