And the winner of the Student Viz Assignment Contest is...


With entries from 13 countries for our 2nd Round of our Student Viz Assignment Contest, picking a winner wasn't an easy decision! From entries across the world including George Mason University (US), Nanyang Technological University (SG), The University of Waterloo (CA) and EDHEC (FR), Tableau judges were asked to whittle down the entries to three winning vizzes. All submissions were assessed against their creativity, analytical depth, beauty and design, and their overall impact on the judges. The top three winners will receive a gift bag of coveted Tableau swag for their brilliant work!
So without further ado, the winners for our Round 2 2019 Student Viz Assignment Contest are:
First place
Satisfaction⋅Fulfillment⋅Home
Ryan Soares, Wilfrid Laurier University, Business Administration & Computer Science Major

Ryan Soares from the Wilfrid Laurier University takes first place with his viz exploring Maslow's Hierarchy of Needs. The judges loved Ryan's design and how the visualization flows from one need into another, before reaching the final focal points of Toronto and Montreal.
Users can get a holistic view of Maslow's Hierarchy as it relates to Canada, and understand how 7 major Canadian cities rank in relation to the needs. The viz helps users understand how suitable each city is as a new home for newcomers to Canada.
Second place
Following Roger Federer
Maria Brock, George Mason University, Economics Major
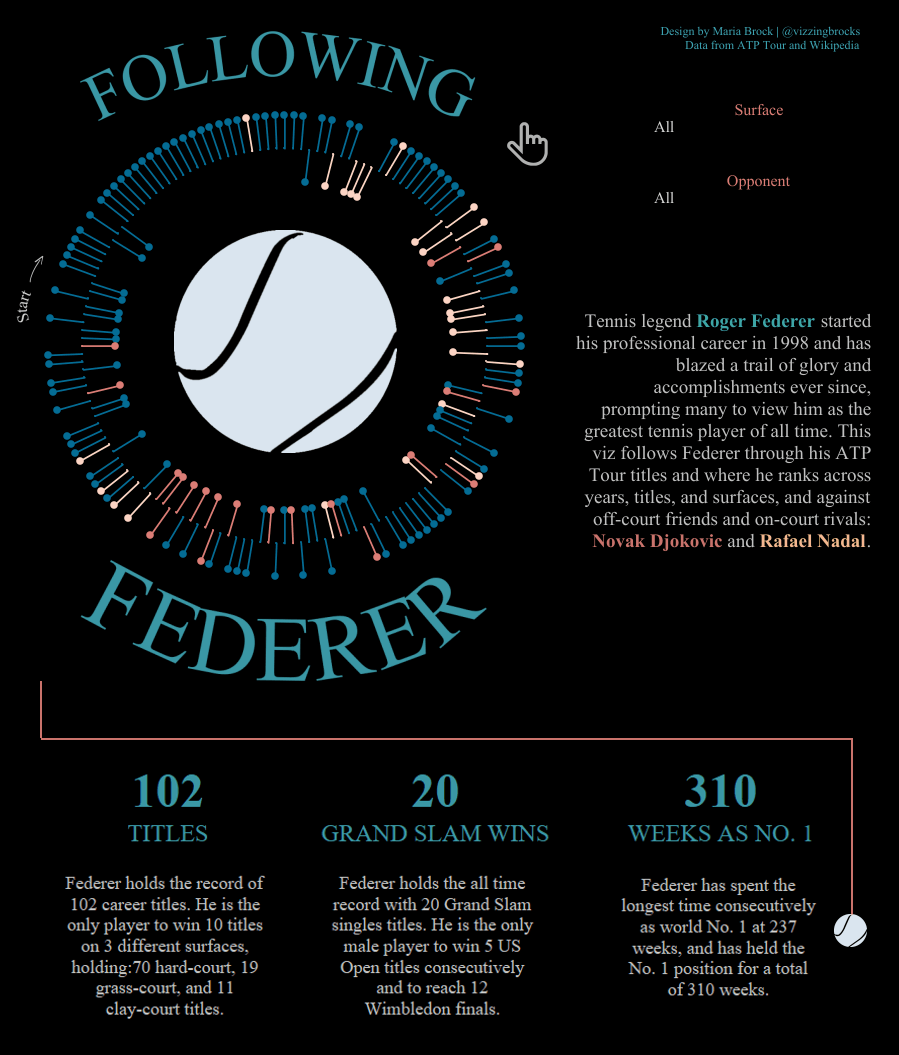
Maria's viz dives deeper into Washington DC’s “big four” sports team and (lack of) advancement to a conference title since 1998. Judges enjoyed Maria's use of color and the tennis ball to maintain the theme. Check out Maria's Tableau Public profile to see how you can build your own interactive resume!
Third place
BTS_BURN THE STAGE
Seoyan Jun, Sookmyung Women's University, Bachelor of Information Science
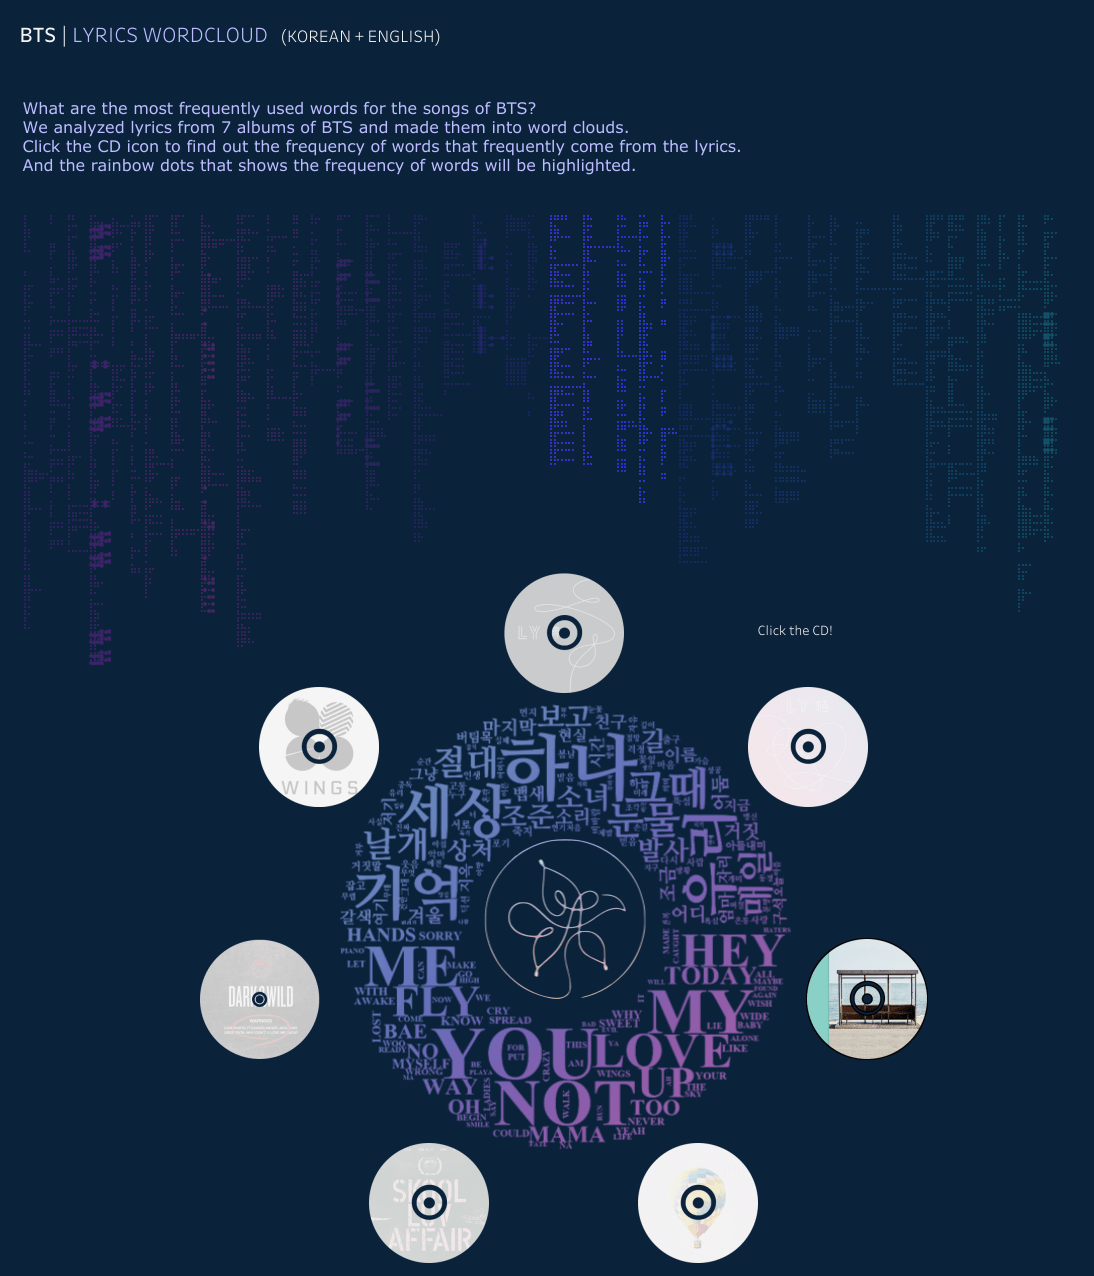
The judges loved Seoyan's creativity in visualizing all the different musical information. Seoyan used a fantastic color palette which was carried throughout the viz. The judges particularly enjoyed the lyric word cloud, linechart and the embedding of Spotify. Check out Seoyan's viz to explore BTS's music!
Best Practice Award
San Francisco Eviction Crisis 1997 - 2018
Isaac Low, Swinburne University of Technology, Bachelor of Computer Science
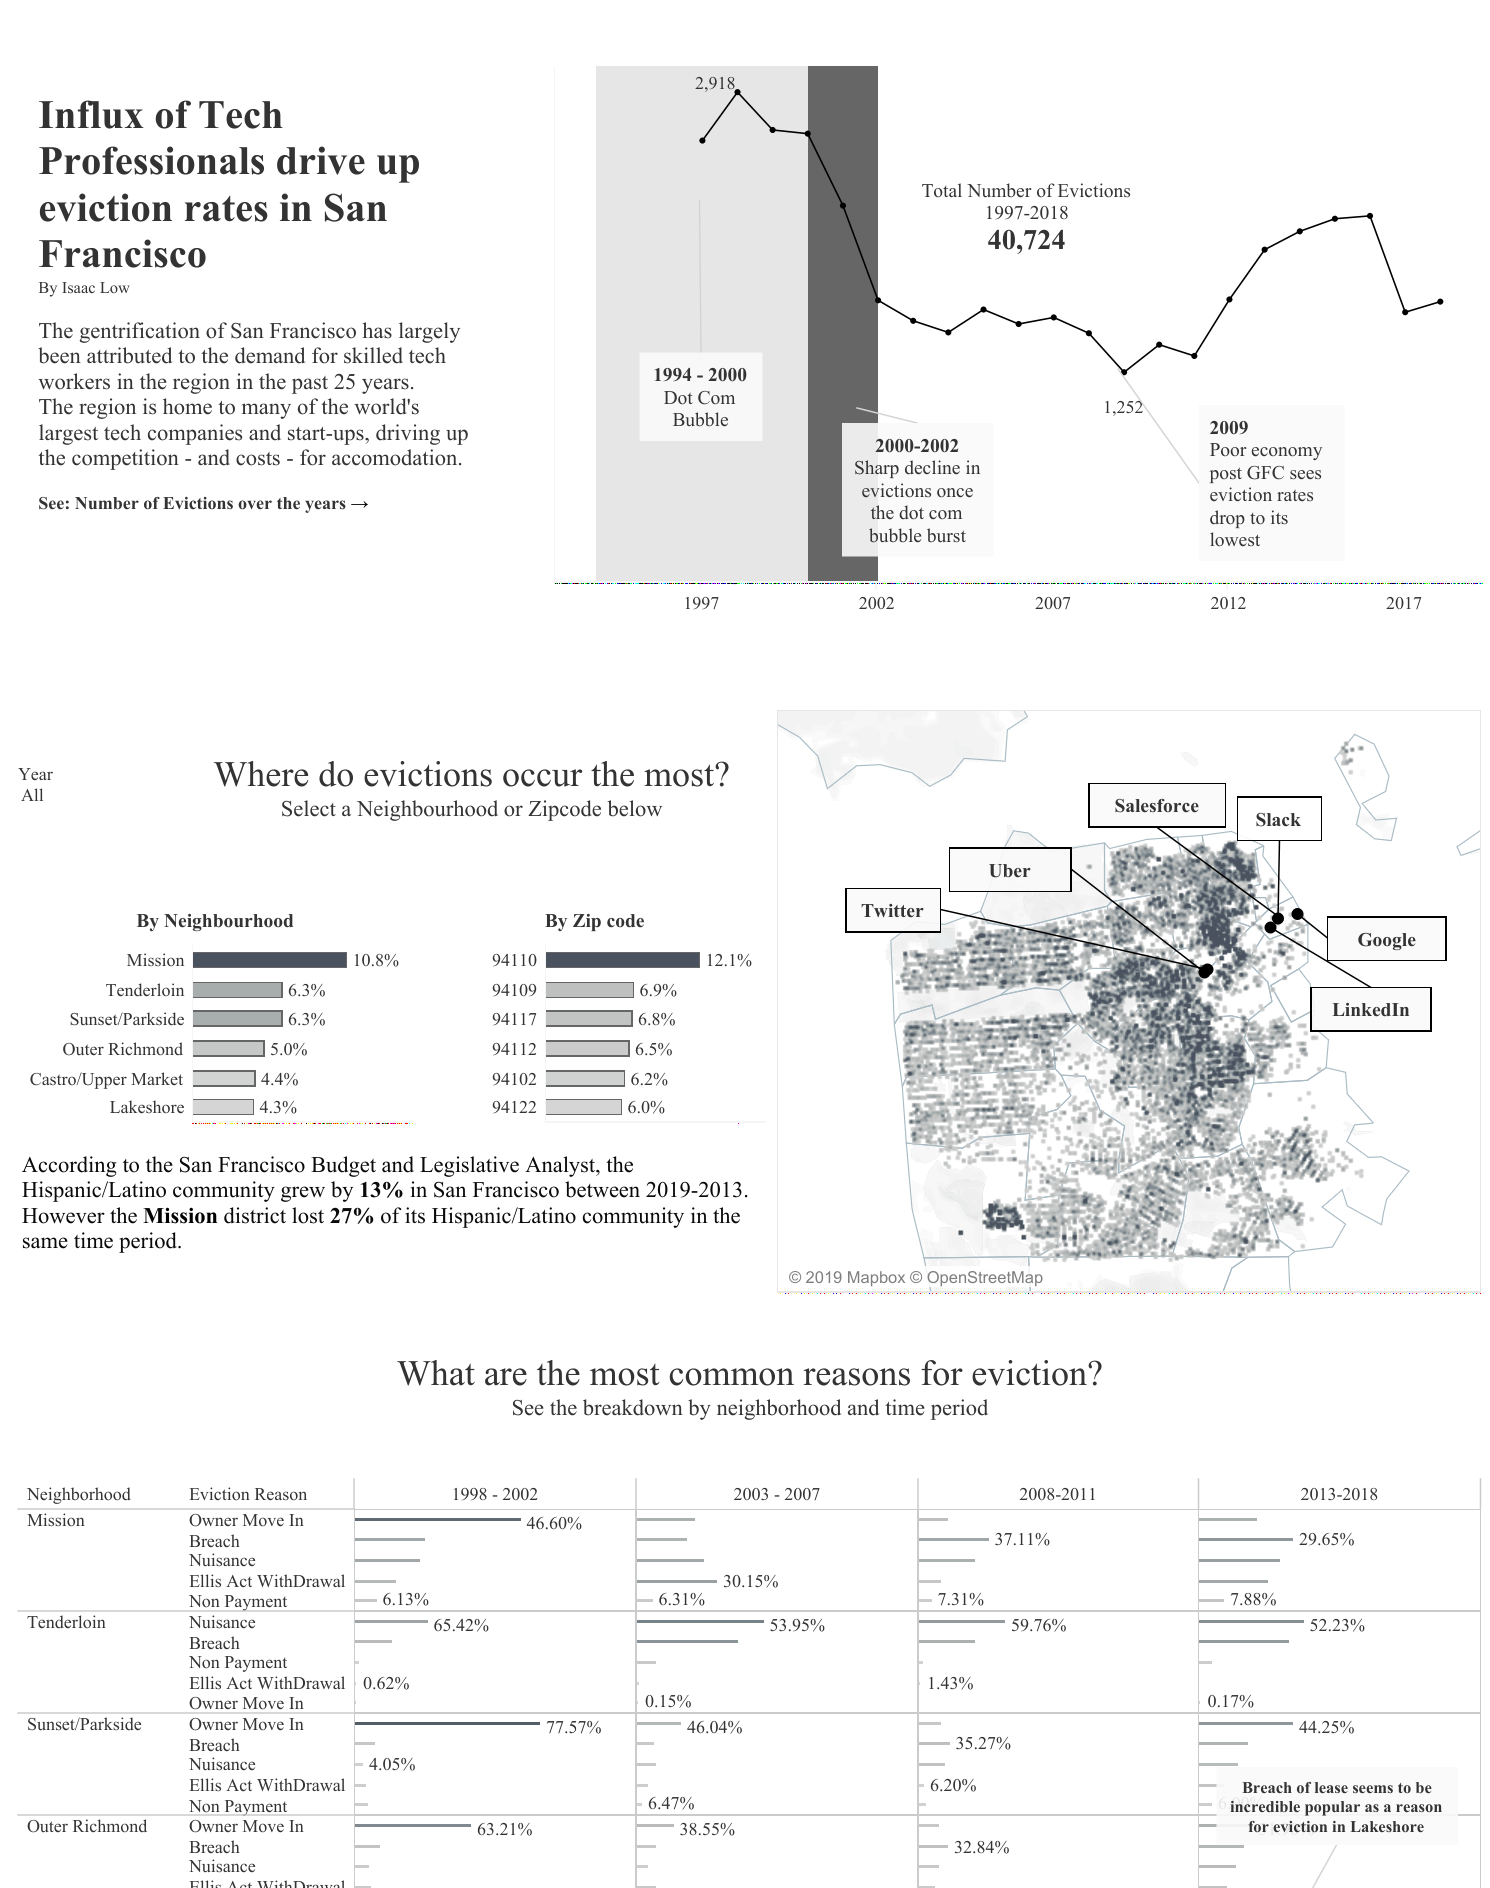
Isaac's colour scheme and choice of graphs earns him the award of Best Practice viz. His choice of graphs were good - by using simple charts with simple highlighting and colour palettes, the user can easily see the patterns.
Honorable mentions
Although we could only pick three winners, there were so many amazing submissions. Here are a few other vizzes we want to call out too:
Singapore's Hawker Culture
Royce Ho, Nanyang Technological University, Bachelor of Business and Accountancy
Jonas Brothers - Happiness Begins
Ying Xue Ng, Nanyang Technological University, Bachelor of Business (Business Analytics)
Thank you once again to all the students that submitted a viz! If you’re a student, you can enter in our next viz assignment contest for your chance to win Tableau swag bags! And don’t forget - you get Tableau for free through our Tableau for Students program.
Are you an instructor? Request new licenses for the upcoming term.
Related Stories
Learn the Basics of Well-Structured Data
 December 6, 2024
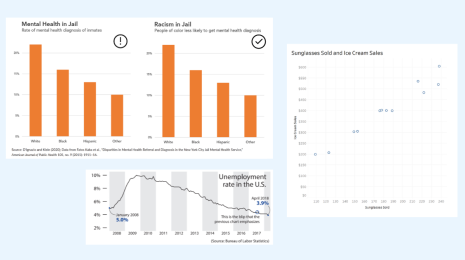
How To Spot Misleading Charts: Review the Message
 October 24, 2024
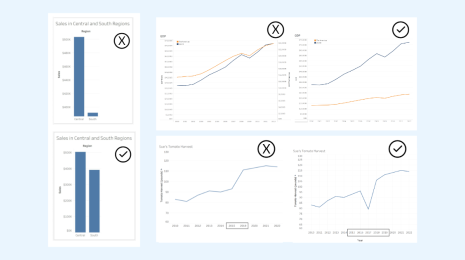
How To Spot Misleading Charts: Check the Axes
October 17, 2024