The One-Click Trick to Creating Headers for Single-Measure Tables


Note: This is a guest post by Tableau Zen Master Jonathan Drummey. This post first appeared on Jonathan's blog, Drawing with Numbers.
This is a little tip that started out with a “Tableau doesn’t do that” and then an “Ooh…it does…that’s so cool!”
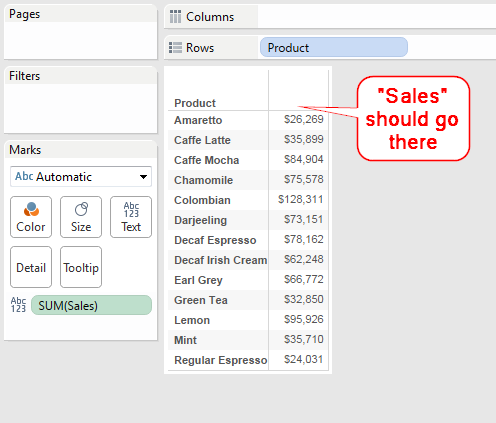
Here’s the problem: In a single-measure table, I want the name of the measure column as a header. In this worksheet, which uses the sample coffee chain data, I want the header “sales” to show up on top of the sales column:
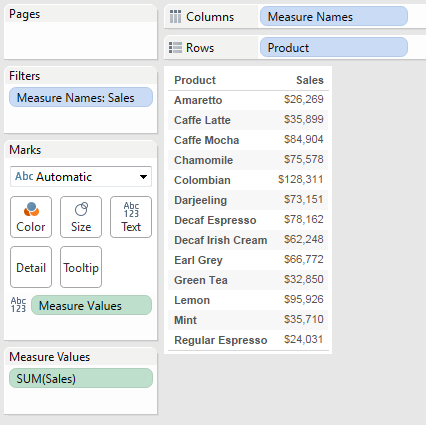
Now there is a bunch of ways to work around this. If you really want to read a comprehensive list, check out the gory details. But there’s a way that tops them all that I learned, thanks to Alberto Bertellino in the aforementioned thread. From the above view (which took two clicks to build), do one (ONE!) more click & drag operation to drop Measure Values over the column, and voila!
As Steve Jobs used to say, “Boom.”
Over the last four years, this tip would have saved me at least a couple of hours of doing things like creating tables with all discretes, and then resizing columns and twiddling with formatting. Multiply that times thousands of Tableau users, and we’re talking person-years.
Got another time-saving tip? Share it in the comments below!
For more tips, tricks, and works by Jonathan, visit his blog and his Tableau Public page.