Celebrating Women's History Month with the Tableau Community


The Tableau Community has put together some ways we’re celebrating Women’s History Month. Join us!
Participate in a Community visualization challenge
Community challenges are created by and for the DataFam as an opportunity to learn, practice, and apply your data skills across a variety of topics, products, and causes.
Sports Viz Sunday Challenge: Celebrate women athletes by participating in this month's Sports Viz Sunday challenge to build a viz using the following data sets:
- Suncorp Super Netball Results courtesy of Abbie Taylor
- 2021 WNBA stats from Basketball Reference
- 2021 Women’s Tennis Grand Slam Final Matches from Jeff Sackmann
Learn more about the challenge and get involved here.
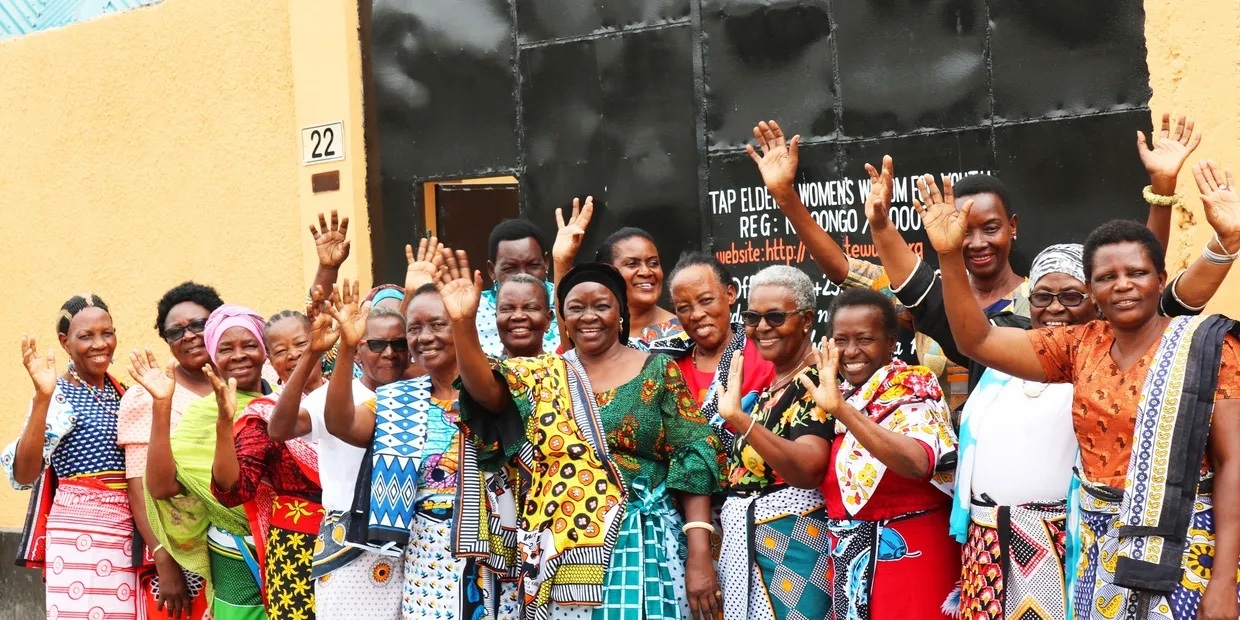
Viz for Social Good Challenge: This month, the Viz for Social Good project will be partnering up with Tap Elderly Women's Wisdom for Youth (TEWWY), an organization dedicated to serving the mental health needs of vulnerable populations. Through this challenge and the visualizations created, the TEWWY’s impact will better reach key stakeholders and help elevate the conversation about mental health in Tanzania, and the importance of enacting mental health care in non-communicable disease policies. Learn more about the project and get involved here.
Attend an upcoming event
Global Data + Women Meetup (March 10) | Register here
Connect with other women (and allies) in data across the globe and hear from incredible guest speakers on their career journeys.
- Forging Your Career in Data & Tech: Eva Murray, Senior Evangelist, EMEA at Snowflake
- How I Pivoted My Career into Dataviz and Design: Alli Torban, Information Design Consultant, Torban Design Studio LLC
- Viz for Social Good Women's History Month Challenge: Amanda Patist, Data Experience Designer at Cargill
Atlanta Tableau User Group Meetup (March 17) | Register here
Tune into a women in data panel discussion hosted by the Atlanta Tableau User Group featuring women in the Tableau Community:
- Jennifer Dawes: Tableau Public Ambassador, BI & Analytics at JLL
- Dinushki De Livera: Tableau Ambassador, Business Analyst at Unifund CCR
- Karen Hinson: Tableau Ambassador, Data & Analytics at Chick-fil-A
- Nancy Joy: Terumo Medical Corporation
Data + Women Germany Meetup (March 26) | Register here
Join the Data + Women Germany chapter as they hear from Melissa Hill Dees, Salesforce MVP speak on ways to amplify the voices of underrepresented employees and combating unconscious bias in company culture. Learn how to leave your microphone on, encourage others to unmute themselves, and recruit allies so all voices can be heard.
Explore visualizations made by the Tableau Community
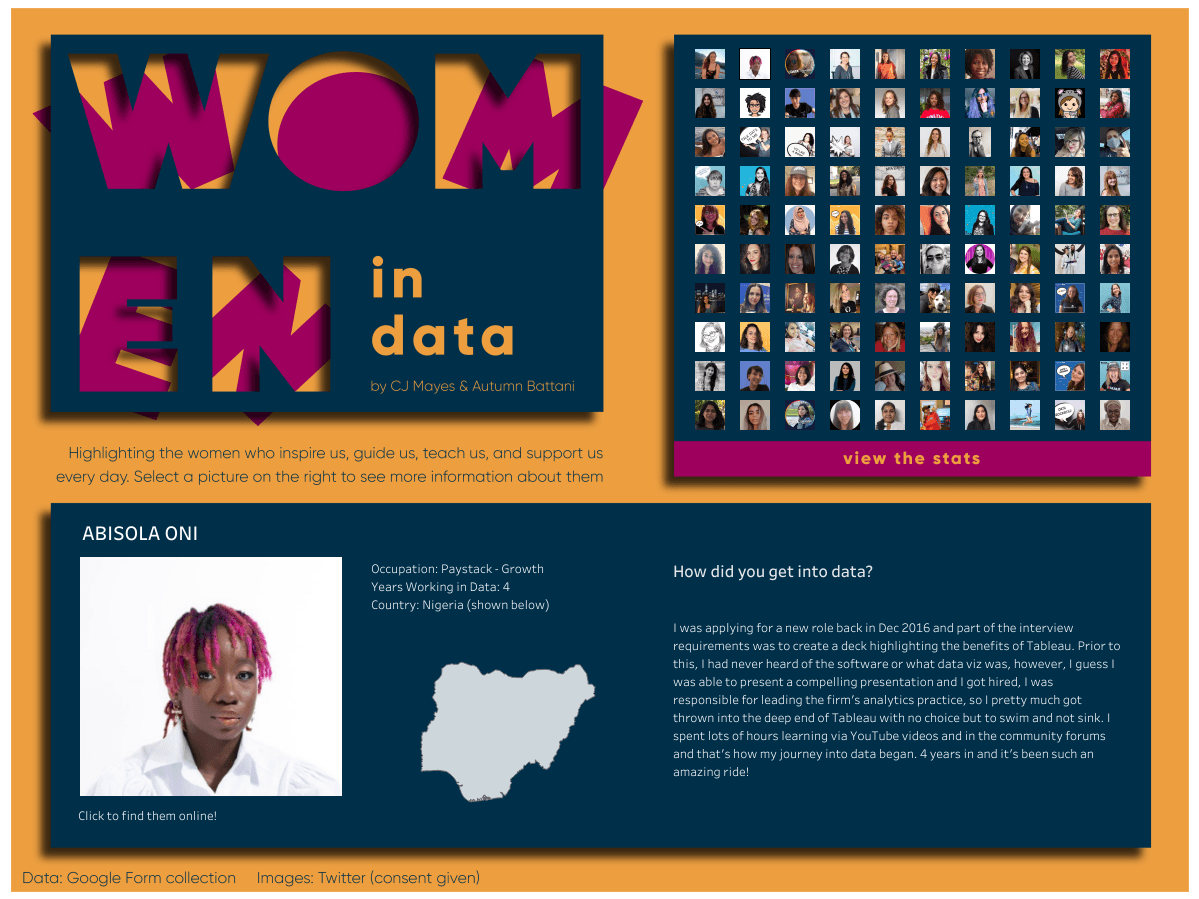
Community members, Autumn Battani and CJ Mayes interviewed 100 women to learn about their experiences in the field of data analytics. Explore this dashboard to hear from some of the extraordinary women who are leading the way in data. Read more behind the viz from Autumn in CJ’s blog post.
Viz of the Day on Tableau Public
Each week, we'll be featuring a viz celebrating Women’s History Month, check them out on our Viz of the Day gallery. Not subscribed yet? Subscribe here and remember that you can also always nominate a viz to be featured.