Black History Month Celebrated: Week 3 Roundup


The third week of Black History Month comes to an end, but #VisualizeDiversity continues! The submission window for #VizforSocialGood will remain open until Thursday, March 15th. Chloe Tseng challenged participants to create a dialogue around women in politics by leveraging data visualization. Here are some examples of Tableau Public authors doing just that.
- Bart Popęda: Women of colors in US Congress
- Pamela Germain: Black History Month 2018 Week 3 - U.S. Congress
- Yoshihito Kimura: Black History Month W3 "Women in Politics" viz for social good
- Chloe Tseng: #VizforSocialGood: VOTE: Women
- Marcela Janowska: Uganda Woman Voice - Viz for Social Good | Vizualise Diversity
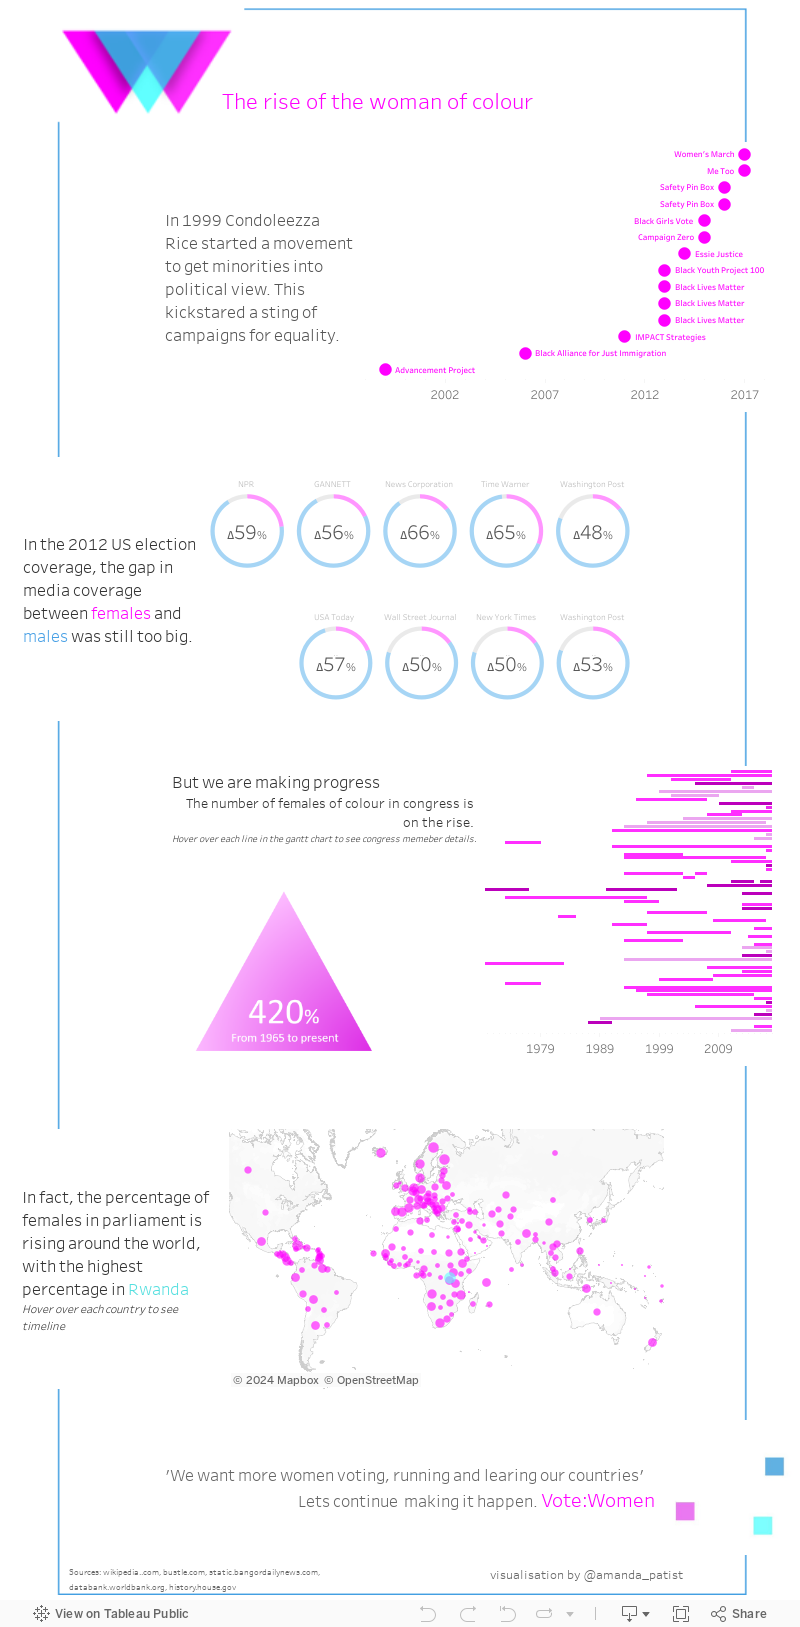
The rise of the woman of colour by Amanda Patist
The fourth and final theme for #VisualizeDiversity is Civic Engagement & Politics. Below are a couple data sets that might help you get started, but this data only scratches the surface of civic engagement and politics. Have a different data set in mind? Add to the discussion tab on data.world.
- U.S. Naturalizations sourced from U.S. Department of Homeland Security
- Notable U.S. Immigrants sourced from Wikipedia
We encourage anyone to participate and help us inform, highlight and celebrate Black History Month.
Related Stories

Iron Viz 2026: Read Between the Data
 May 28, 2026

Tableau's Iron Viz Winners

Explore the 2026 Iron Viz Entries
 December 15, 2025